| Param | Original file | Final file |
|---|---|---|
| Filename | modeM0/AS1A07_049T01_9000003298_22302cztM0_level2.evt | modeM0/AS1A07_049T01_9000003298_22302cztM0_level2_quad_clean.evt |
| Size (bytes) | 435,208,320 | 94,412,160 |
| Size | 415.0 MB | 90.0 MB |
| Events in quadrant A | 3,068,044 | 612,560 |
| Events in quadrant B | 3,156,160 | 630,701 |
| Events in quadrant C | 3,169,489 | 593,240 |
| Events in quadrant D | 3,343,967 | 568,775 |
| Mode SS | |||
|---|---|---|---|
| Quadrant | BADHDUFLAG | Total packets | Discarded packets |
| A | 0 | 132 | 0 |
| B | 0 | 132 | 0 |
| C | 0 | 132 | 0 |
| D | 0 | 132 | 0 |
| Mode M9 | |||
|---|---|---|---|
| Quadrant | BADHDUFLAG | Total packets | Discarded packets |
| A | 0 | 15 | 0 |
| B | 0 | 16 | 0 |
| C | 0 | 16 | 0 |
| D | 0 | 16 | 0 |
| Mode M0 | |||
|---|---|---|---|
| Quadrant | BADHDUFLAG | Total packets | Discarded packets |
| A | 0 | 13363 | 2 |
| B | 0 | 13540 | 2 |
| C | 0 | 13522 | 2 |
| D | 0 | 14407 | 2 |
| Quadrant | Total seconds | Saturated seconds | Saturation percentage |
|---|---|---|---|
| A | 6509 | 20 | 0.307267% |
| B | 6509 | 23 | 0.353357% |
| C | 6509 | 56 | 0.860347% |
| D | 6509 | 90 | 1.382701% |
Noise dominated data is calculated using 1-second bins in cleaned event files. If a bin has >2000 counts, and if more than 50% of those come from <1% of pixels, then it is considered to be noise-dominated and hence unusable.
| Quadrant | # 1 sec bins | Bins with >0 counts | Bins with >2000 counts | High rate bins dominated by noise | Noise dominated (total time) | Noise dominated (detector-on time) | Marked lightcurve |
|---|---|---|---|---|---|---|---|
| A | 7614 | 6510 | 0 | 0 | 0.00% | 0.00% | 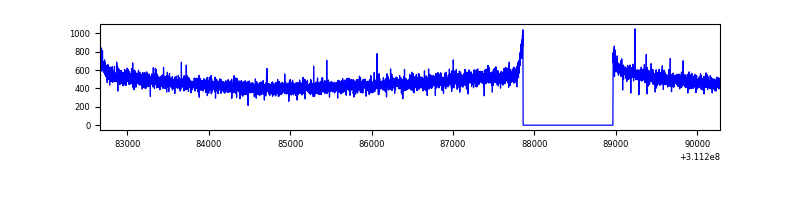 |
| B | 7614 | 6510 | 0 | 0 | 0.00% | 0.00% | 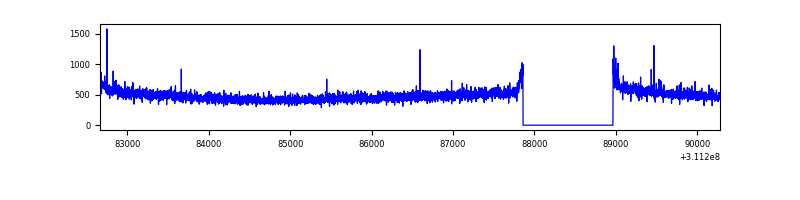 |
| C | 7614 | 6510 | 0 | 0 | 0.00% | 0.00% | 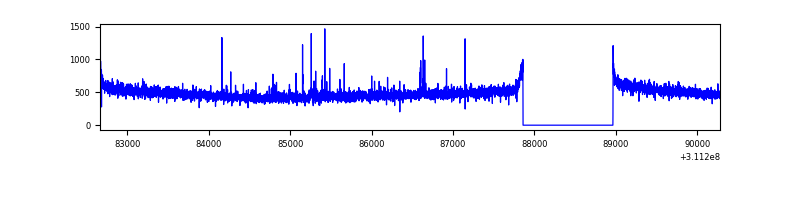 |
| D | 7614 | 6510 | 55 | 55 | 0.72% | 0.84% | 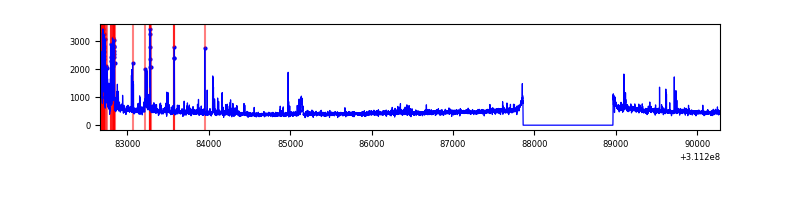 |
Top three noisy pixels from each quadrant. If the there are fewer than three noisy pixels in the level2.evt file, extra rows are filled as -1
| Pixel properties | Quadrant properties | ||||||
|---|---|---|---|---|---|---|---|
| Quadrant | DetID | PixID | Counts | Sigma | Mean | Median | Sigma |
| A | 13 | 254 | 8619 | 49.07 | 796 | 780 | 159.8 |
| A | 3 | 137 | 7034 | 39.15 | 796 | 780 | 159.8 |
| A | 0 | 226 | 6714 | 37.15 | 796 | 780 | 159.8 |
| B | 12 | 111 | 18188 | 114.62 | 799 | 779 | 151.9 |
| B | 11 | 111 | 16138 | 101.12 | 799 | 779 | 151.9 |
| B | 14 | 111 | 14126 | 87.87 | 799 | 779 | 151.9 |
| C | 14 | 238 | 121739 | 670.61 | 771 | 775 | 180.4 |
| C | 10 | 1 | 31282 | 169.13 | 771 | 775 | 180.4 |
| C | 3 | 9 | 6040 | 29.19 | 771 | 775 | 180.4 |
| D | 1 | 52 | 314400 | 1673.78 | 771 | 748 | 187.4 |
| D | 2 | 136 | 49813 | 261.83 | 771 | 748 | 187.4 |
| D | 7 | 223 | 34179 | 178.4 | 771 | 748 | 187.4 |
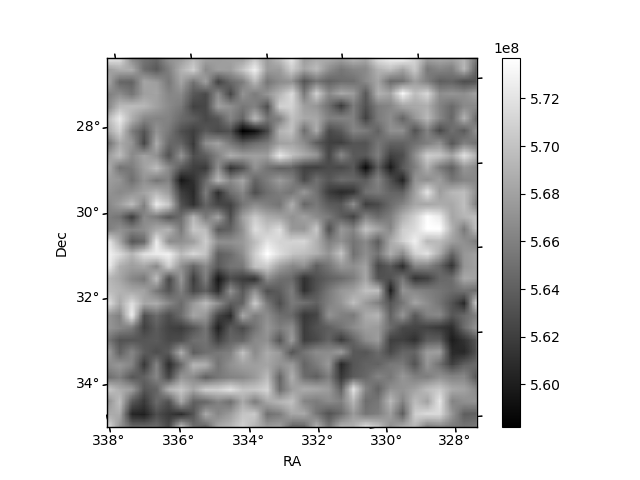
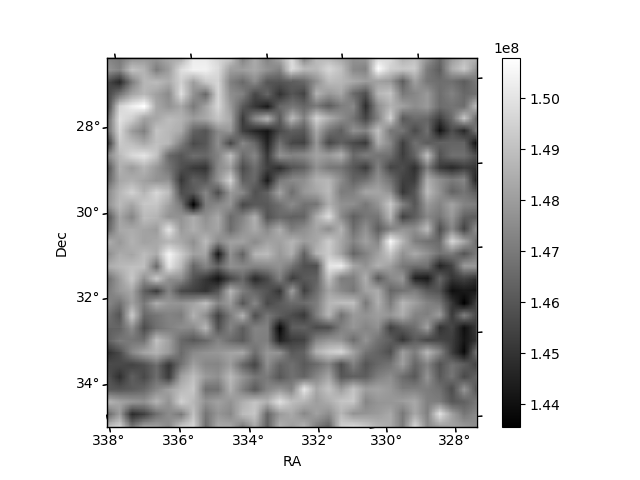
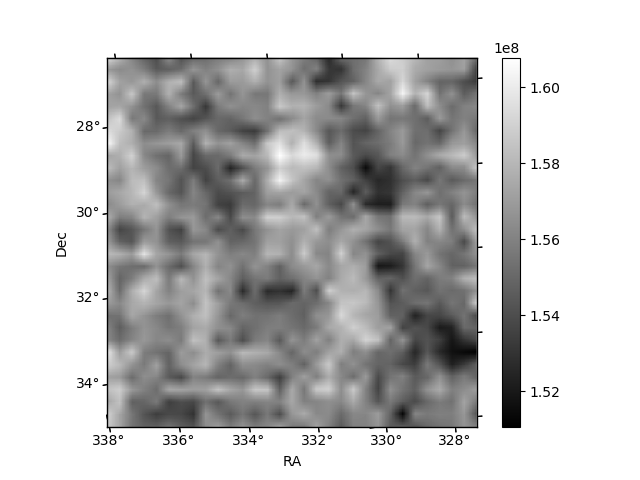
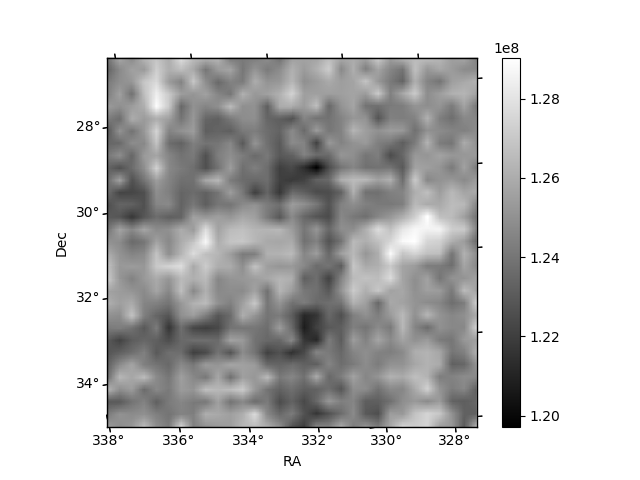
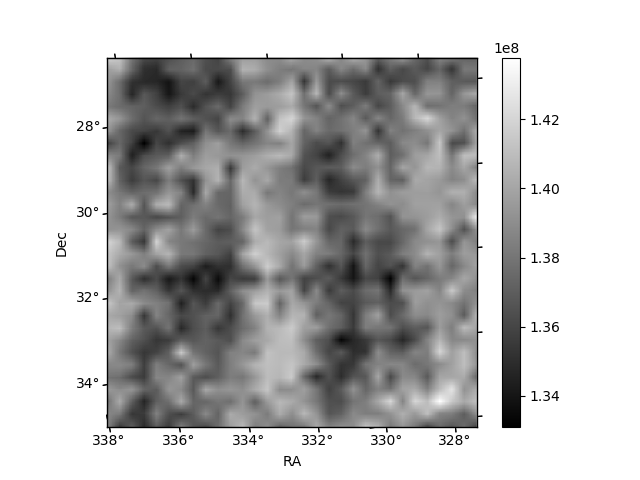
Histogram calculated using DETX and DETY for each event in the final _common_clean file
| Quadrant A | 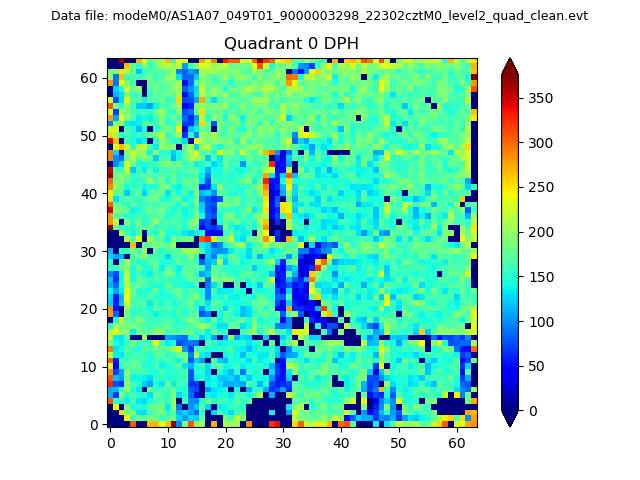 |
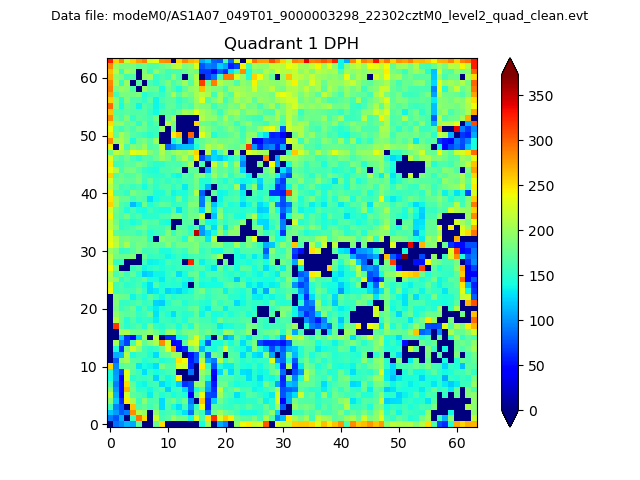 |
Quadrant B |
|---|---|---|---|
| Quadrant D | 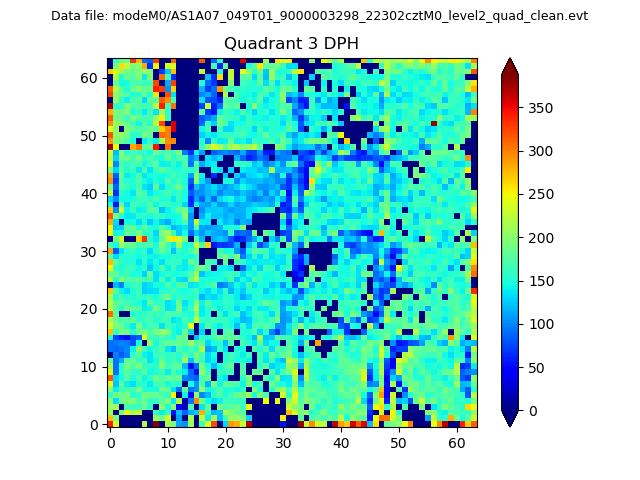 |
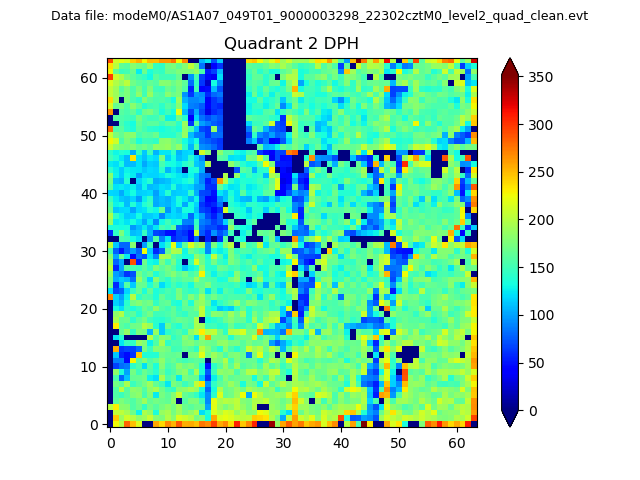 |
Quadrant C |
| Plot type | Count rate plots | Images |
|---|---|---|
| Comparison with Poisson distribution Blue bars denote a histogram of data divided into 1 sec bins. Red curve is a Poisson curve with rate = median count rate of data. |
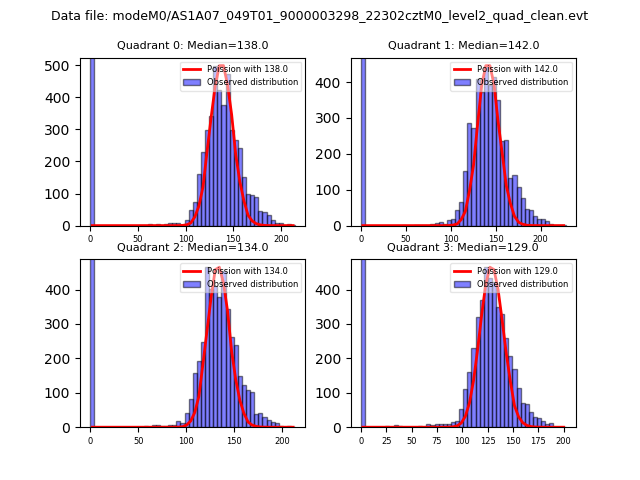 |
 |
| Quadrant-wise count rates Data is divided into 100 sec bins |
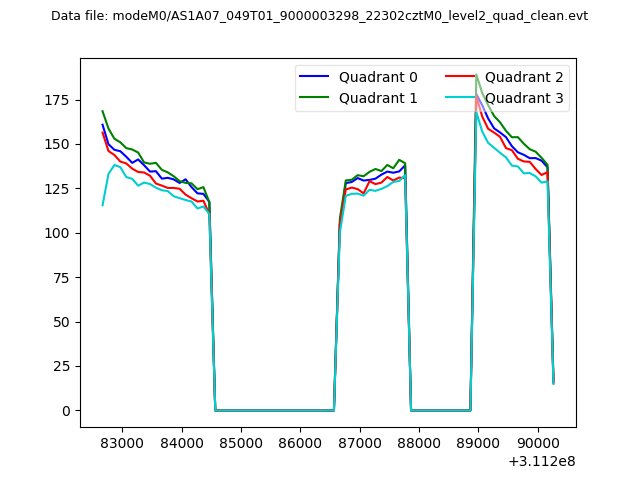 |
|
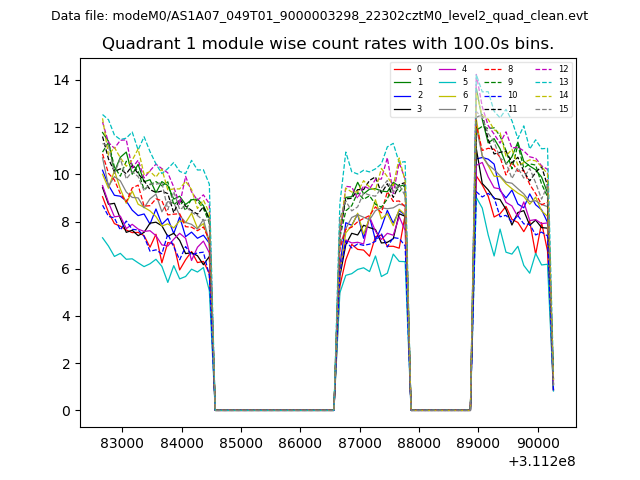
| Module-wise count rates for Quadrant A Data is divided into 100 sec bins |
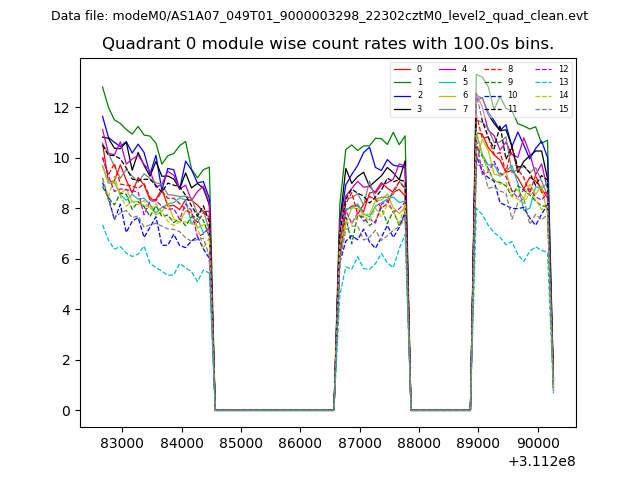 |
 |
| Module-wise count rates for Quadrant B Data is divided into 100 sec bins |
 |
 |
| Module-wise count rates for Quadrant C Data is divided into 100 sec bins |
 |
 |
| Module-wise count rates for Quadrant D Data is divided into 100 sec bins |
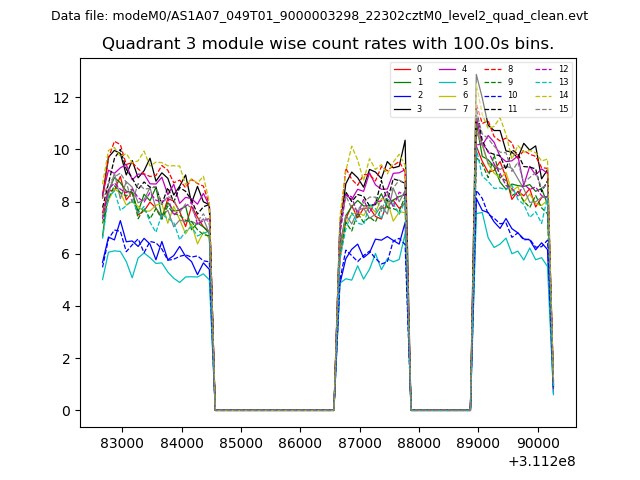 |
 |
| Parameter | Plot |
|---|---|
| CZT HV Monitor | 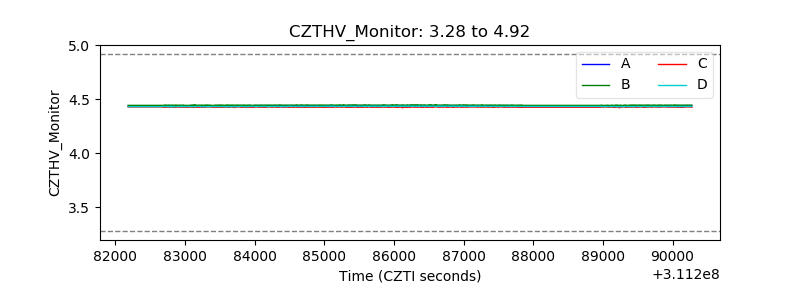 |
| D_VDD | 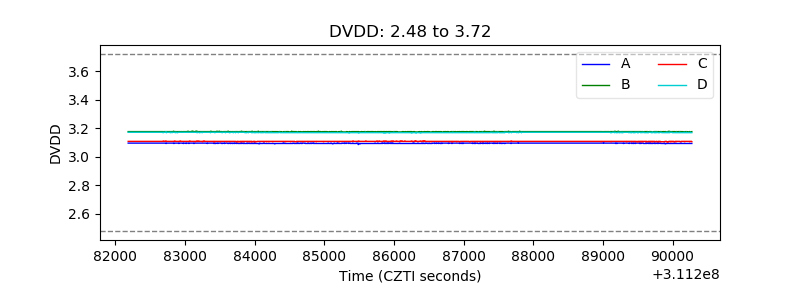 |
| Temperature 1 | 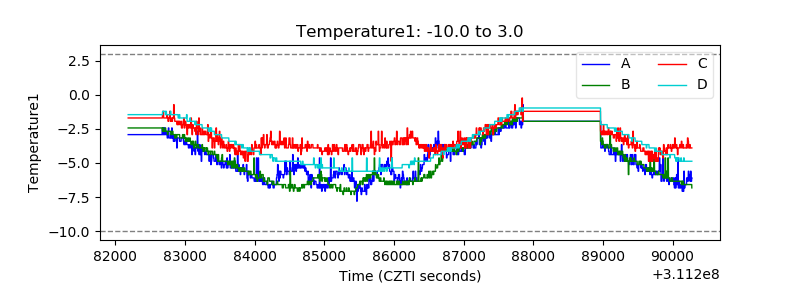 |
| Veto HV Monitor | 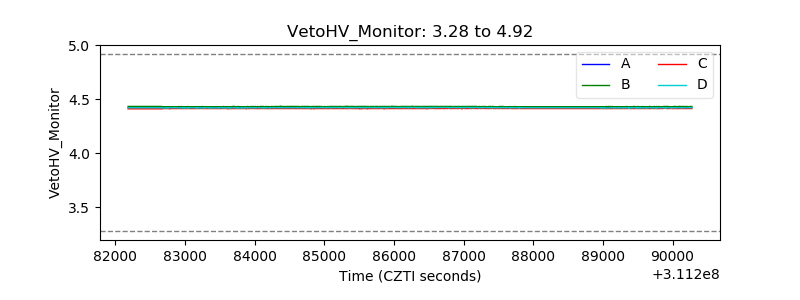 |
| Veto LLD | 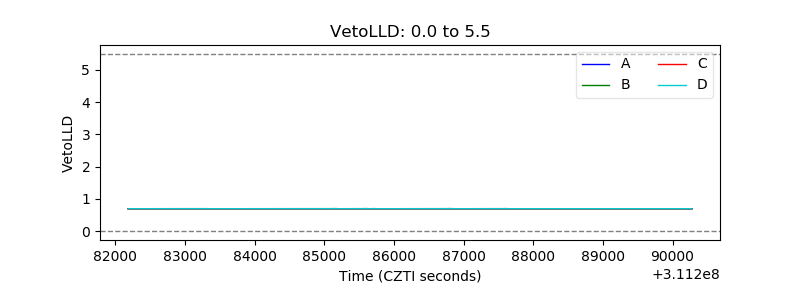 |
| Alpha Counter | 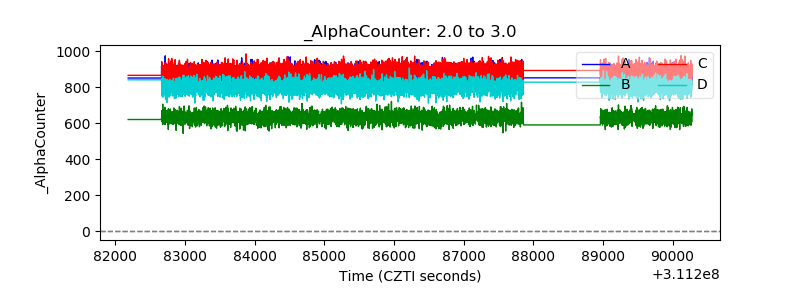 |
| _CPM_Rate | 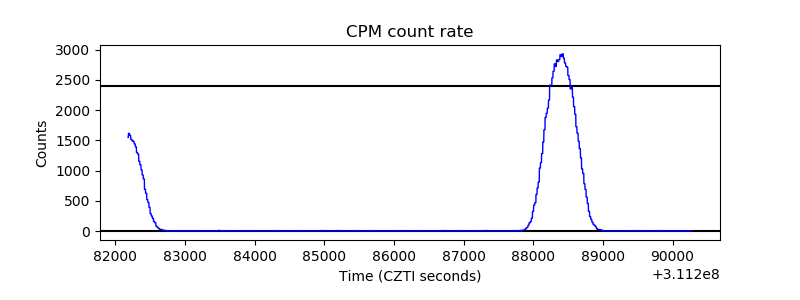 |
| CZT Counter | 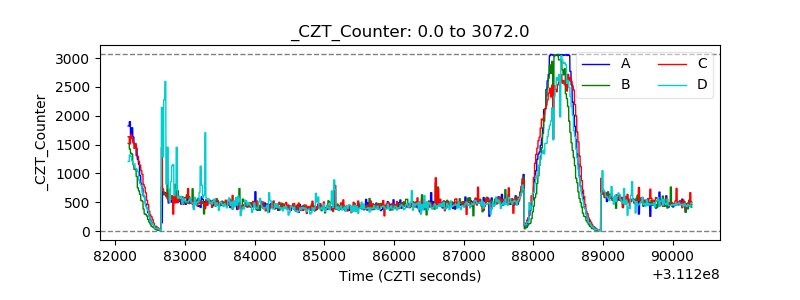 |
| +2.5 Volts monitor |  |
| +5 Volts monitor | 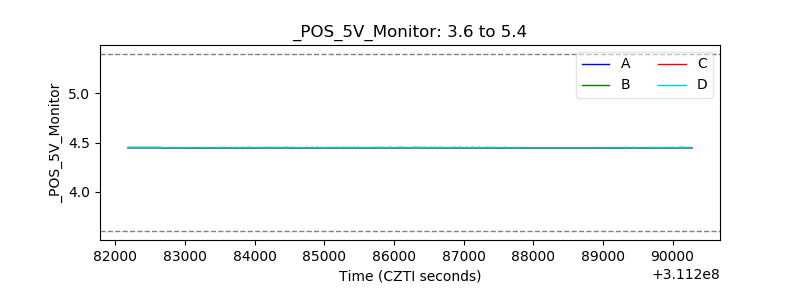 |
| _ROLL_ROT | 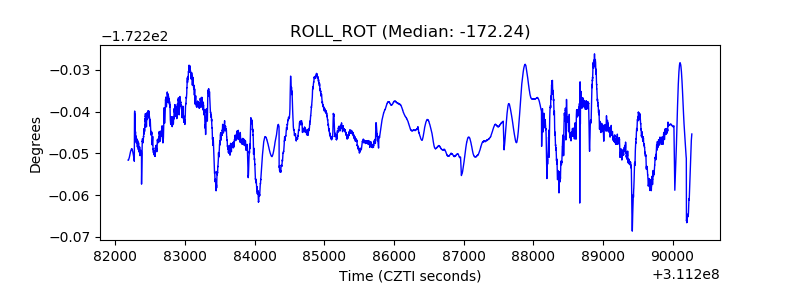 |
| _Roll_DEC | 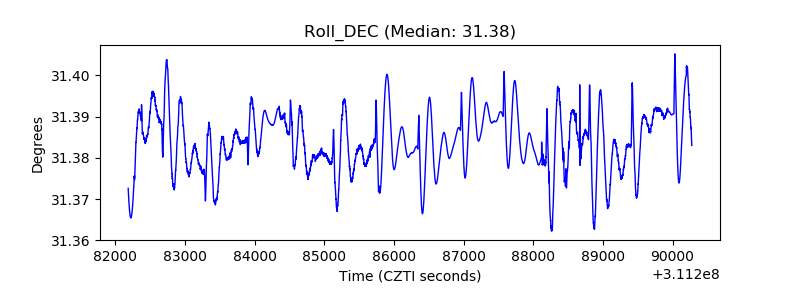 |
| _Roll_RA | 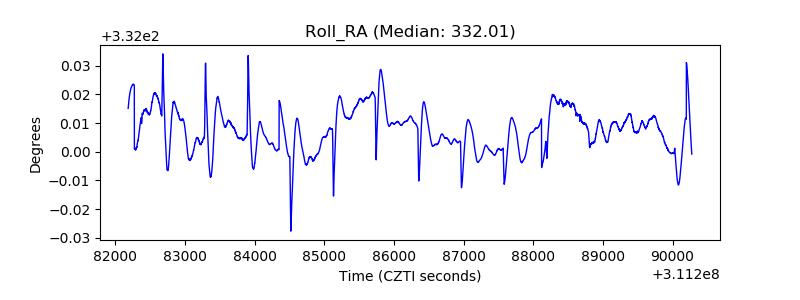 |
| Veto Counter | 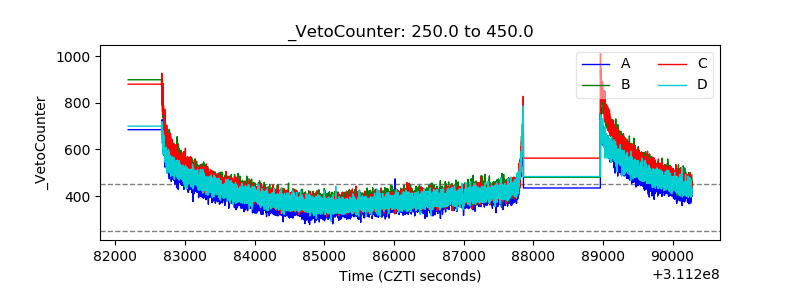 |