| Param | Original file | Final file |
|---|---|---|
| Filename | modeM0/AS1A07_049T01_9000003298_22303cztM0_level2.evt | modeM0/AS1A07_049T01_9000003298_22303cztM0_level2_quad_clean.evt |
| Size (bytes) | 427,559,040 | 90,956,160 |
| Size | 407.8 MB | 86.7 MB |
| Events in quadrant A | 3,096,726 | 586,518 |
| Events in quadrant B | 3,193,204 | 608,482 |
| Events in quadrant C | 3,165,321 | 567,976 |
| Events in quadrant D | 3,061,188 | 547,956 |
| Mode SS | |||
|---|---|---|---|
| Quadrant | BADHDUFLAG | Total packets | Discarded packets |
| A | 0 | 130 | 0 |
| B | 0 | 130 | 0 |
| C | 0 | 130 | 0 |
| D | 0 | 130 | 0 |
| Mode M9 | |||
|---|---|---|---|
| Quadrant | BADHDUFLAG | Total packets | Discarded packets |
| A | 0 | 21 | 0 |
| B | 0 | 22 | 0 |
| C | 0 | 22 | 0 |
| D | 0 | 22 | 0 |
| Mode M0 | |||
|---|---|---|---|
| Quadrant | BADHDUFLAG | Total packets | Discarded packets |
| A | 0 | 13191 | 2 |
| B | 0 | 13428 | 2 |
| C | 0 | 13389 | 2 |
| D | 0 | 13336 | 2 |
| Quadrant | Total seconds | Saturated seconds | Saturation percentage |
|---|---|---|---|
| A | 6353 | 15 | 0.236109% |
| B | 6353 | 19 | 0.299071% |
| C | 6353 | 59 | 0.928695% |
| D | 6353 | 18 | 0.283331% |
Noise dominated data is calculated using 1-second bins in cleaned event files. If a bin has >2000 counts, and if more than 50% of those come from <1% of pixels, then it is considered to be noise-dominated and hence unusable.
| Quadrant | # 1 sec bins | Bins with >0 counts | Bins with >2000 counts | High rate bins dominated by noise | Noise dominated (total time) | Noise dominated (detector-on time) | Marked lightcurve |
|---|---|---|---|---|---|---|---|
| A | 7598 | 6354 | 0 | 0 | 0.00% | 0.00% | 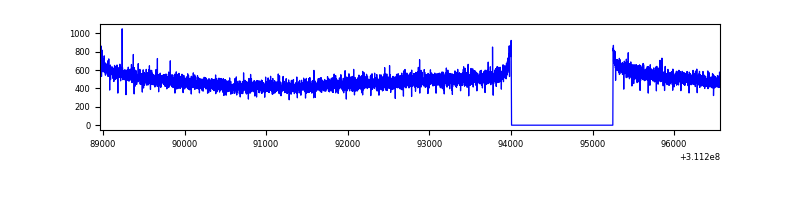 |
| B | 7598 | 6354 | 0 | 0 | 0.00% | 0.00% | 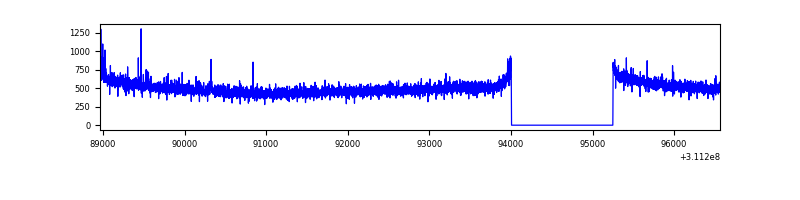 |
| C | 7598 | 6354 | 0 | 0 | 0.00% | 0.00% | 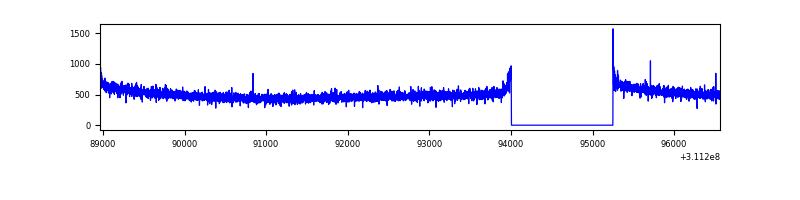 |
| D | 7598 | 6354 | 3 | 3 | 0.04% | 0.05% | 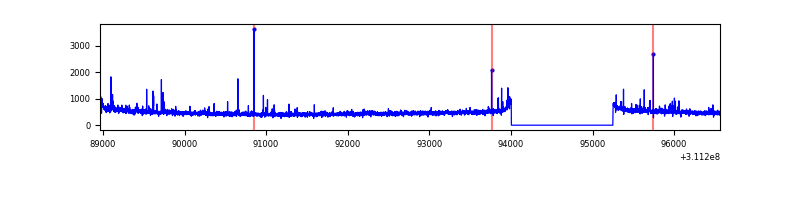 |
Top three noisy pixels from each quadrant. If the there are fewer than three noisy pixels in the level2.evt file, extra rows are filled as -1
| Pixel properties | Quadrant properties | ||||||
|---|---|---|---|---|---|---|---|
| Quadrant | DetID | PixID | Counts | Sigma | Mean | Median | Sigma |
| A | 13 | 254 | 7781 | 43.34 | 803 | 788 | 161.4 |
| A | 0 | 226 | 6948 | 38.18 | 803 | 788 | 161.4 |
| A | 3 | 137 | 6670 | 36.45 | 803 | 788 | 161.4 |
| B | 12 | 111 | 18055 | 112.35 | 810 | 792 | 153.7 |
| B | 11 | 111 | 15864 | 98.09 | 810 | 792 | 153.7 |
| B | 14 | 111 | 14388 | 88.48 | 810 | 792 | 153.7 |
| C | 14 | 238 | 124529 | 683.37 | 779 | 785 | 181.1 |
| C | 0 | 10 | 7027 | 34.47 | 779 | 785 | 181.1 |
| C | 13 | 61 | 5431 | 25.66 | 779 | 785 | 181.1 |
| D | 1 | 52 | 39293 | 203.11 | 780 | 759 | 189.7 |
| D | 2 | 136 | 25655 | 131.22 | 780 | 759 | 189.7 |
| D | 2 | 234 | 23878 | 121.86 | 780 | 759 | 189.7 |
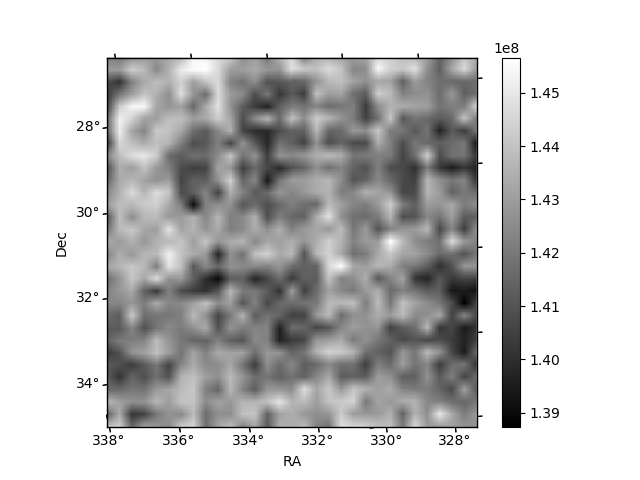
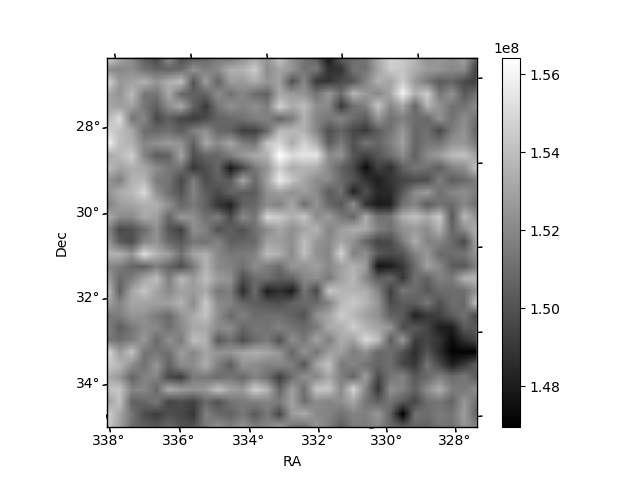
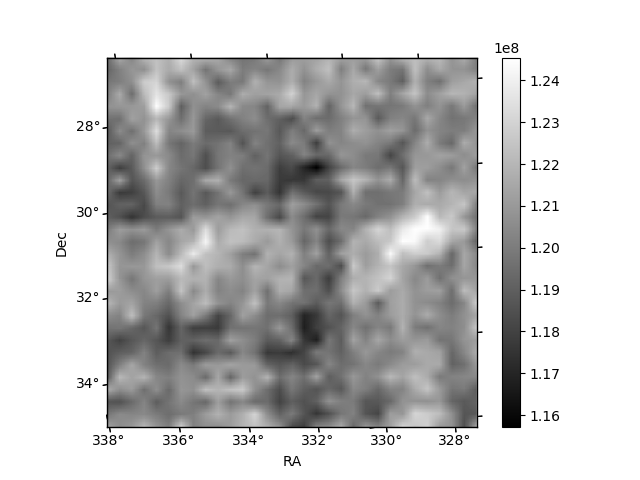
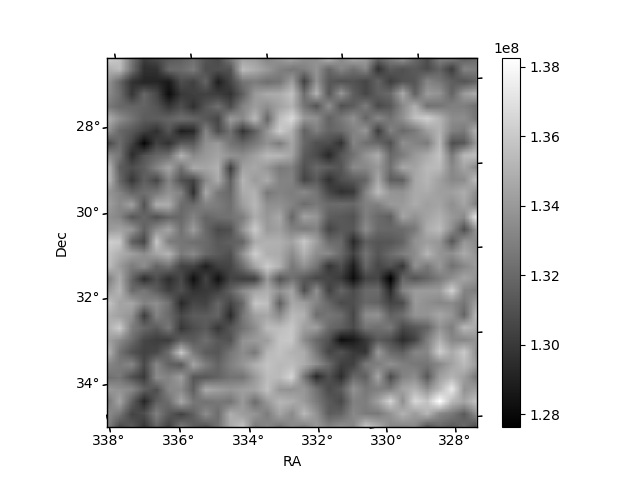
Histogram calculated using DETX and DETY for each event in the final _common_clean file
| Quadrant A |  |
 |
Quadrant B |
|---|---|---|---|
| Quadrant D | 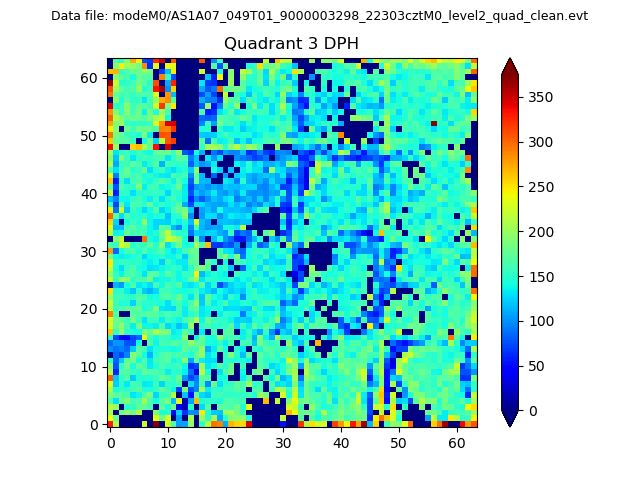 |
 |
Quadrant C |
| Plot type | Count rate plots | Images |
|---|---|---|
| Comparison with Poisson distribution Blue bars denote a histogram of data divided into 1 sec bins. Red curve is a Poisson curve with rate = median count rate of data. |
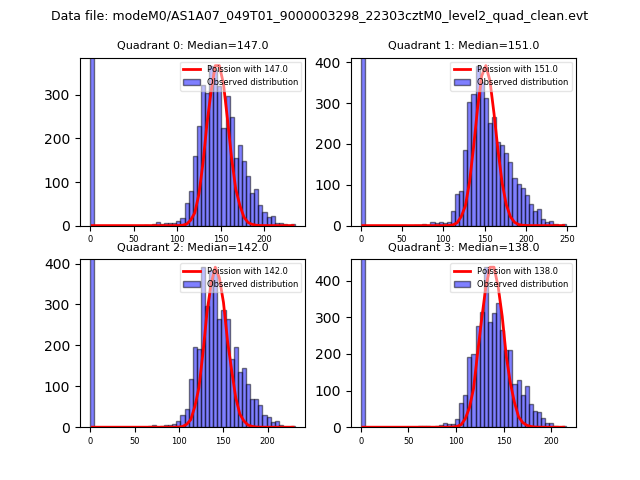 |
 |
| Quadrant-wise count rates Data is divided into 100 sec bins |
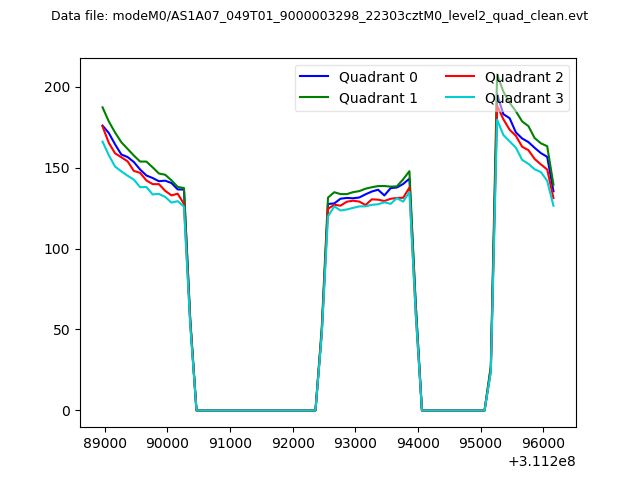 |
|
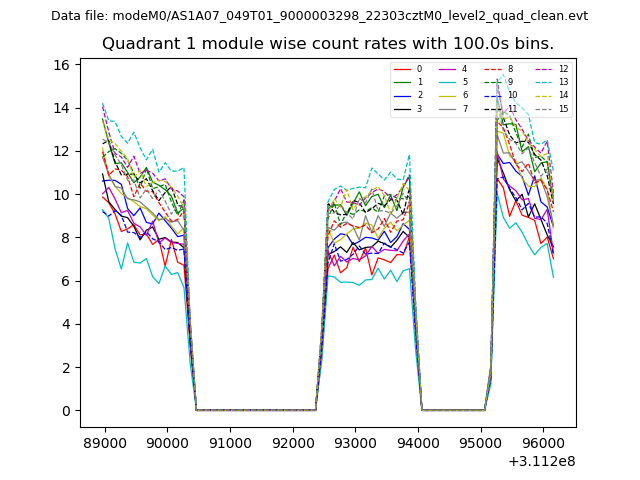
| Module-wise count rates for Quadrant A Data is divided into 100 sec bins |
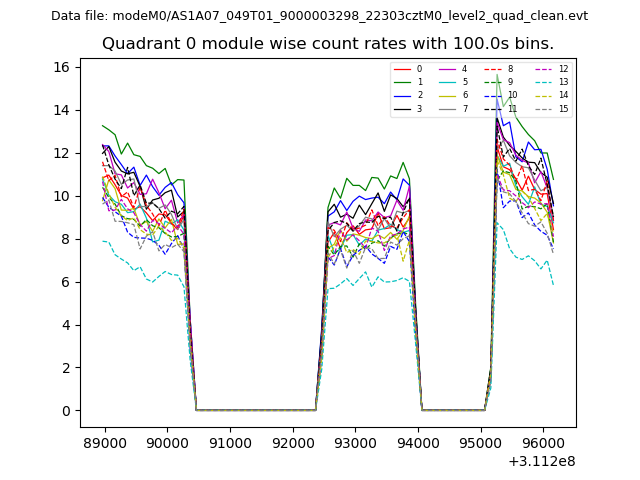 |
 |
| Module-wise count rates for Quadrant B Data is divided into 100 sec bins |
 |
 |
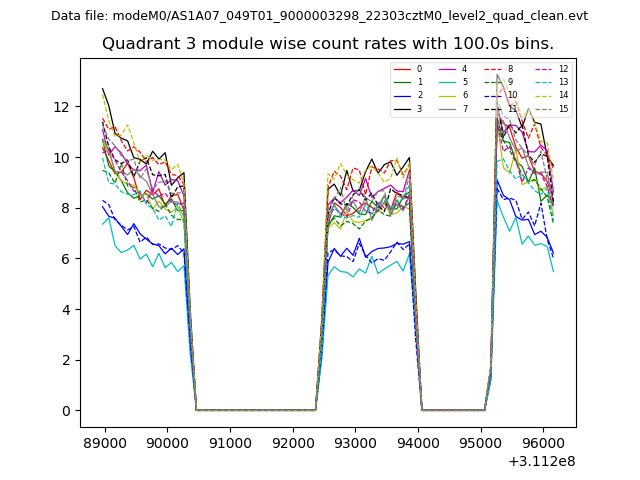
| Module-wise count rates for Quadrant C Data is divided into 100 sec bins |
 |
 |
| Module-wise count rates for Quadrant D Data is divided into 100 sec bins |
 |
 |
| Parameter | Plot |
|---|---|
| CZT HV Monitor | 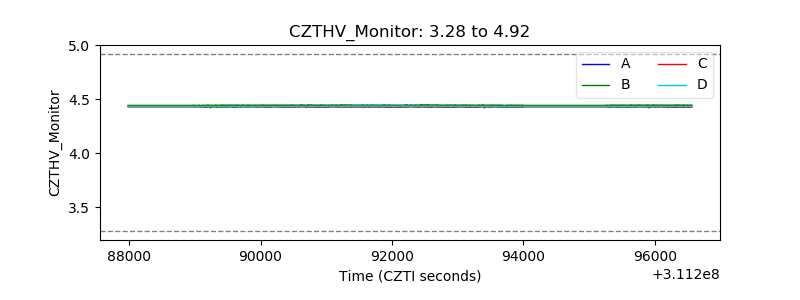 |
| D_VDD | 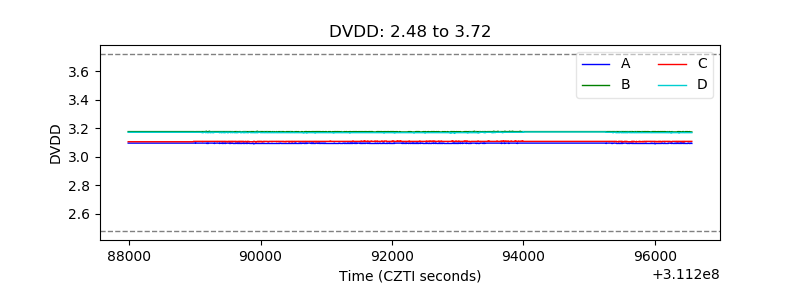 |
| Temperature 1 | 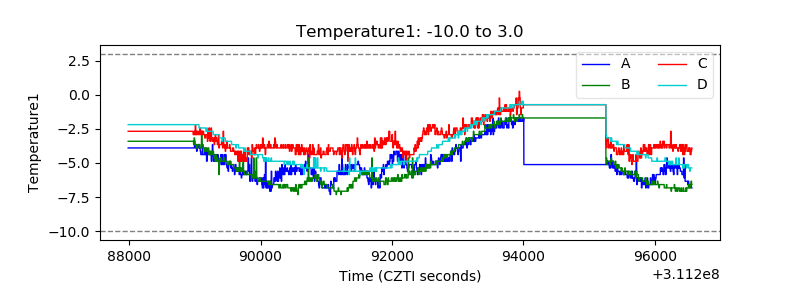 |
| Veto HV Monitor | 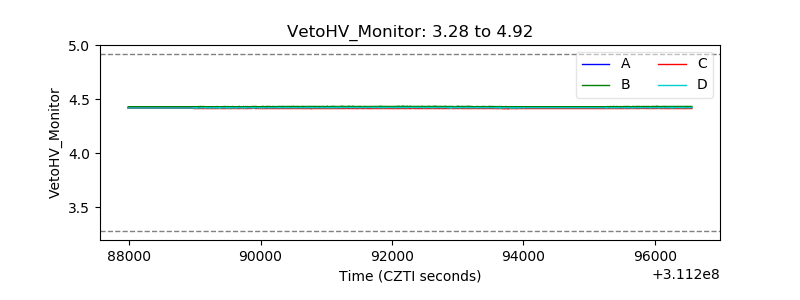 |
| Veto LLD | 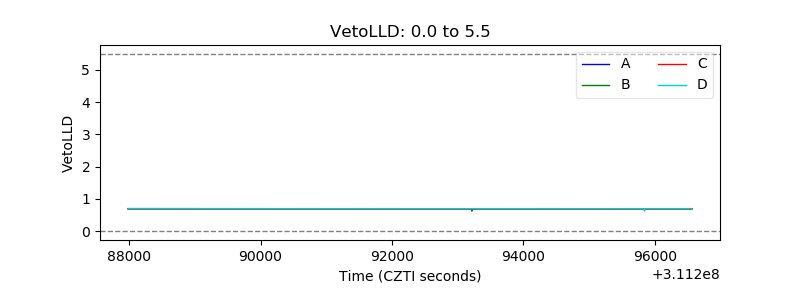 |
| Alpha Counter | 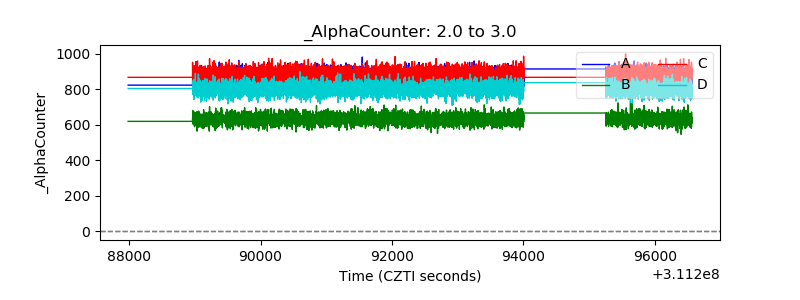 |
| _CPM_Rate | 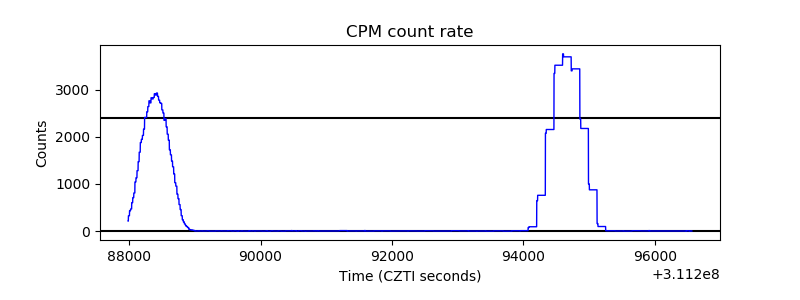 |
| CZT Counter | 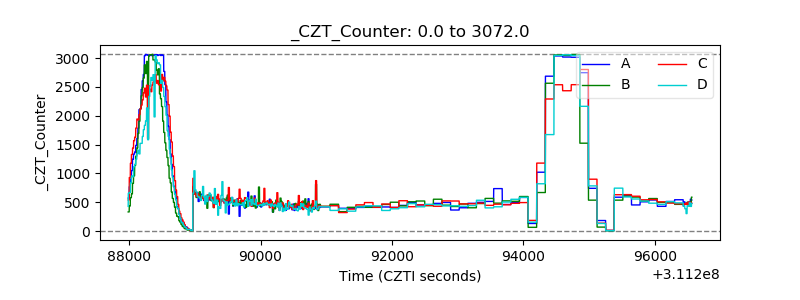 |
| +2.5 Volts monitor |  |
| +5 Volts monitor | 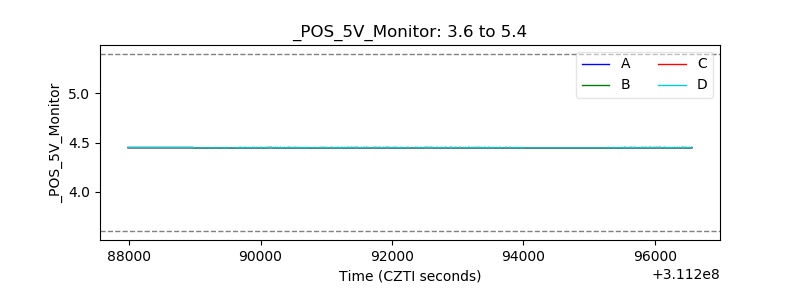 |
| _ROLL_ROT | 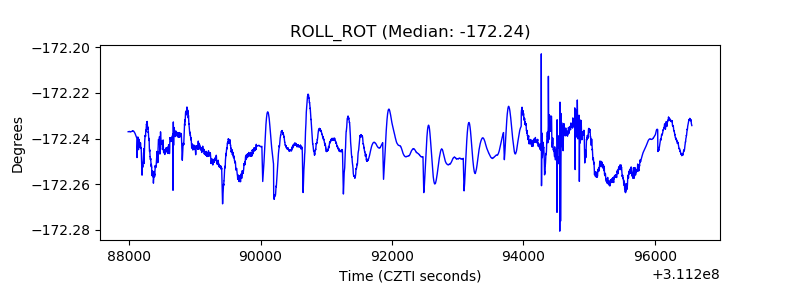 |
| _Roll_DEC | 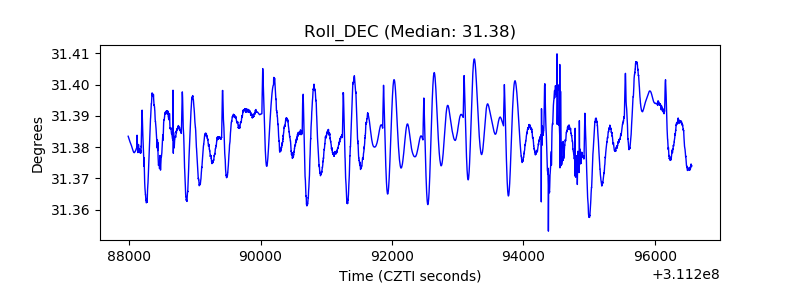 |
| _Roll_RA |  |
| Veto Counter | 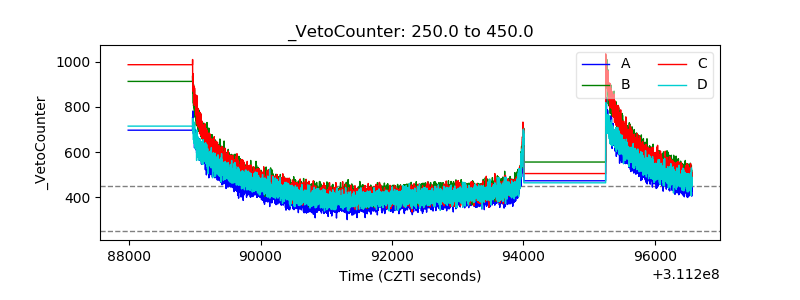 |