| Param | Original file | Final file |
|---|---|---|
| Filename | modeM0/AS1A07_049T01_9000003298_22304cztM0_level2.evt | modeM0/AS1A07_049T01_9000003298_22304cztM0_level2_quad_clean.evt |
| Size (bytes) | 451,895,040 | 84,144,960 |
| Size | 431.0 MB | 80.2 MB |
| Events in quadrant A | 3,289,259 | 532,887 |
| Events in quadrant B | 3,386,005 | 555,413 |
| Events in quadrant C | 3,355,792 | 514,112 |
| Events in quadrant D | 3,214,390 | 493,699 |
| Mode SS | |||
|---|---|---|---|
| Quadrant | BADHDUFLAG | Total packets | Discarded packets |
| A | 0 | 130 | 0 |
| B | 0 | 130 | 0 |
| C | 0 | 130 | 0 |
| D | 0 | 130 | 0 |
| Mode M9 | |||
|---|---|---|---|
| Quadrant | BADHDUFLAG | Total packets | Discarded packets |
| A | 0 | 19 | 0 |
| B | 0 | 20 | 0 |
| C | 0 | 20 | 0 |
| D | 0 | 20 | 0 |
| Mode M0 | |||
|---|---|---|---|
| Quadrant | BADHDUFLAG | Total packets | Discarded packets |
| A | 0 | 13686 | 2 |
| B | 0 | 13974 | 2 |
| C | 0 | 13913 | 2 |
| D | 0 | 13739 | 2 |
| Quadrant | Total seconds | Saturated seconds | Saturation percentage |
|---|---|---|---|
| A | 6486 | 17 | 0.262103% |
| B | 6486 | 24 | 0.370028% |
| C | 6486 | 58 | 0.894234% |
| D | 6486 | 19 | 0.292939% |
Noise dominated data is calculated using 1-second bins in cleaned event files. If a bin has >2000 counts, and if more than 50% of those come from <1% of pixels, then it is considered to be noise-dominated and hence unusable.
| Quadrant | # 1 sec bins | Bins with >0 counts | Bins with >2000 counts | High rate bins dominated by noise | Noise dominated (total time) | Noise dominated (detector-on time) | Marked lightcurve |
|---|---|---|---|---|---|---|---|
| A | 7826 | 6487 | 0 | 0 | 0.00% | 0.00% | 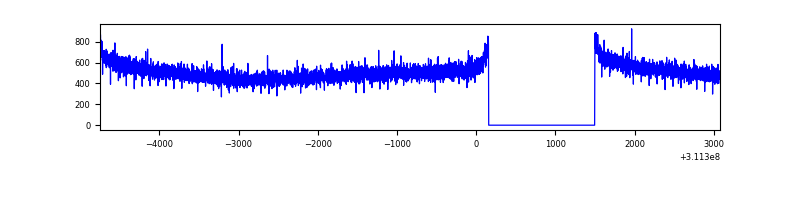 |
| B | 7826 | 6487 | 0 | 0 | 0.00% | 0.00% | 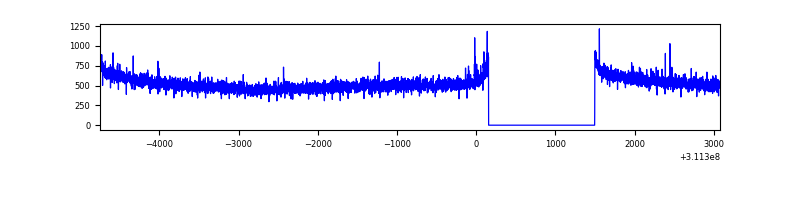 |
| C | 7826 | 6487 | 0 | 0 | 0.00% | 0.00% | 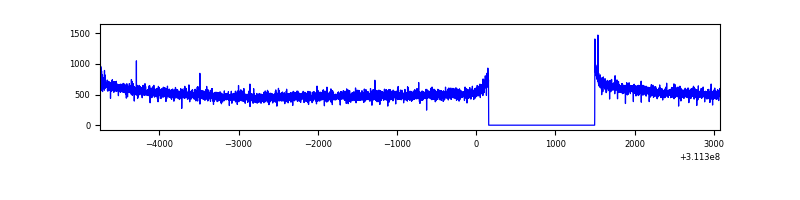 |
| D | 7826 | 6487 | 6 | 6 | 0.08% | 0.09% | 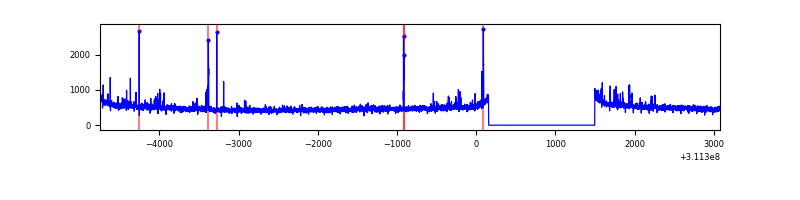 |
Top three noisy pixels from each quadrant. If the there are fewer than three noisy pixels in the level2.evt file, extra rows are filled as -1
| Pixel properties | Quadrant properties | ||||||
|---|---|---|---|---|---|---|---|
| Quadrant | DetID | PixID | Counts | Sigma | Mean | Median | Sigma |
| A | 13 | 254 | 7883 | 41.64 | 853 | 839 | 169.1 |
| A | 0 | 226 | 7303 | 38.22 | 853 | 839 | 169.1 |
| A | 3 | 137 | 6974 | 36.27 | 853 | 839 | 169.1 |
| B | 12 | 111 | 18937 | 113.35 | 862 | 845 | 159.6 |
| B | 11 | 111 | 16715 | 99.43 | 862 | 845 | 159.6 |
| B | 14 | 111 | 15090 | 89.25 | 862 | 845 | 159.6 |
| C | 14 | 238 | 133499 | 702.73 | 823 | 830 | 188.8 |
| C | 0 | 10 | 8339 | 39.77 | 823 | 830 | 188.8 |
| C | 13 | 61 | 5694 | 25.76 | 823 | 830 | 188.8 |
| D | 2 | 136 | 58574 | 290.54 | 822 | 800 | 198.8 |
| D | 1 | 52 | 28268 | 138.13 | 822 | 800 | 198.8 |
| D | 2 | 234 | 22663 | 109.95 | 822 | 800 | 198.8 |
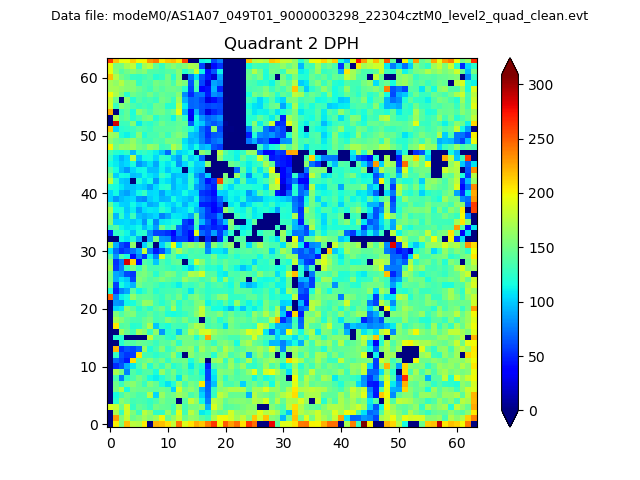
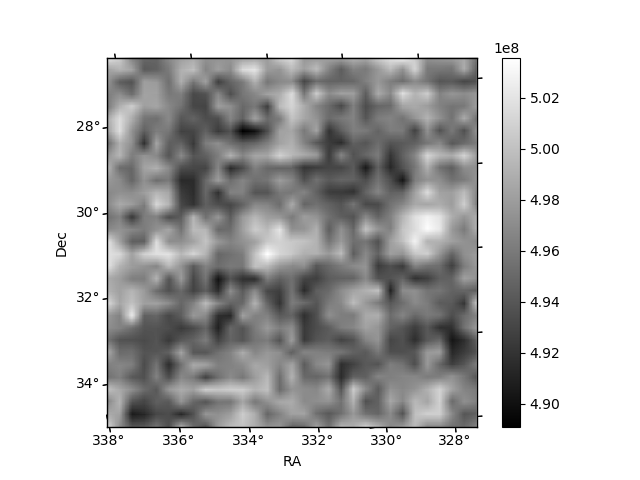
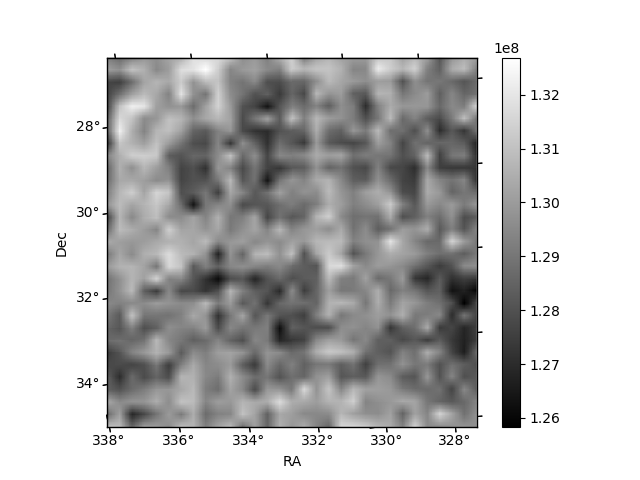
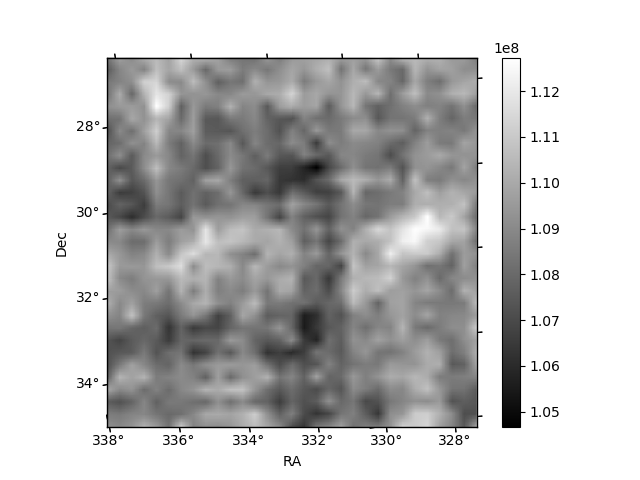
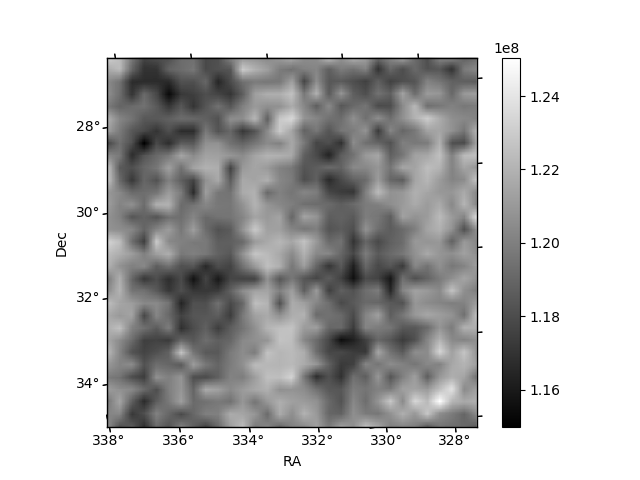
Histogram calculated using DETX and DETY for each event in the final _common_clean file
| Quadrant A | 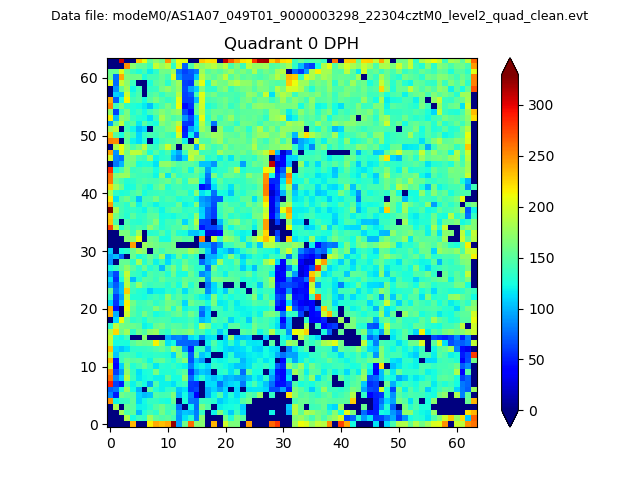 |
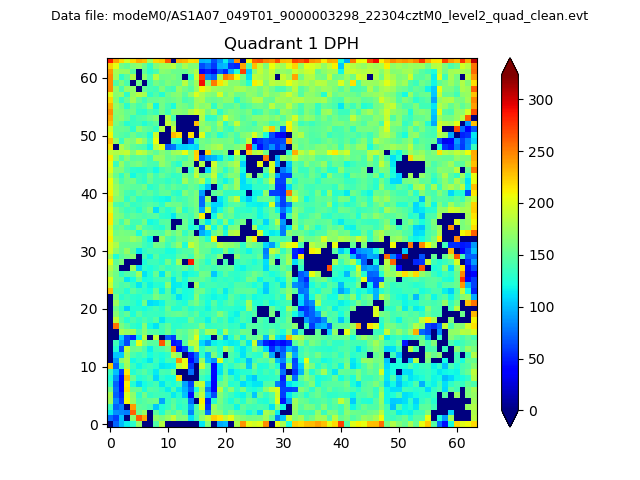 |
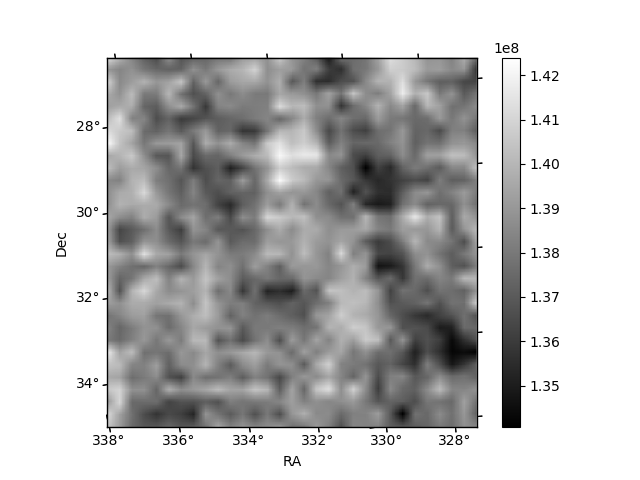
Quadrant B |
|---|---|---|---|
| Quadrant D | 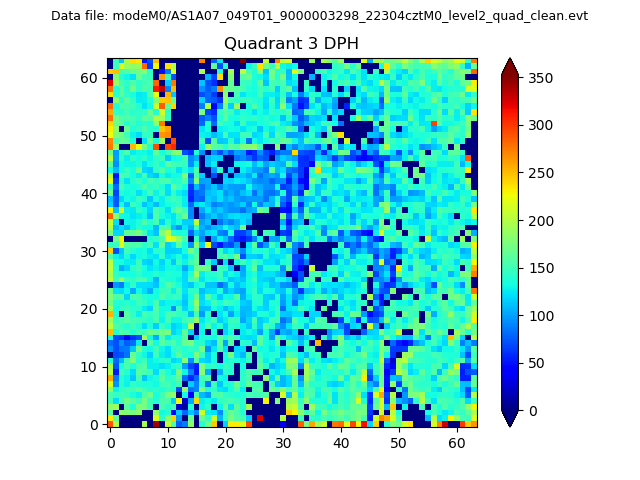 |
 |
Quadrant C |
| Plot type | Count rate plots | Images |
|---|---|---|
| Comparison with Poisson distribution Blue bars denote a histogram of data divided into 1 sec bins. Red curve is a Poisson curve with rate = median count rate of data. |
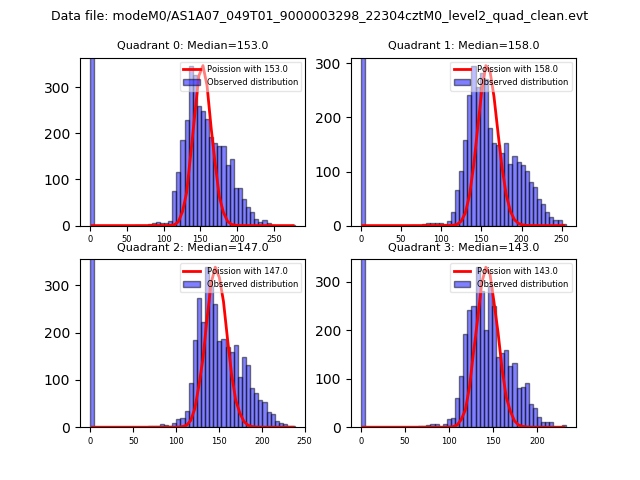 |
 |
| Quadrant-wise count rates Data is divided into 100 sec bins |
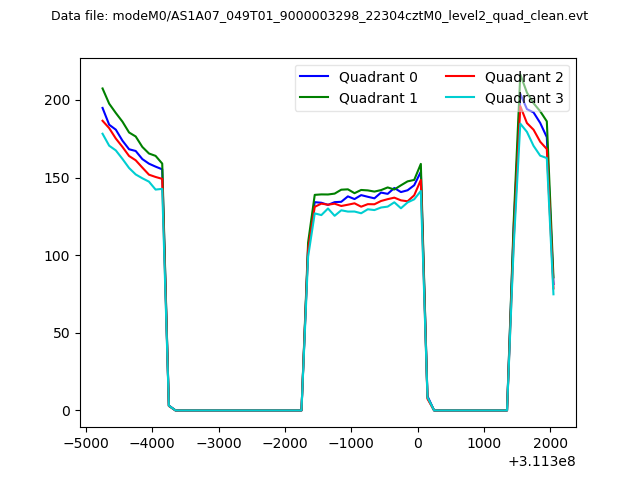 |
|
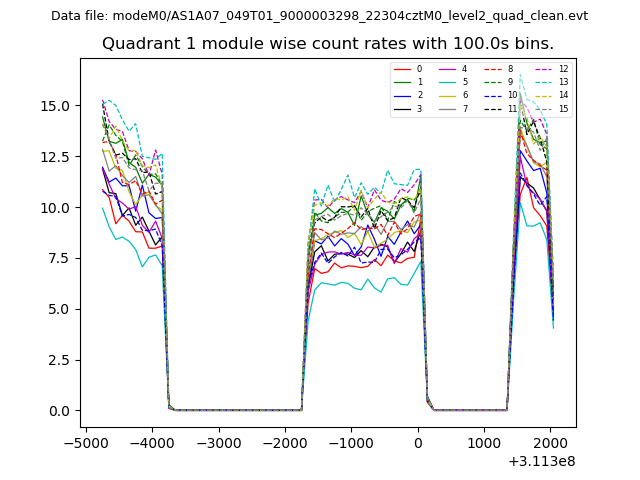
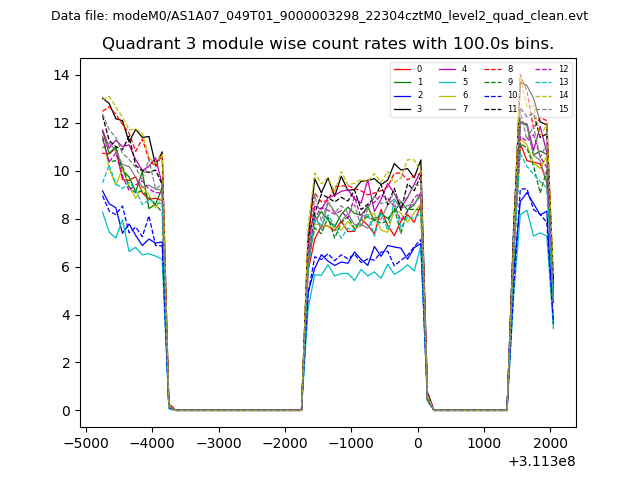
| Module-wise count rates for Quadrant A Data is divided into 100 sec bins |
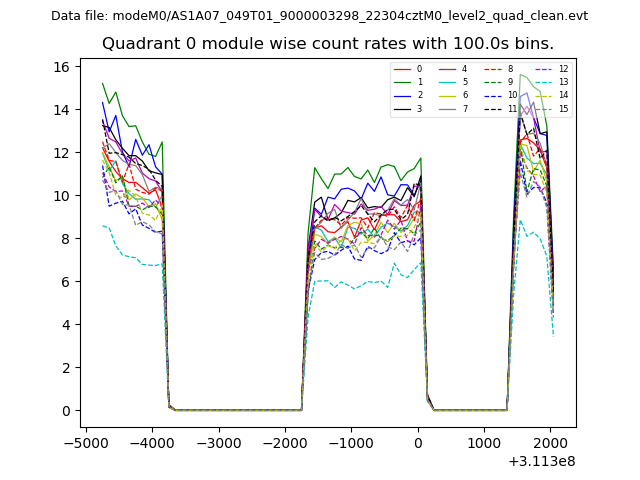 |
 |
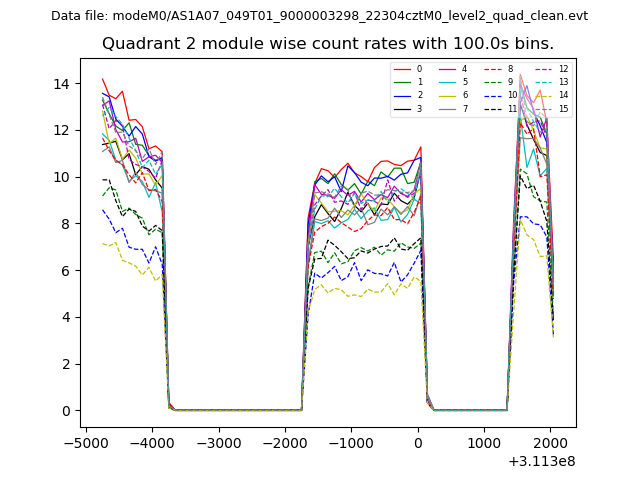
| Module-wise count rates for Quadrant B Data is divided into 100 sec bins |
 |
 |
| Module-wise count rates for Quadrant C Data is divided into 100 sec bins |
 |
 |
| Module-wise count rates for Quadrant D Data is divided into 100 sec bins |
 |
 |
| Parameter | Plot |
|---|---|
| CZT HV Monitor | 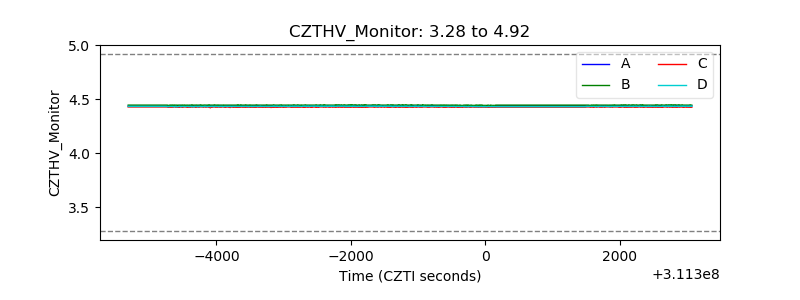 |
| D_VDD | 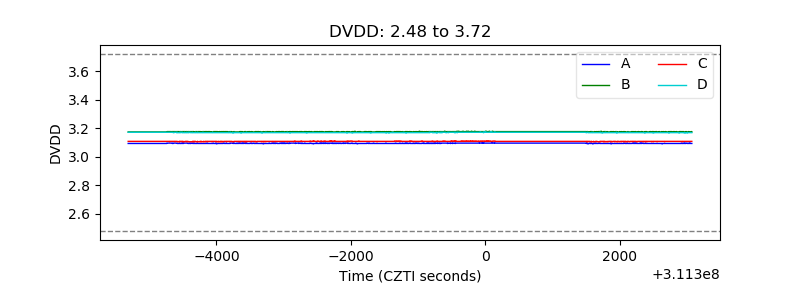 |
| Temperature 1 | 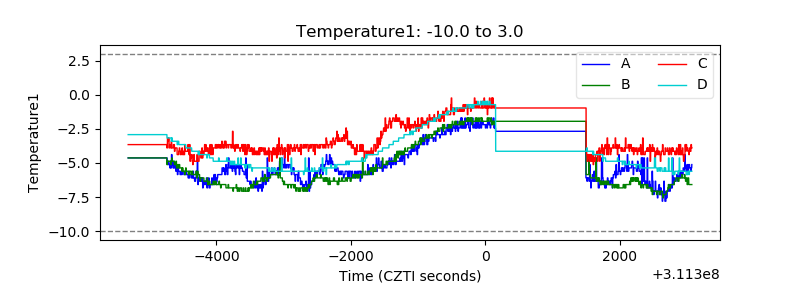 |
| Veto HV Monitor | 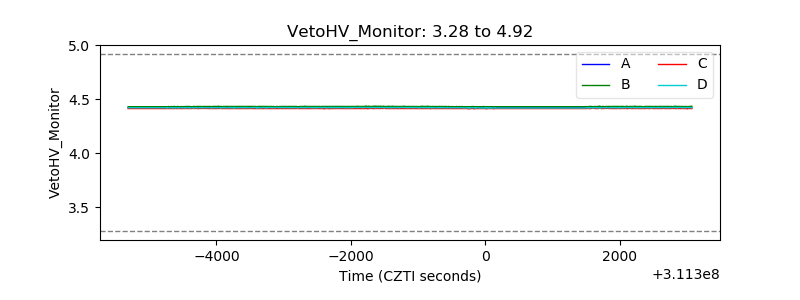 |
| Veto LLD | 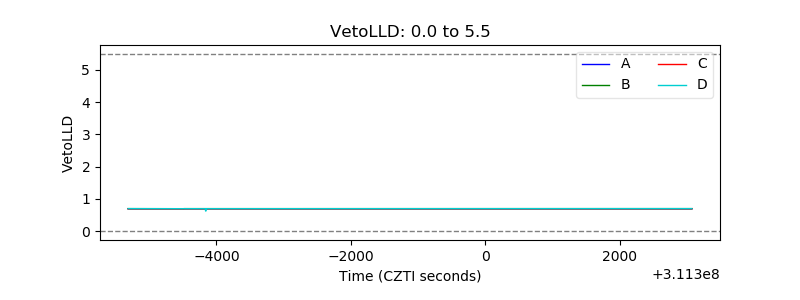 |
| Alpha Counter | 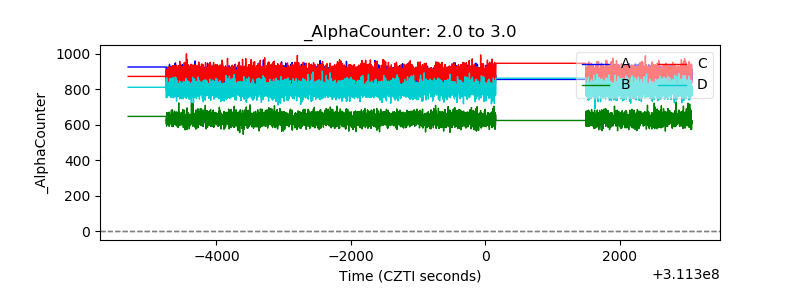 |
| _CPM_Rate | 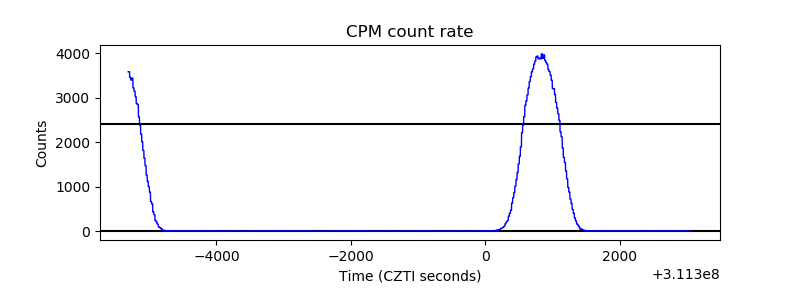 |
| CZT Counter | 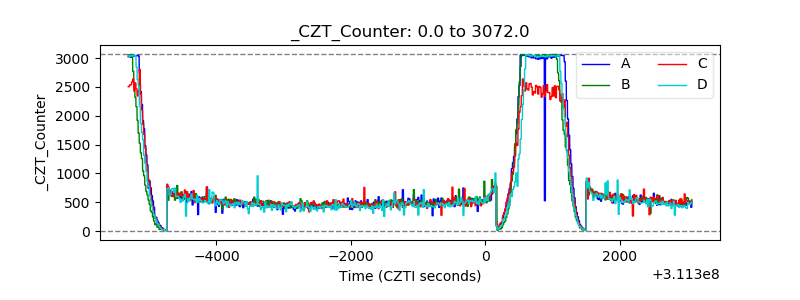 |
| +2.5 Volts monitor |  |
| +5 Volts monitor | 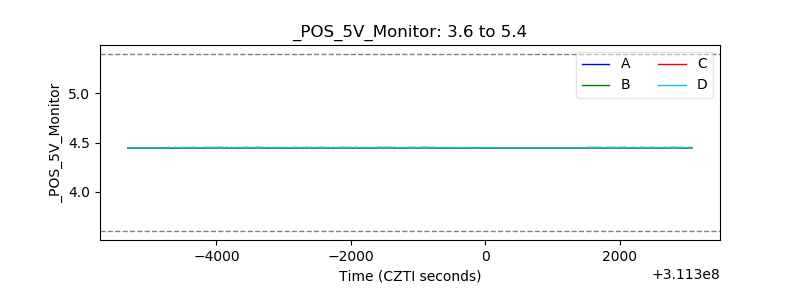 |
| _ROLL_ROT | 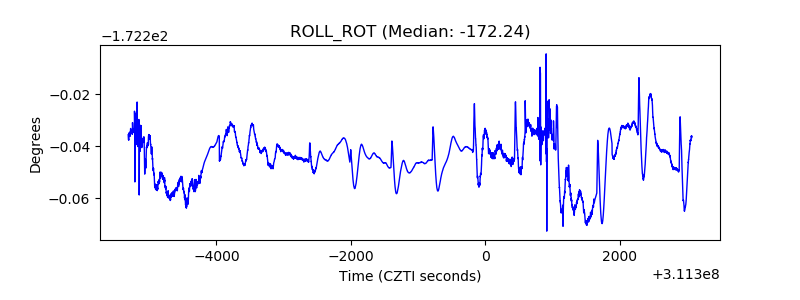 |
| _Roll_DEC | 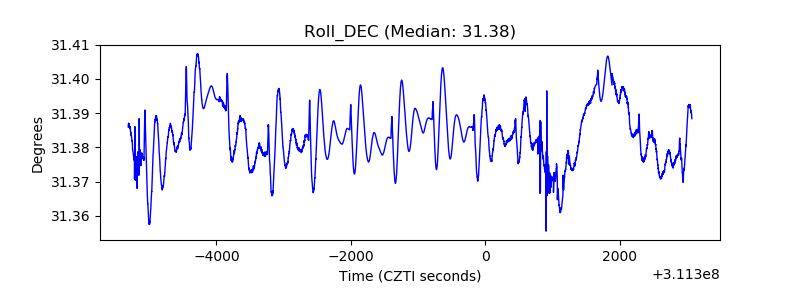 |
| _Roll_RA | 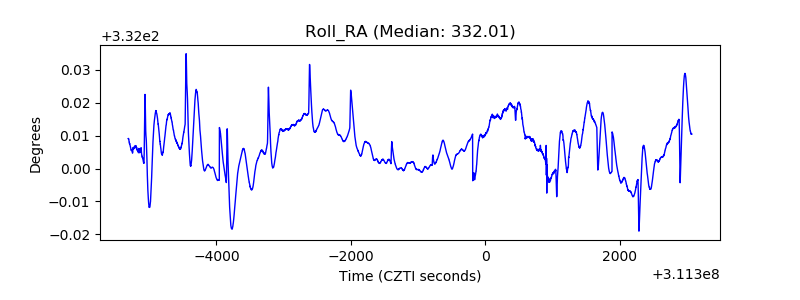 |
| Veto Counter | 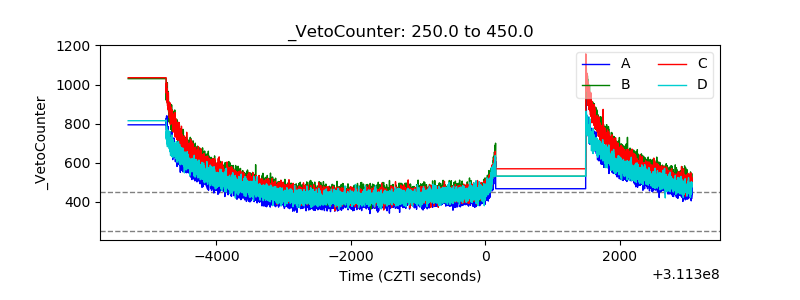 |