| Param | Original file | Final file |
|---|---|---|
| Filename | modeM0/AS1A07_049T01_9000003298_22305cztM0_level2.evt | modeM0/AS1A07_049T01_9000003298_22305cztM0_level2_quad_clean.evt |
| Size (bytes) | 476,349,120 | 72,308,160 |
| Size | 454.3 MB | 69.0 MB |
| Events in quadrant A | 3,294,040 | 450,318 |
| Events in quadrant B | 3,405,279 | 468,743 |
| Events in quadrant C | 3,323,098 | 431,049 |
| Events in quadrant D | 3,974,636 | 397,989 |
| Mode SS | |||
|---|---|---|---|
| Quadrant | BADHDUFLAG | Total packets | Discarded packets |
| A | 0 | 128 | 0 |
| B | 0 | 128 | 0 |
| C | 0 | 128 | 0 |
| D | 0 | 128 | 0 |
| Mode M9 | |||
|---|---|---|---|
| Quadrant | BADHDUFLAG | Total packets | Discarded packets |
| A | 0 | 14 | 0 |
| B | 0 | 14 | 0 |
| C | 0 | 14 | 0 |
| D | 0 | 14 | 0 |
| Mode M0 | |||
|---|---|---|---|
| Quadrant | BADHDUFLAG | Total packets | Discarded packets |
| A | 0 | 13461 | 2 |
| B | 0 | 13878 | 2 |
| C | 0 | 13602 | 2 |
| D | 0 | 15810 | 2 |
| Quadrant | Total seconds | Saturated seconds | Saturation percentage |
|---|---|---|---|
| A | 6323 | 10 | 0.158153% |
| B | 6323 | 15 | 0.237229% |
| C | 6323 | 54 | 0.854025% |
| D | 6323 | 297 | 4.697137% |
Noise dominated data is calculated using 1-second bins in cleaned event files. If a bin has >2000 counts, and if more than 50% of those come from <1% of pixels, then it is considered to be noise-dominated and hence unusable.
| Quadrant | # 1 sec bins | Bins with >0 counts | Bins with >2000 counts | High rate bins dominated by noise | Noise dominated (total time) | Noise dominated (detector-on time) | Marked lightcurve |
|---|---|---|---|---|---|---|---|
| A | 7733 | 6324 | 0 | 0 | 0.00% | 0.00% | 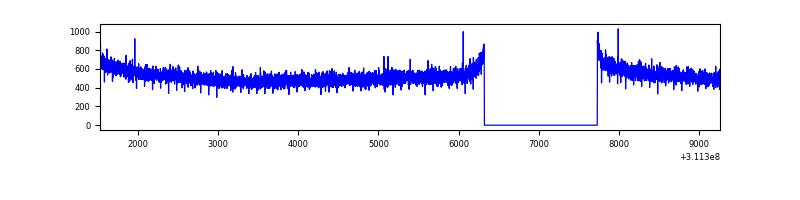 |
| B | 7733 | 6324 | 0 | 0 | 0.00% | 0.00% | 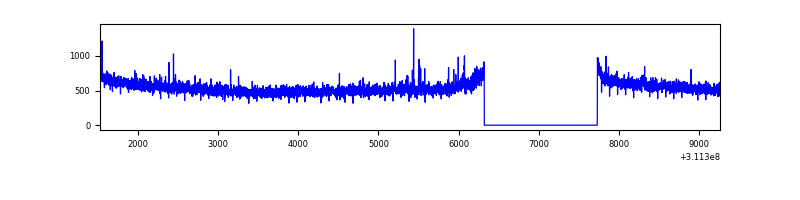 |
| C | 7733 | 6324 | 0 | 0 | 0.00% | 0.00% | 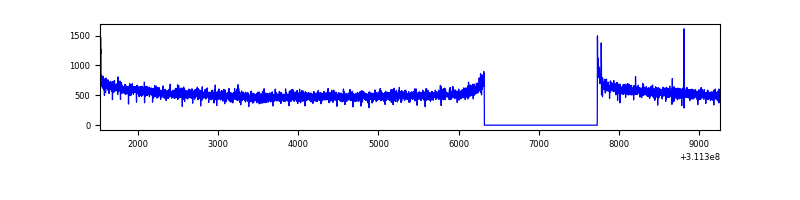 |
| D | 7733 | 6323 | 259 | 259 | 3.35% | 4.10% | 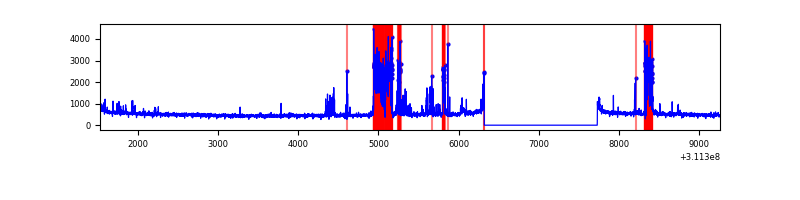 |
Top three noisy pixels from each quadrant. If the there are fewer than three noisy pixels in the level2.evt file, extra rows are filled as -1
| Pixel properties | Quadrant properties | ||||||
|---|---|---|---|---|---|---|---|
| Quadrant | DetID | PixID | Counts | Sigma | Mean | Median | Sigma |
| A | 13 | 254 | 7969 | 41.97 | 855 | 838 | 169.9 |
| A | 0 | 226 | 7276 | 37.89 | 855 | 838 | 169.9 |
| A | 3 | 137 | 6625 | 34.06 | 855 | 838 | 169.9 |
| B | 3 | 64 | 29862 | 183.54 | 861 | 843 | 158.1 |
| B | 12 | 111 | 18454 | 111.39 | 861 | 843 | 158.1 |
| B | 0 | 190 | 16776 | 100.78 | 861 | 843 | 158.1 |
| C | 14 | 238 | 131435 | 697.94 | 816 | 822 | 187.1 |
| C | 13 | 61 | 5561 | 25.32 | 816 | 822 | 187.1 |
| C | 0 | 10 | 5080 | 22.75 | 816 | 822 | 187.1 |
| D | 13 | 104 | 711423 | 3742.32 | 795 | 775 | 189.9 |
| D | 1 | 52 | 168618 | 883.87 | 795 | 775 | 189.9 |
| D | 13 | 172 | 68544 | 356.88 | 795 | 775 | 189.9 |
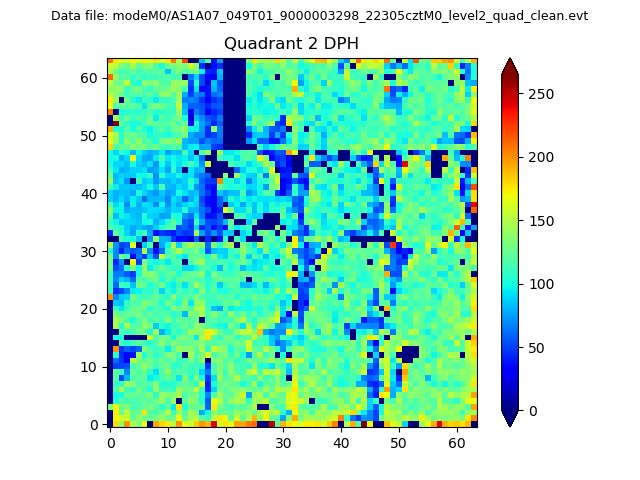
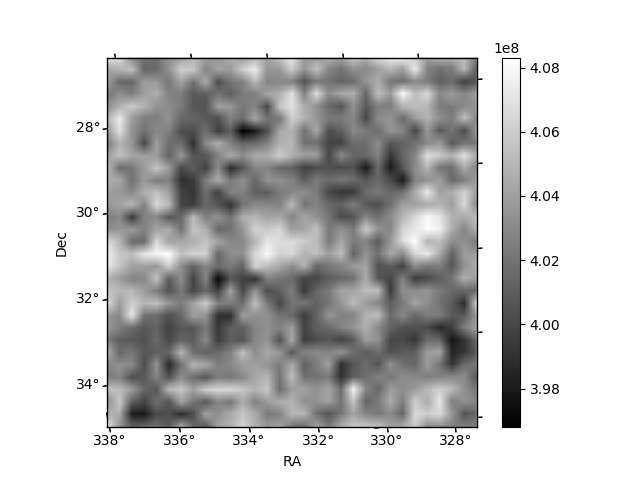
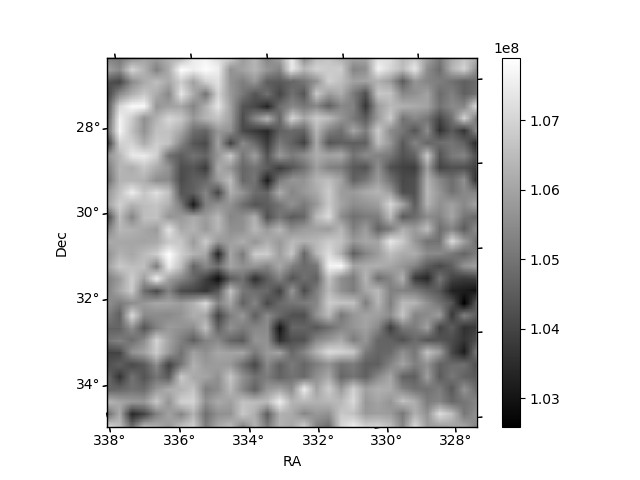
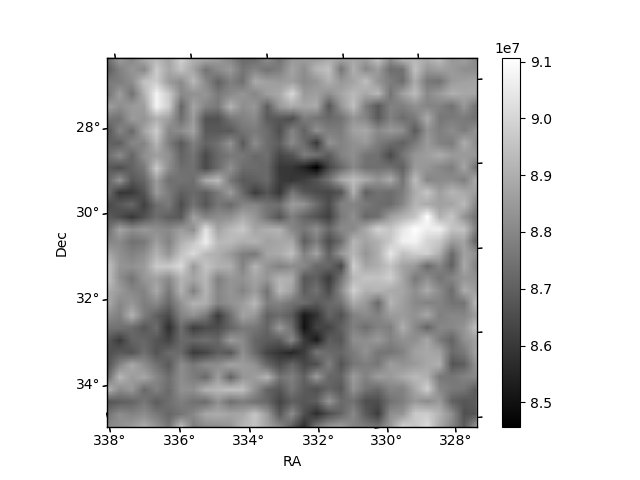
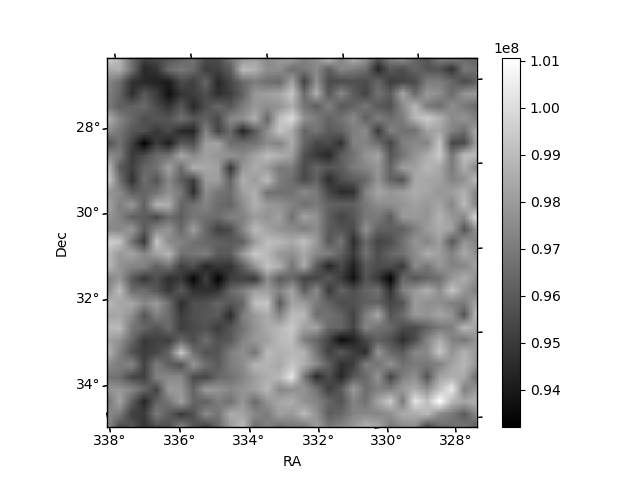
Histogram calculated using DETX and DETY for each event in the final _common_clean file
| Quadrant A | 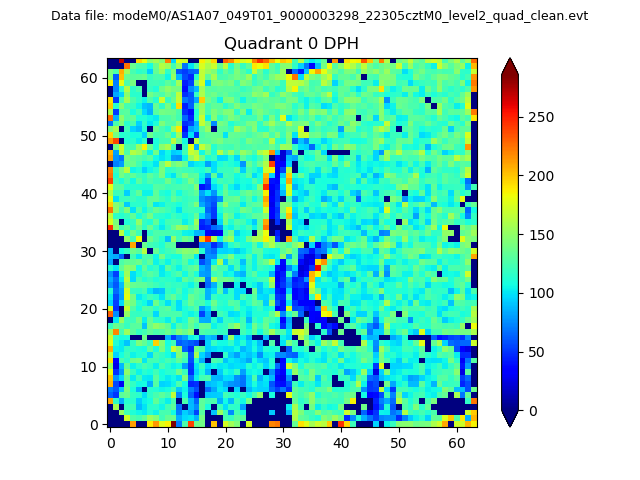 |
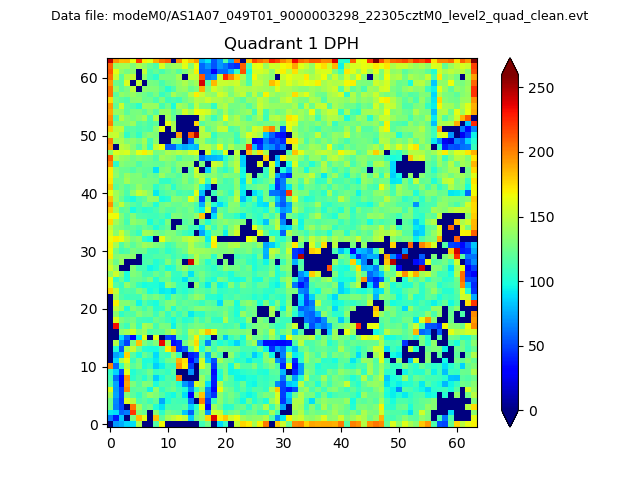 |
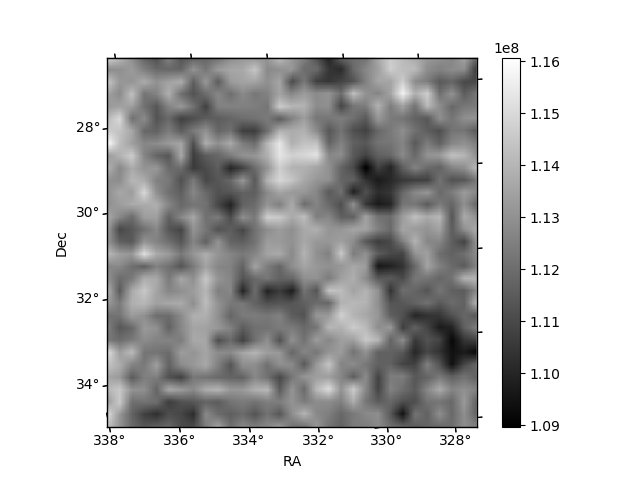
Quadrant B |
|---|---|---|---|
| Quadrant D | 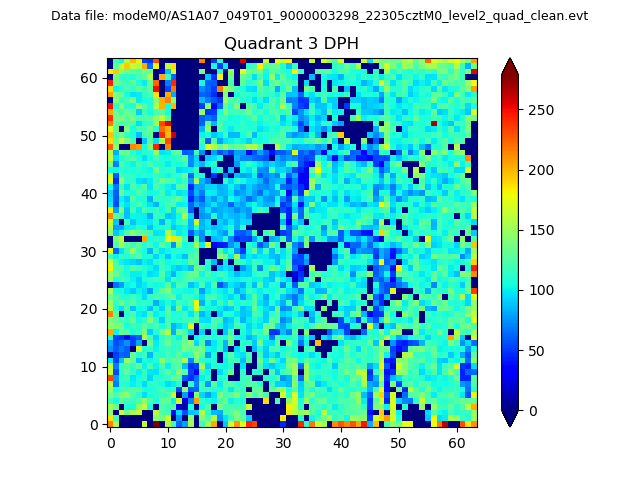 |
 |
Quadrant C |
| Plot type | Count rate plots | Images |
|---|---|---|
| Comparison with Poisson distribution Blue bars denote a histogram of data divided into 1 sec bins. Red curve is a Poisson curve with rate = median count rate of data. |
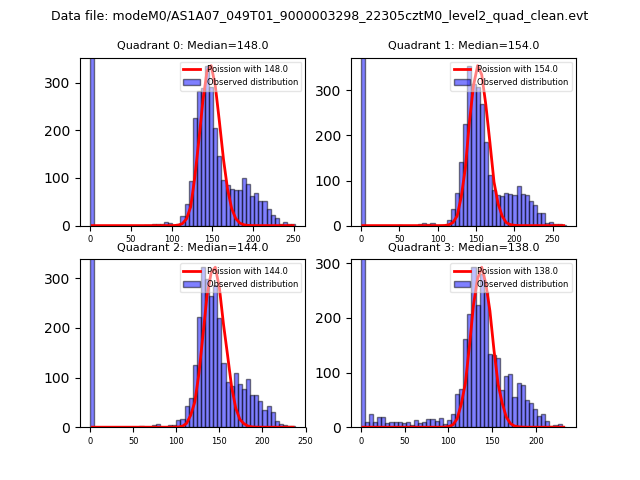 |
 |
| Quadrant-wise count rates Data is divided into 100 sec bins |
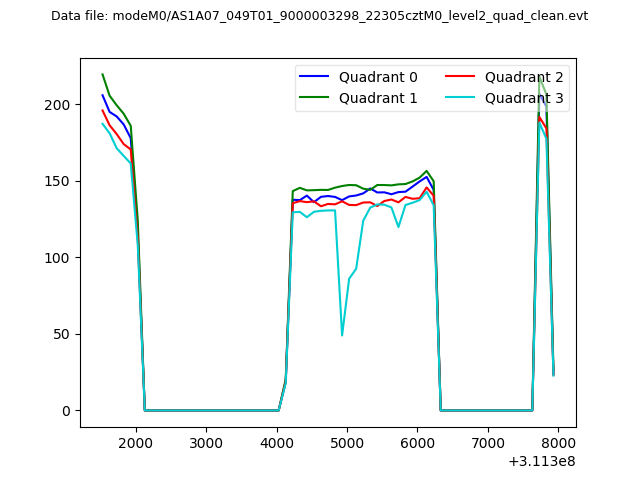 |
|
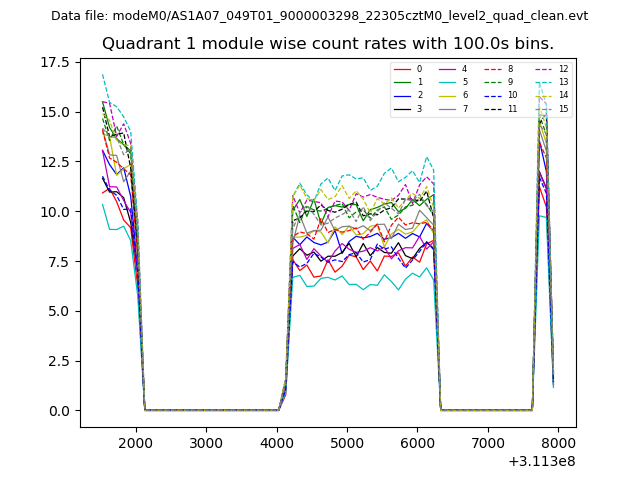
| Module-wise count rates for Quadrant A Data is divided into 100 sec bins |
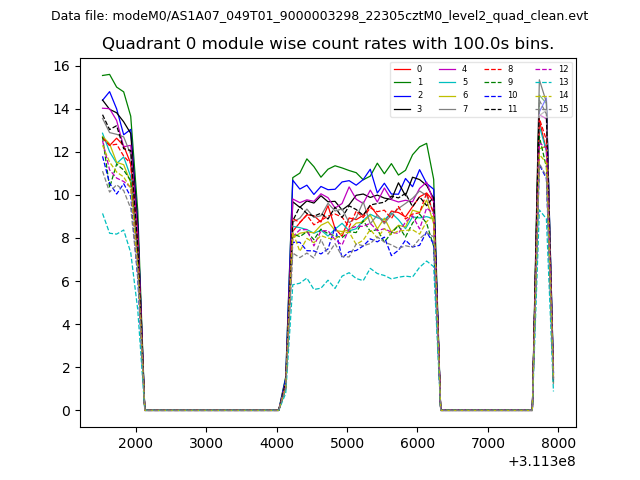 |
 |
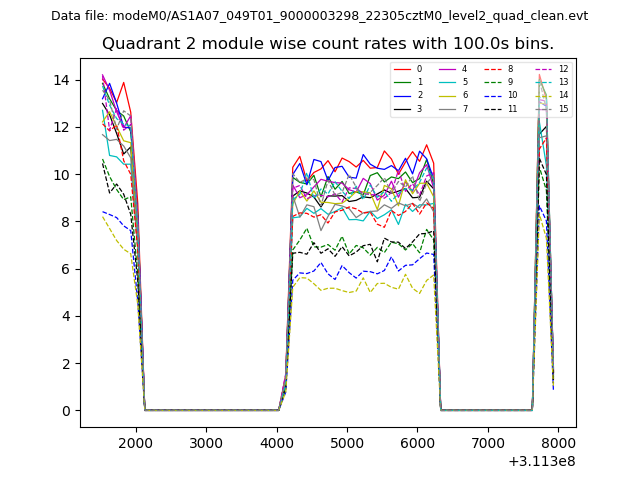
| Module-wise count rates for Quadrant B Data is divided into 100 sec bins |
 |
 |
| Module-wise count rates for Quadrant C Data is divided into 100 sec bins |
 |
 |
| Module-wise count rates for Quadrant D Data is divided into 100 sec bins |
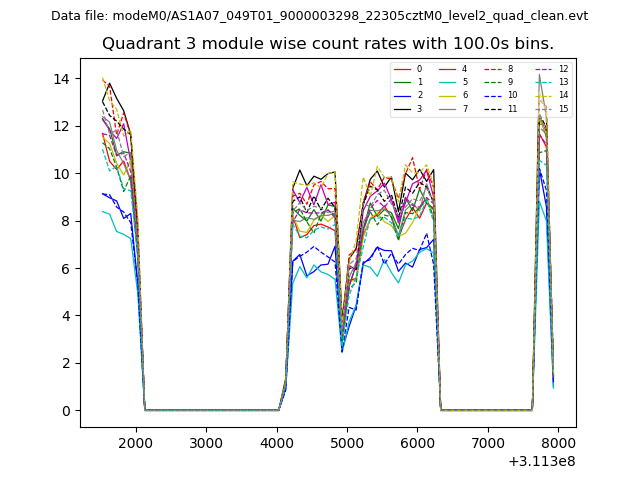 |
 |
| Parameter | Plot |
|---|---|
| CZT HV Monitor | 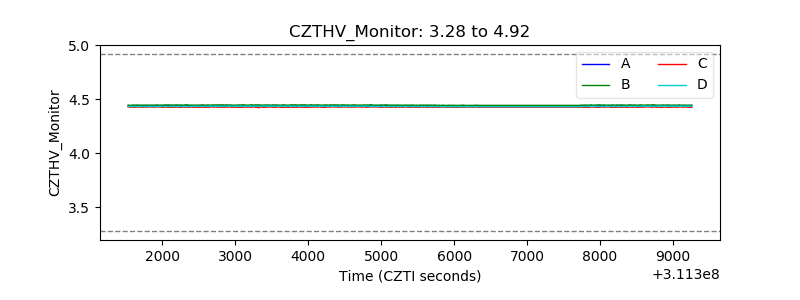 |
| D_VDD | 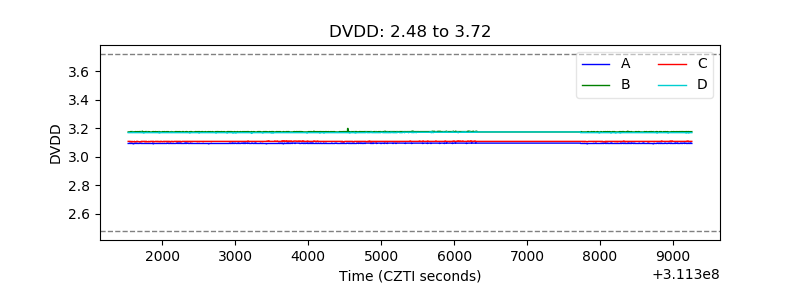 |
| Temperature 1 | 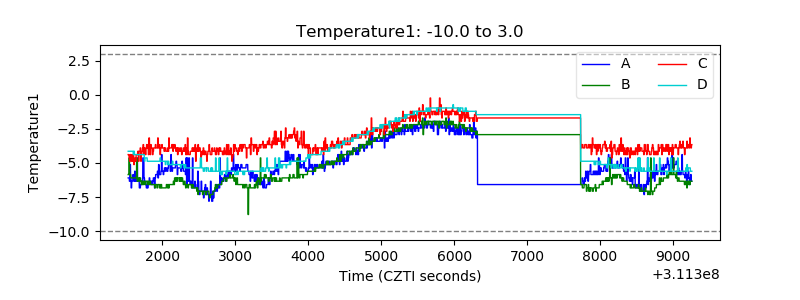 |
| Veto HV Monitor | 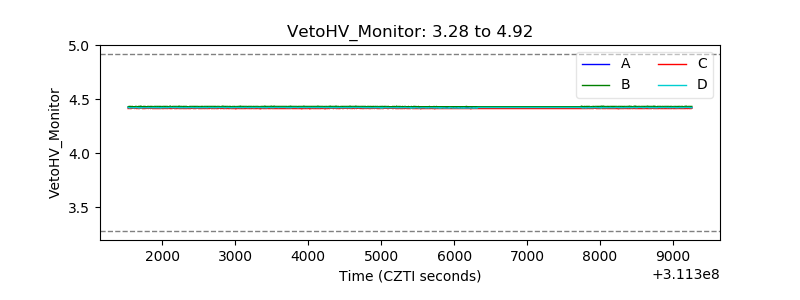 |
| Veto LLD | 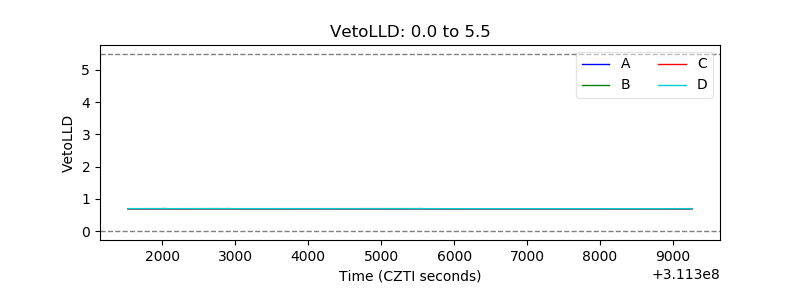 |
| Alpha Counter | 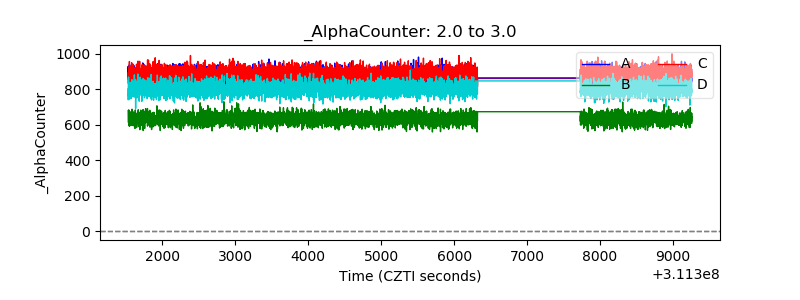 |
| _CPM_Rate | 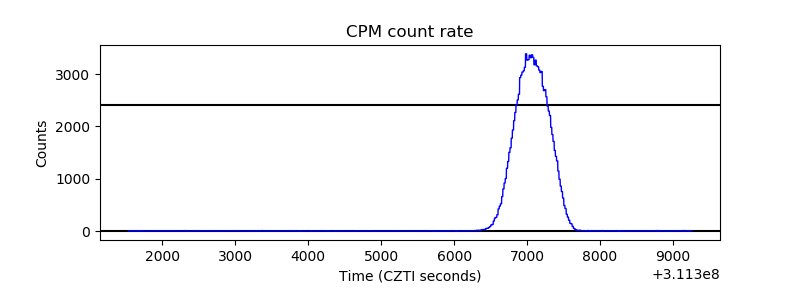 |
| CZT Counter | 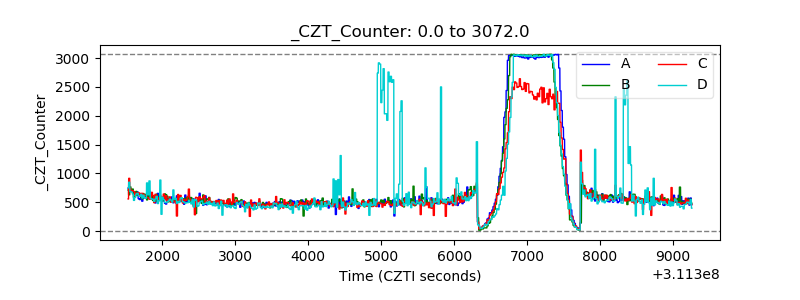 |
| +2.5 Volts monitor |  |
| +5 Volts monitor | 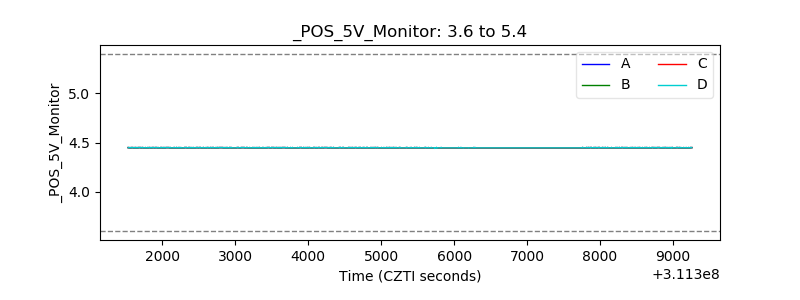 |
| _ROLL_ROT | 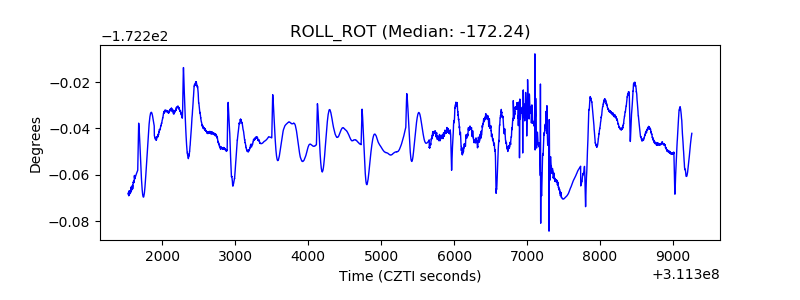 |
| _Roll_DEC | 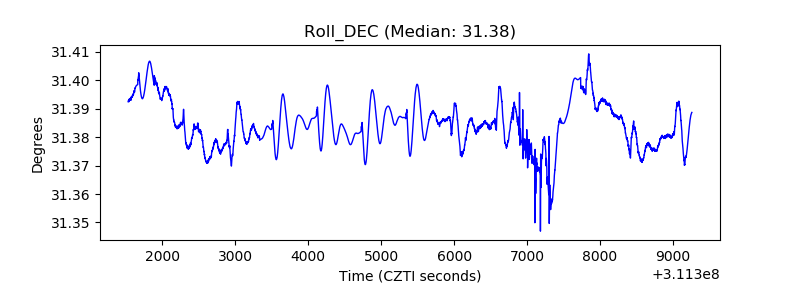 |
| _Roll_RA | 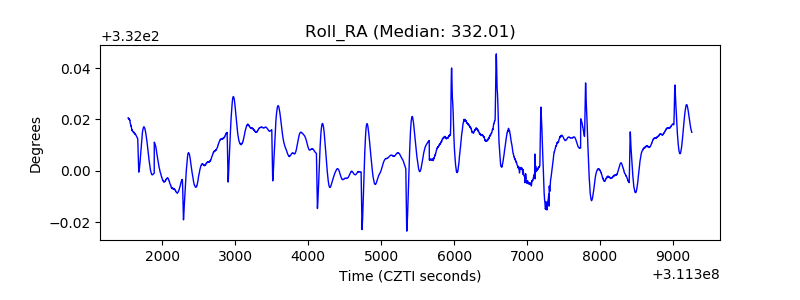 |
| Veto Counter | 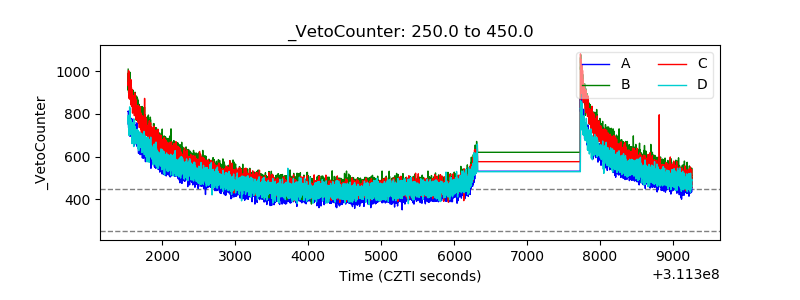 |