| Param | Original file | Final file |
|---|---|---|
| Filename | modeM0/AS1A07_049T01_9000003298_22307cztM0_level2.evt | modeM0/AS1A07_049T01_9000003298_22307cztM0_level2_quad_clean.evt |
| Size (bytes) | 465,969,600 | 72,204,480 |
| Size | 444.4 MB | 68.9 MB |
| Events in quadrant A | 3,378,161 | 441,392 |
| Events in quadrant B | 3,456,085 | 451,023 |
| Events in quadrant C | 3,374,740 | 422,465 |
| Events in quadrant D | 3,455,879 | 412,691 |
| Mode SS | |||
|---|---|---|---|
| Quadrant | BADHDUFLAG | Total packets | Discarded packets |
| A | 0 | 134 | 0 |
| B | 0 | 134 | 0 |
| C | 0 | 134 | 0 |
| D | 0 | 134 | 0 |
| Mode M9 | |||
|---|---|---|---|
| Quadrant | BADHDUFLAG | Total packets | Discarded packets |
| A | 0 | 12 | 0 |
| B | 0 | 13 | 0 |
| C | 0 | 13 | 0 |
| D | 0 | 13 | 0 |
| Mode M0 | |||
|---|---|---|---|
| Quadrant | BADHDUFLAG | Total packets | Discarded packets |
| A | 0 | 13890 | 3 |
| B | 0 | 14031 | 2 |
| C | 0 | 13951 | 2 |
| D | 0 | 14473 | 2 |
| Quadrant | Total seconds | Saturated seconds | Saturation percentage |
|---|---|---|---|
| A | 6577 | 124 | 1.885358% |
| B | 6577 | 161 | 2.447925% |
| C | 6577 | 151 | 2.295880% |
| D | 6577 | 88 | 1.337996% |
Noise dominated data is calculated using 1-second bins in cleaned event files. If a bin has >2000 counts, and if more than 50% of those come from <1% of pixels, then it is considered to be noise-dominated and hence unusable.
| Quadrant | # 1 sec bins | Bins with >0 counts | Bins with >2000 counts | High rate bins dominated by noise | Noise dominated (total time) | Noise dominated (detector-on time) | Marked lightcurve |
|---|---|---|---|---|---|---|---|
| A | 7712 | 6578 | 0 | 0 | 0.00% | 0.00% | 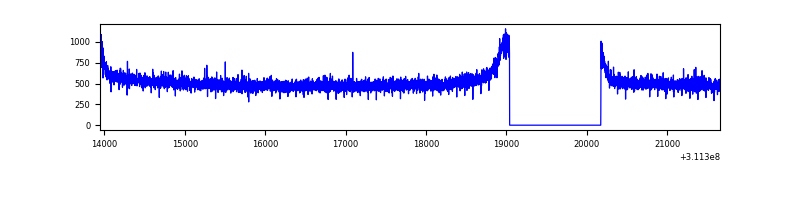 |
| B | 7712 | 6578 | 1 | 1 | 0.01% | 0.02% | 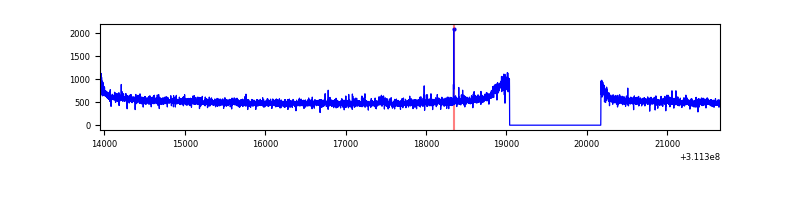 |
| C | 7712 | 6578 | 0 | 0 | 0.00% | 0.00% | 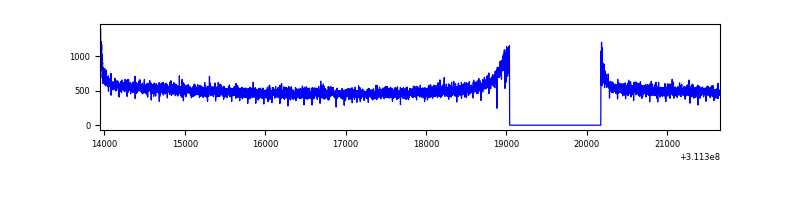 |
| D | 7712 | 6578 | 19 | 19 | 0.25% | 0.29% | 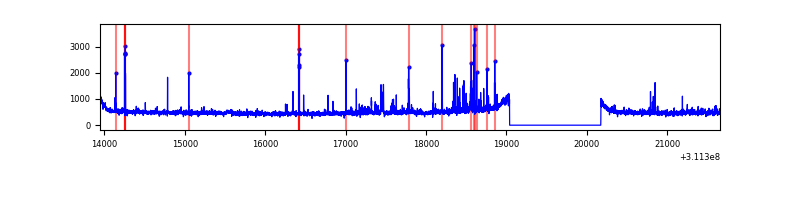 |
Top three noisy pixels from each quadrant. If the there are fewer than three noisy pixels in the level2.evt file, extra rows are filled as -1
| Pixel properties | Quadrant properties | ||||||
|---|---|---|---|---|---|---|---|
| Quadrant | DetID | PixID | Counts | Sigma | Mean | Median | Sigma |
| A | 13 | 254 | 8949 | 46.24 | 876 | 858 | 175.0 |
| A | 0 | 226 | 7552 | 38.26 | 876 | 858 | 175.0 |
| A | 3 | 137 | 7283 | 36.72 | 876 | 858 | 175.0 |
| B | 0 | 245 | 20223 | 117.25 | 875 | 856 | 165.2 |
| B | 12 | 111 | 19869 | 115.11 | 875 | 856 | 165.2 |
| B | 11 | 111 | 17562 | 101.14 | 875 | 856 | 165.2 |
| C | 14 | 238 | 132648 | 684.75 | 828 | 835 | 192.5 |
| C | 0 | 10 | 12175 | 58.91 | 828 | 835 | 192.5 |
| C | 13 | 61 | 5833 | 25.96 | 828 | 835 | 192.5 |
| D | 2 | 136 | 88644 | 429.76 | 839 | 813 | 204.4 |
| D | 10 | 103 | 65025 | 314.2 | 839 | 813 | 204.4 |
| D | 1 | 52 | 56098 | 270.51 | 839 | 813 | 204.4 |
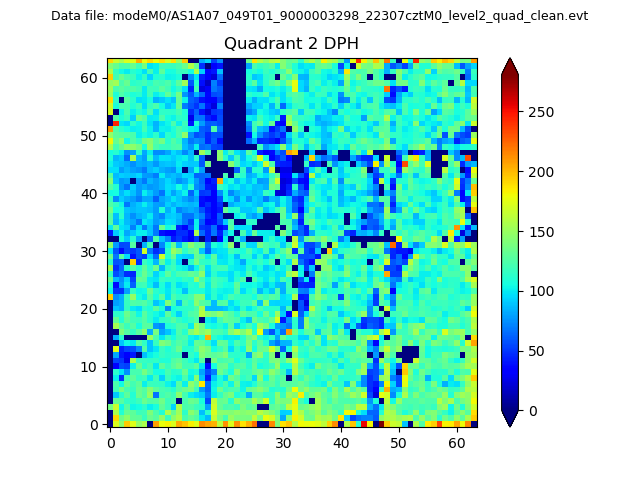
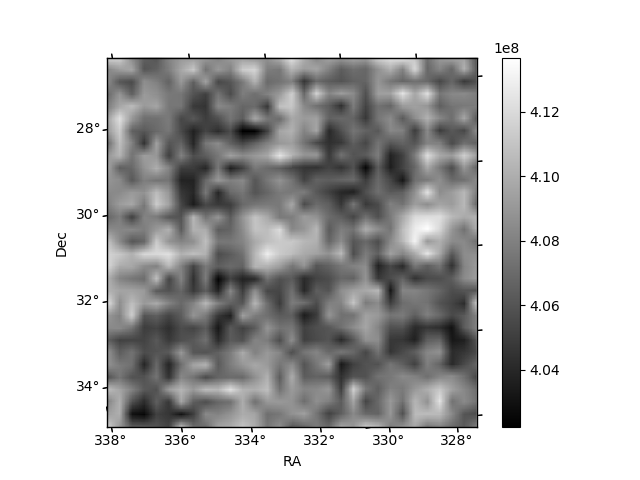
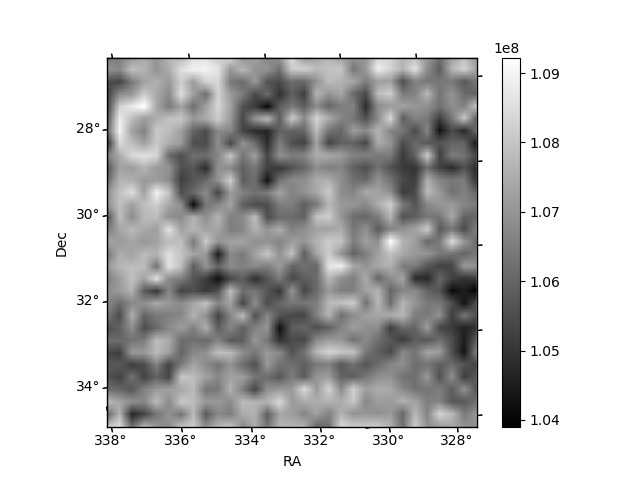
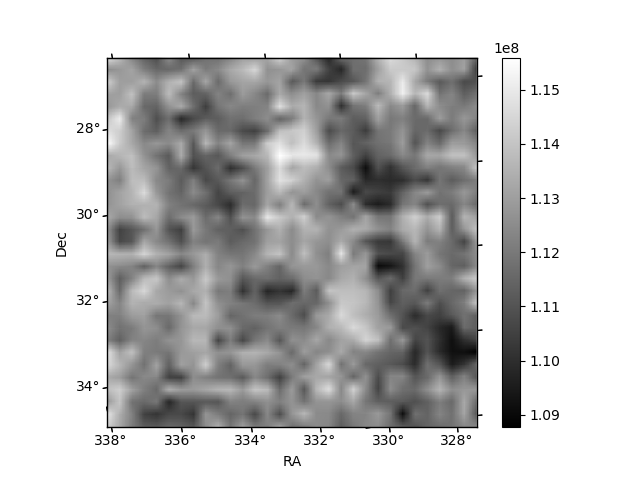
Histogram calculated using DETX and DETY for each event in the final _common_clean file
| Quadrant A | 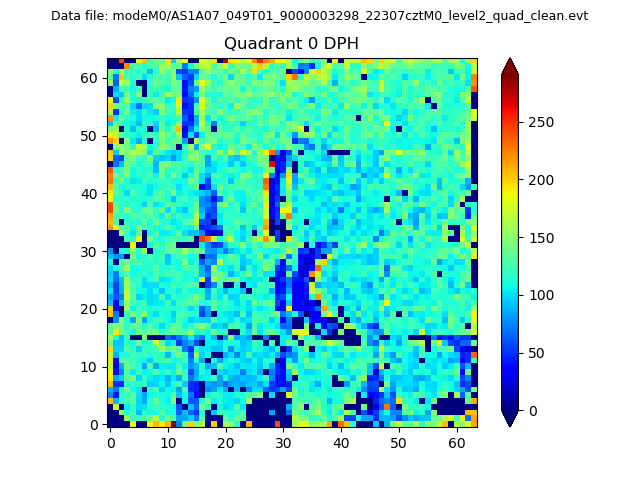 |
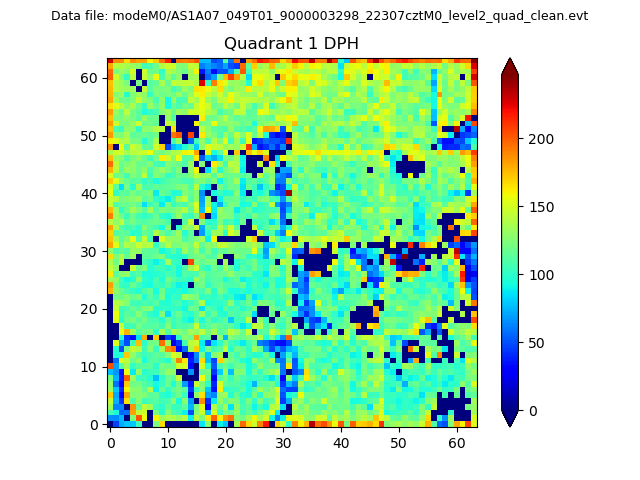 |
Quadrant B |
|---|---|---|---|
| Quadrant D | 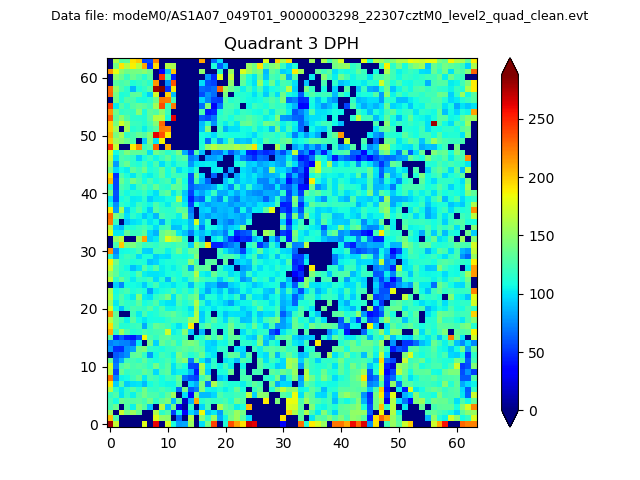 |
 |
Quadrant C |
| Plot type | Count rate plots | Images |
|---|---|---|
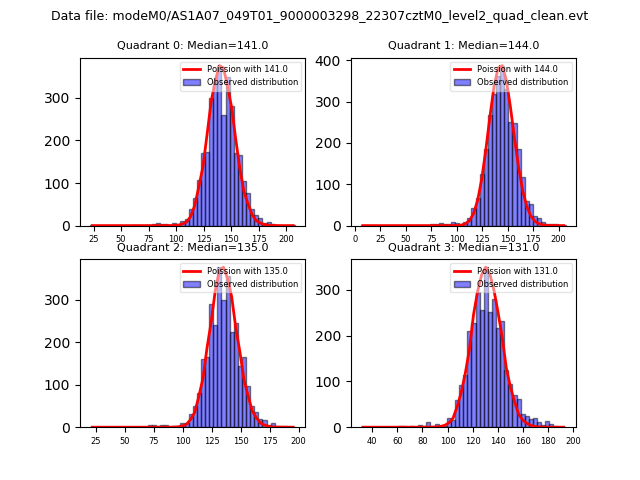
| Comparison with Poisson distribution Blue bars denote a histogram of data divided into 1 sec bins. Red curve is a Poisson curve with rate = median count rate of data. |
 |
 |
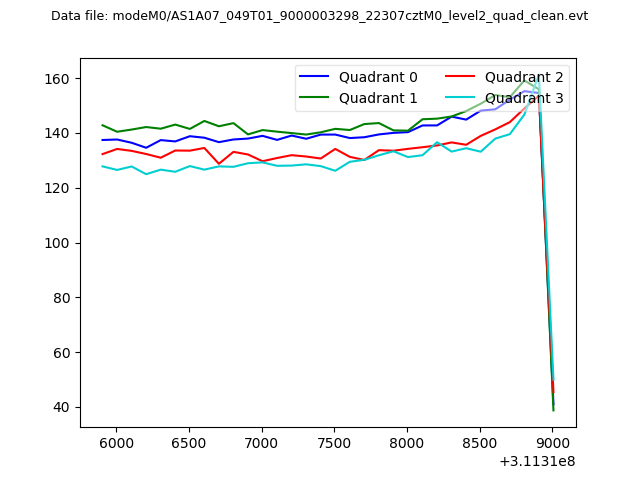
| Quadrant-wise count rates Data is divided into 100 sec bins |
 |
|
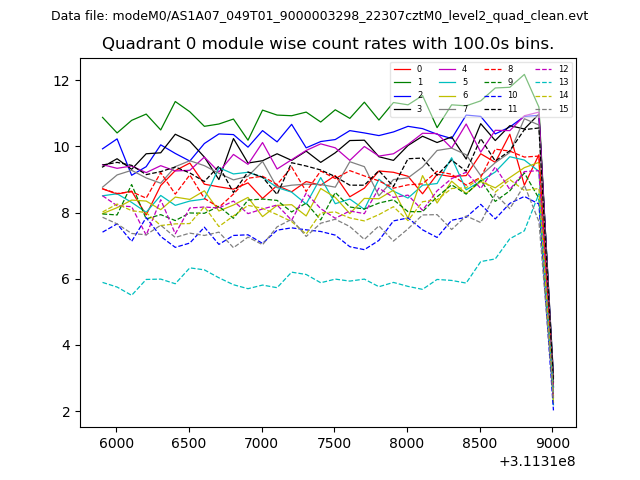
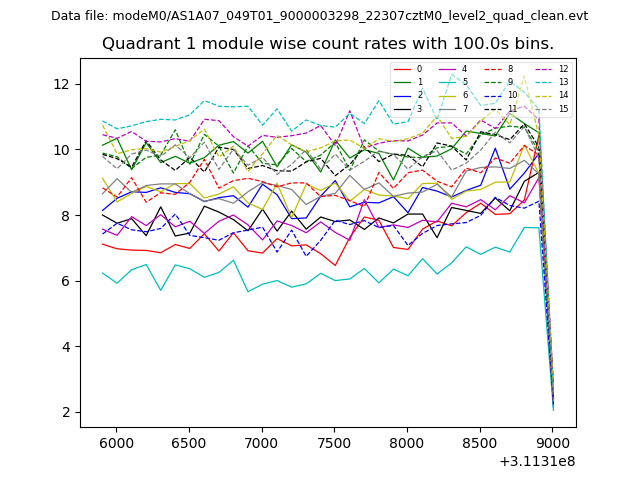
| Module-wise count rates for Quadrant A Data is divided into 100 sec bins |
 |
 |
| Module-wise count rates for Quadrant B Data is divided into 100 sec bins |
 |
 |
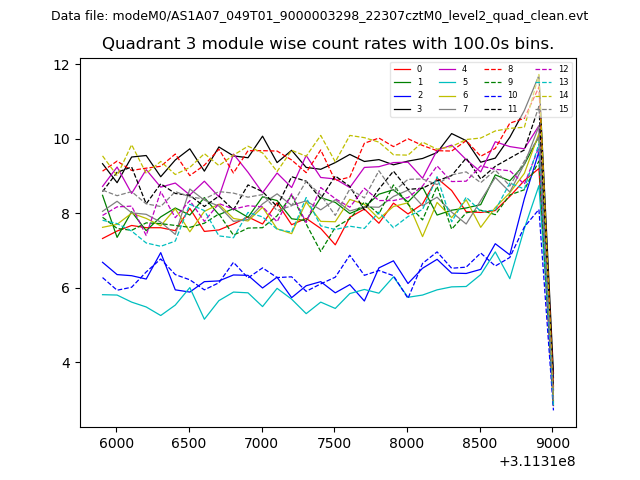
| Module-wise count rates for Quadrant C Data is divided into 100 sec bins |
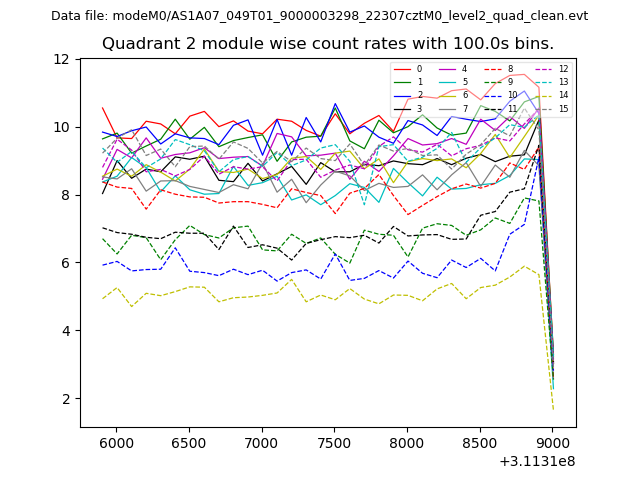 |
 |
| Module-wise count rates for Quadrant D Data is divided into 100 sec bins |
 |
 |
| Parameter | Plot |
|---|---|
| CZT HV Monitor | 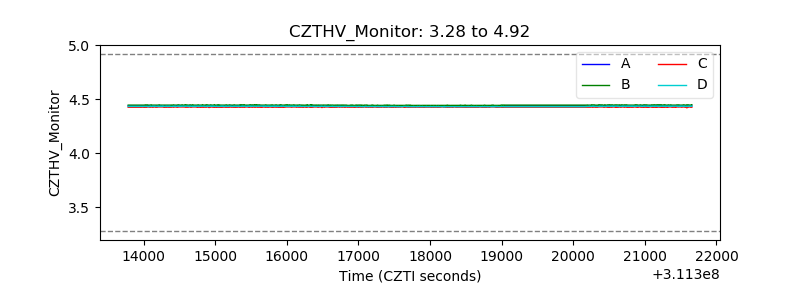 |
| D_VDD | 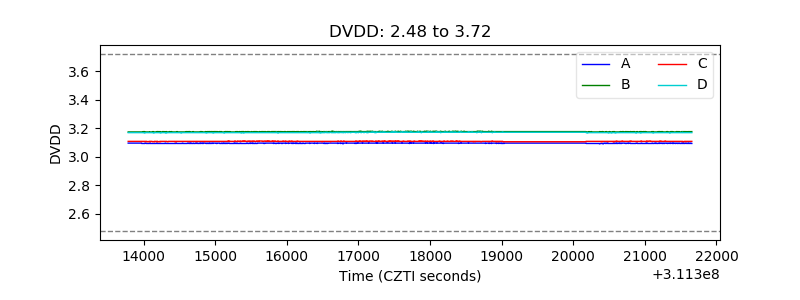 |
| Temperature 1 | 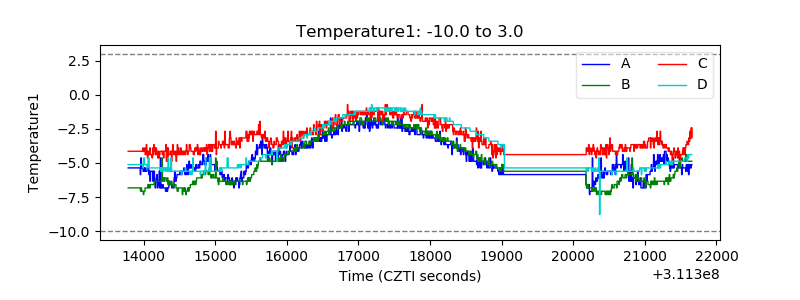 |
| Veto HV Monitor | 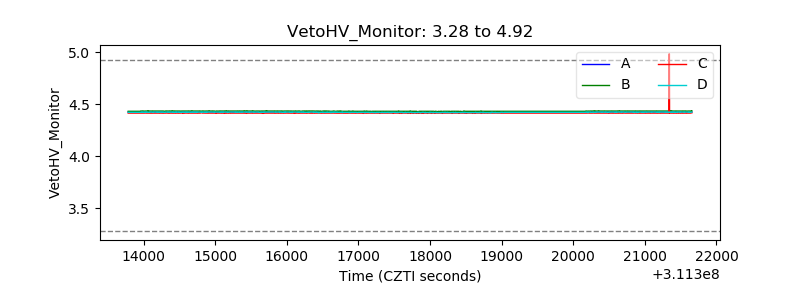 |
| Veto LLD | 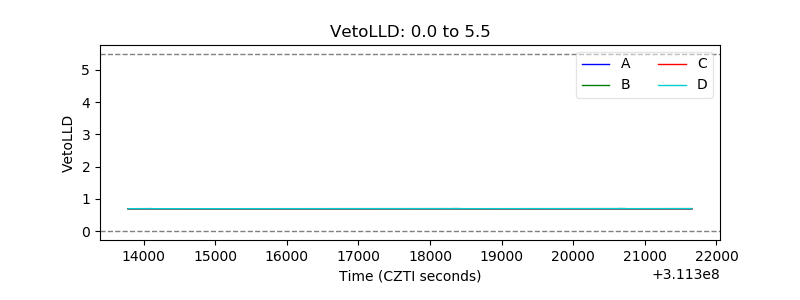 |
| Alpha Counter | 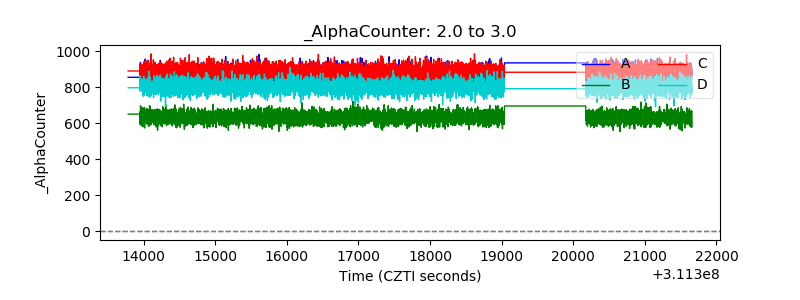 |
| _CPM_Rate | 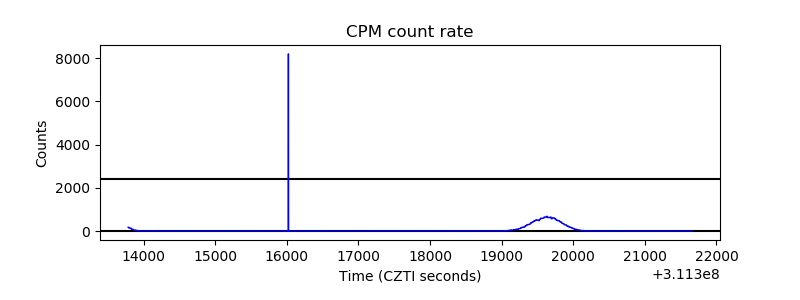 |
| CZT Counter | 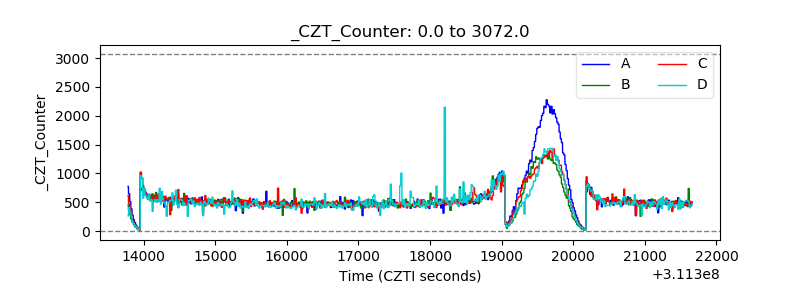 |
| +2.5 Volts monitor | 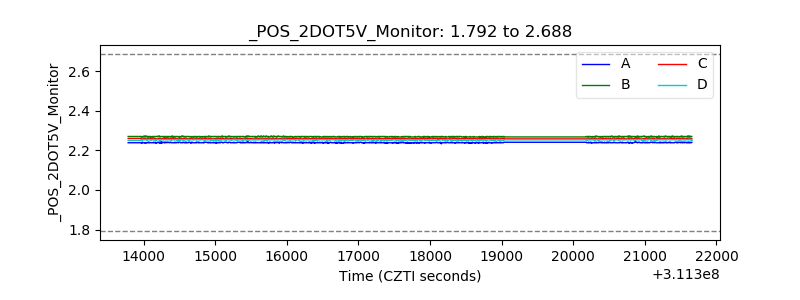 |
| +5 Volts monitor |  |
| _ROLL_ROT | 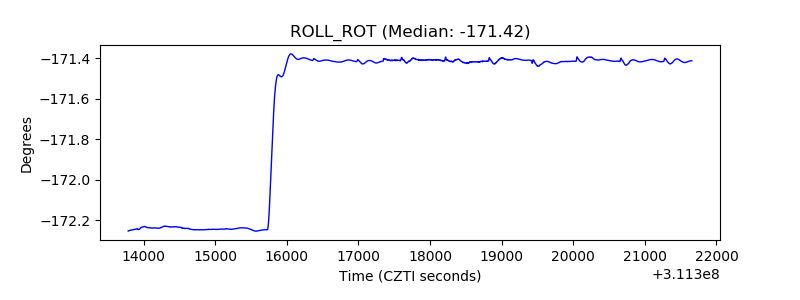 |
| _Roll_DEC | 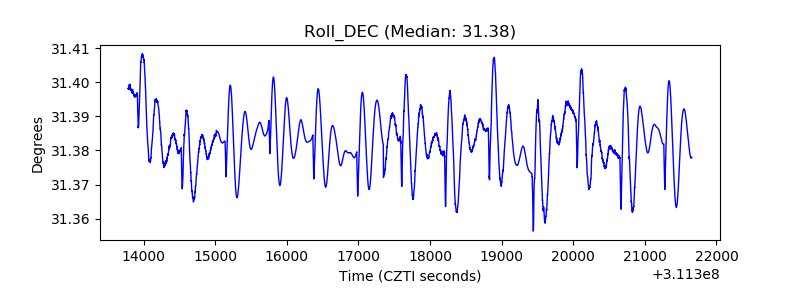 |
| _Roll_RA | 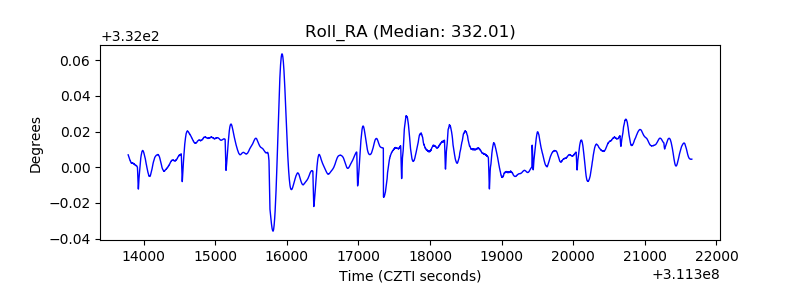 |
| Veto Counter | 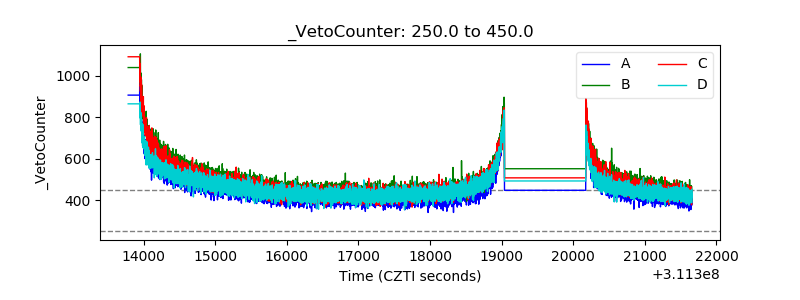 |