| Param | Original file | Final file |
|---|---|---|
| Filename | modeM0/AS1A07_049T01_9000003298_22309cztM0_level2.evt | modeM0/AS1A07_049T01_9000003298_22309cztM0_level2_quad_clean.evt |
| Size (bytes) | 295,718,400 | 68,186,880 |
| Size | 282.0 MB | 65.0 MB |
| Events in quadrant A | 2,144,746 | 442,906 |
| Events in quadrant B | 2,194,387 | 450,242 |
| Events in quadrant C | 2,133,480 | 425,368 |
| Events in quadrant D | 2,164,256 | 418,081 |
| Mode SS | |||
|---|---|---|---|
| Quadrant | BADHDUFLAG | Total packets | Discarded packets |
| A | 0 | 94 | 0 |
| B | 0 | 94 | 0 |
| C | 0 | 94 | 0 |
| D | 0 | 94 | 0 |
| Mode M0 | |||
|---|---|---|---|
| Quadrant | BADHDUFLAG | Total packets | Discarded packets |
| A | 0 | 9436 | 1 |
| B | 0 | 9478 | 1 |
| C | 0 | 9431 | 1 |
| D | 0 | 9683 | 1 |
| Quadrant | Total seconds | Saturated seconds | Saturation percentage |
|---|---|---|---|
| A | 4667 | 6 | 0.128562% |
| B | 4668 | 24 | 0.514139% |
| C | 4668 | 34 | 0.728363% |
| D | 4668 | 16 | 0.342759% |
Noise dominated data is calculated using 1-second bins in cleaned event files. If a bin has >2000 counts, and if more than 50% of those come from <1% of pixels, then it is considered to be noise-dominated and hence unusable.
| Quadrant | # 1 sec bins | Bins with >0 counts | Bins with >2000 counts | High rate bins dominated by noise | Noise dominated (total time) | Noise dominated (detector-on time) | Marked lightcurve |
|---|---|---|---|---|---|---|---|
| A | 4667 | 4667 | 0 | 0 | 0.00% | 0.00% | 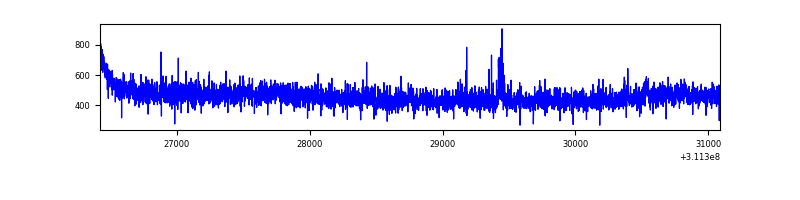 |
| B | 4668 | 4668 | 0 | 0 | 0.00% | 0.00% | 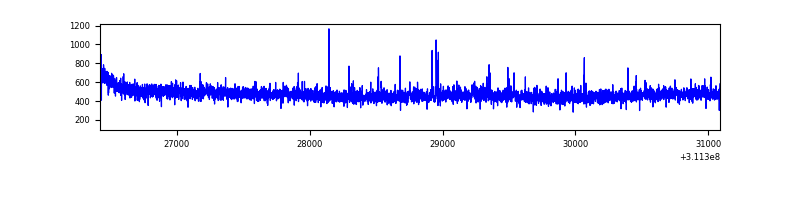 |
| C | 4668 | 4668 | 0 | 0 | 0.00% | 0.00% | 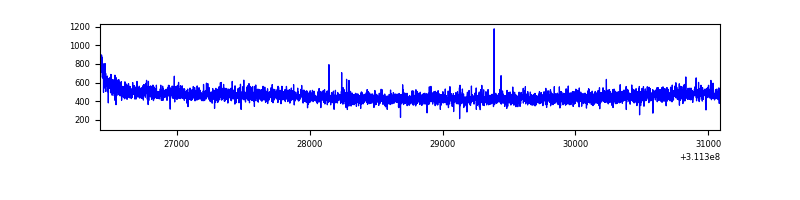 |
| D | 4668 | 4668 | 6 | 6 | 0.13% | 0.13% | 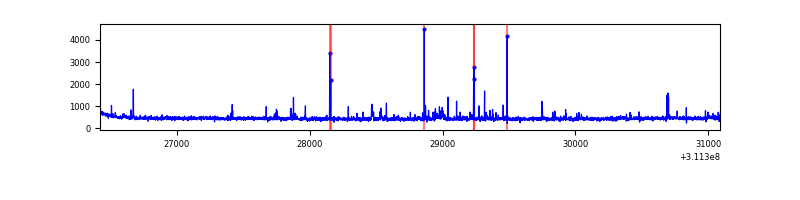 |
Top three noisy pixels from each quadrant. If the there are fewer than three noisy pixels in the level2.evt file, extra rows are filled as -1
| Pixel properties | Quadrant properties | ||||||
|---|---|---|---|---|---|---|---|
| Quadrant | DetID | PixID | Counts | Sigma | Mean | Median | Sigma |
| A | 8 | 6 | 17077 | 148.62 | 550 | 538 | 111.3 |
| A | 4 | 2 | 6764 | 55.94 | 550 | 538 | 111.3 |
| A | 13 | 254 | 5859 | 47.81 | 550 | 538 | 111.3 |
| B | 3 | 64 | 24852 | 233.15 | 548 | 536 | 104.3 |
| B | 12 | 111 | 12827 | 117.85 | 548 | 536 | 104.3 |
| B | 11 | 111 | 11260 | 102.83 | 548 | 536 | 104.3 |
| C | 14 | 238 | 83443 | 675.53 | 525 | 530 | 122.7 |
| C | 0 | 10 | 3833 | 26.91 | 525 | 530 | 122.7 |
| C | 13 | 61 | 3694 | 25.78 | 525 | 530 | 122.7 |
| D | 1 | 52 | 31969 | 240.75 | 534 | 518 | 130.6 |
| D | 2 | 136 | 30246 | 227.56 | 534 | 518 | 130.6 |
| D | 13 | 172 | 23800 | 178.22 | 534 | 518 | 130.6 |
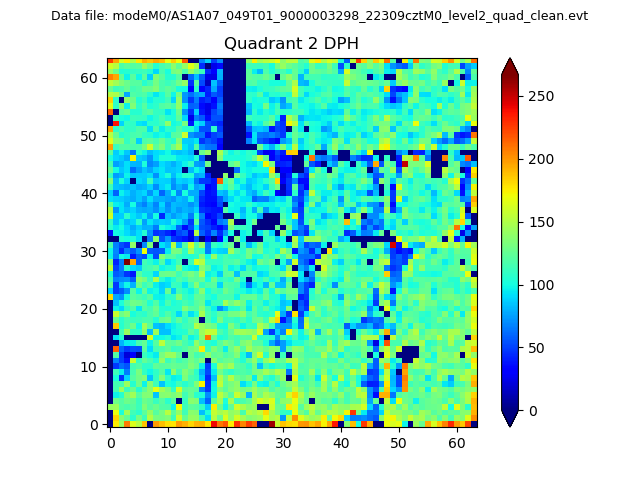
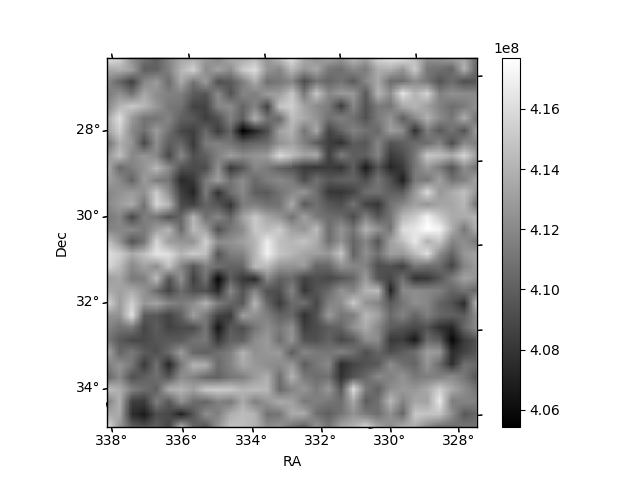
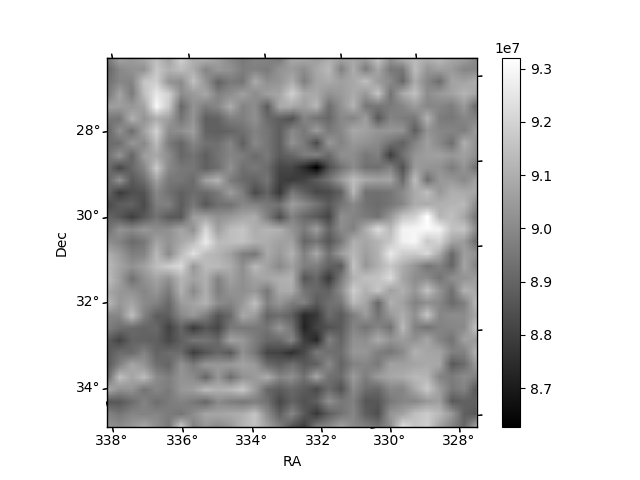
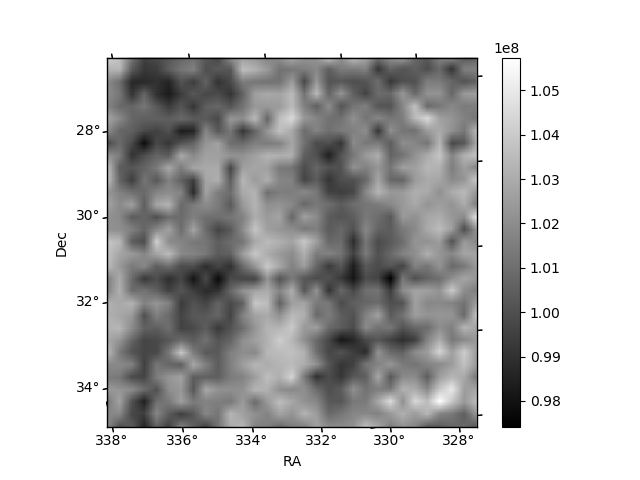
Histogram calculated using DETX and DETY for each event in the final _common_clean file
| Quadrant A | 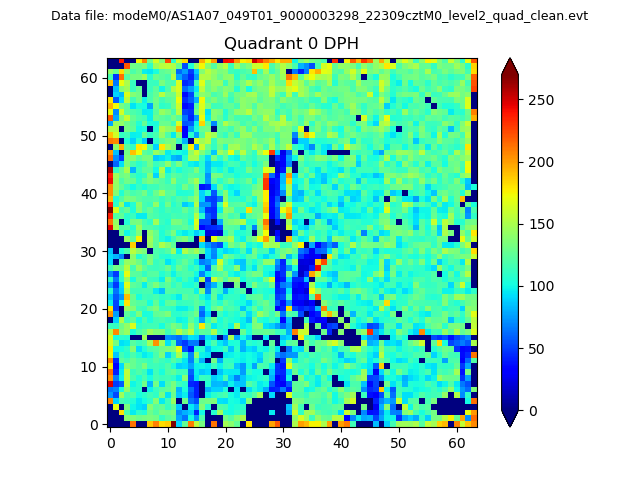 |
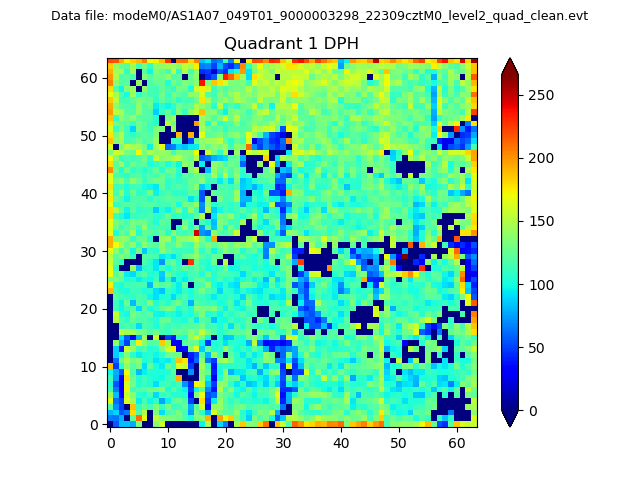 |
Quadrant B |
|---|---|---|---|
| Quadrant D | 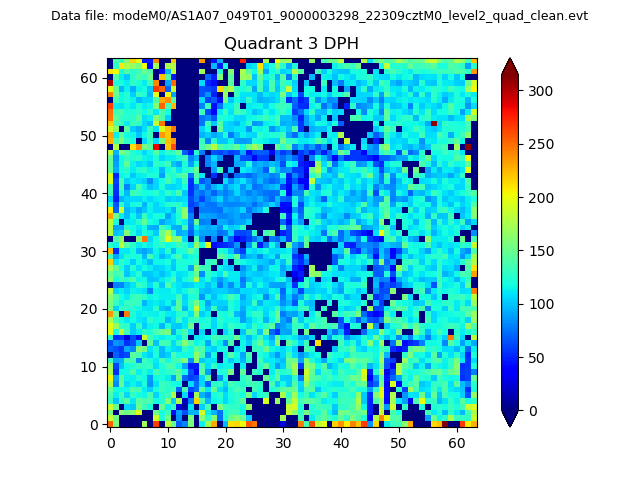 |
 |
Quadrant C |
| Plot type | Count rate plots | Images |
|---|---|---|
| Comparison with Poisson distribution Blue bars denote a histogram of data divided into 1 sec bins. Red curve is a Poisson curve with rate = median count rate of data. |
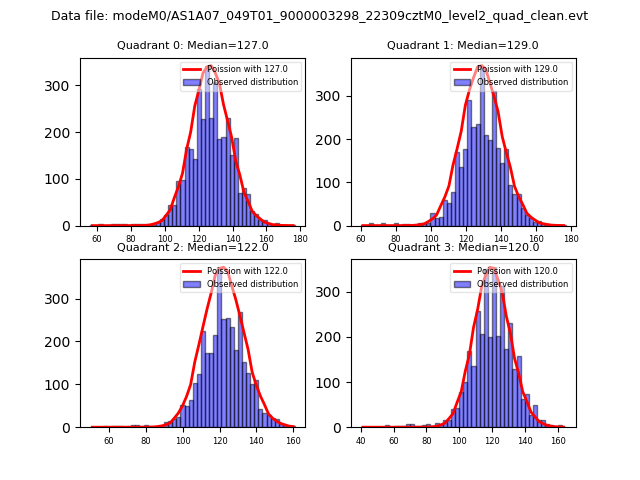 |
 |
| Quadrant-wise count rates Data is divided into 100 sec bins |
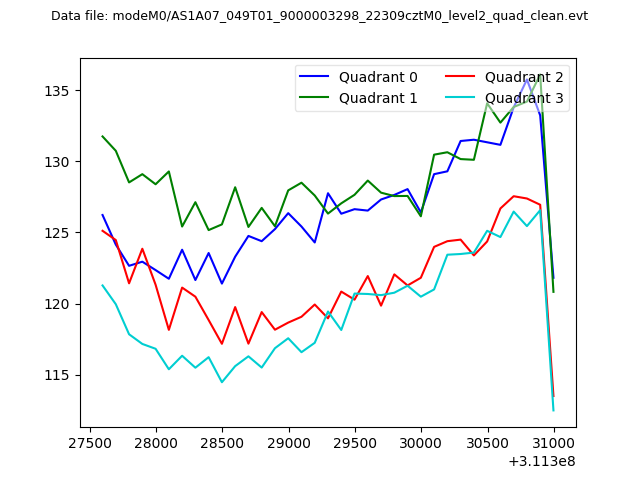 |
|
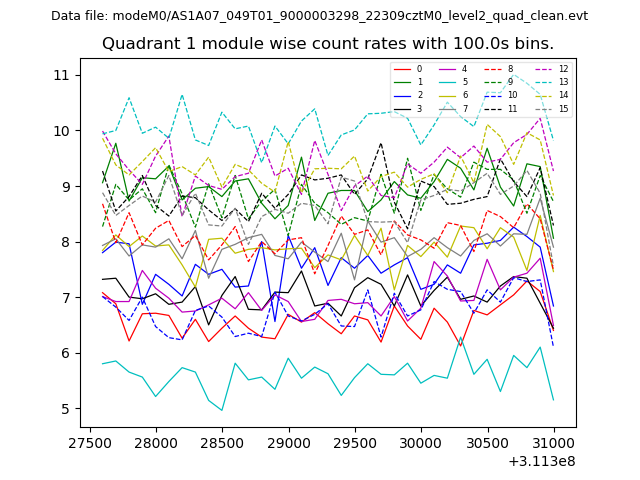
| Module-wise count rates for Quadrant A Data is divided into 100 sec bins |
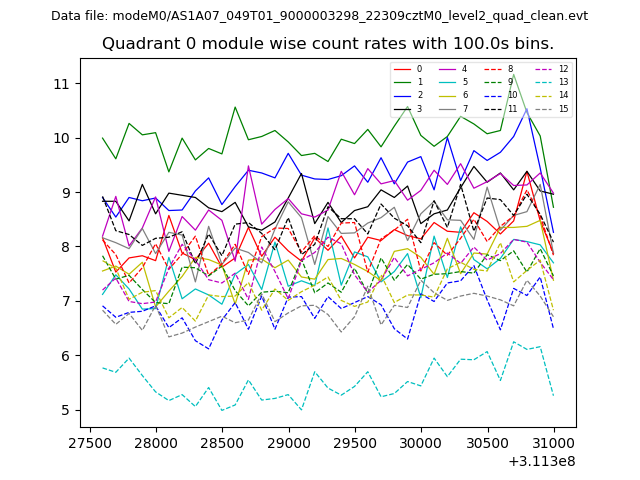 |
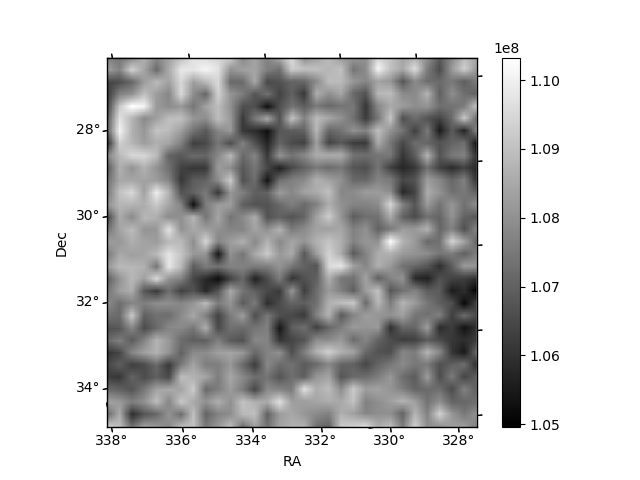 |
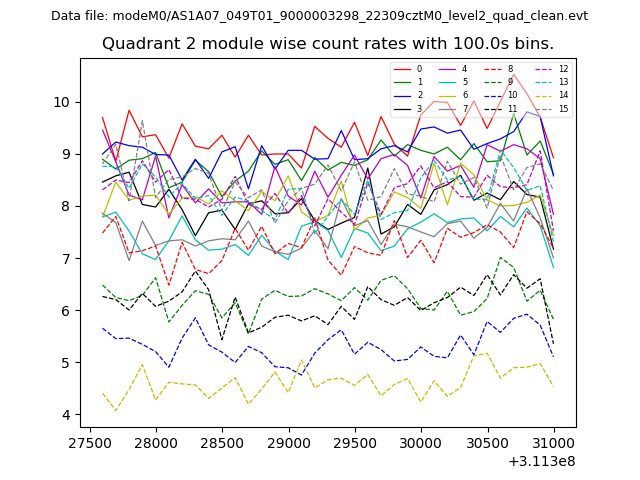
| Module-wise count rates for Quadrant B Data is divided into 100 sec bins |
 |
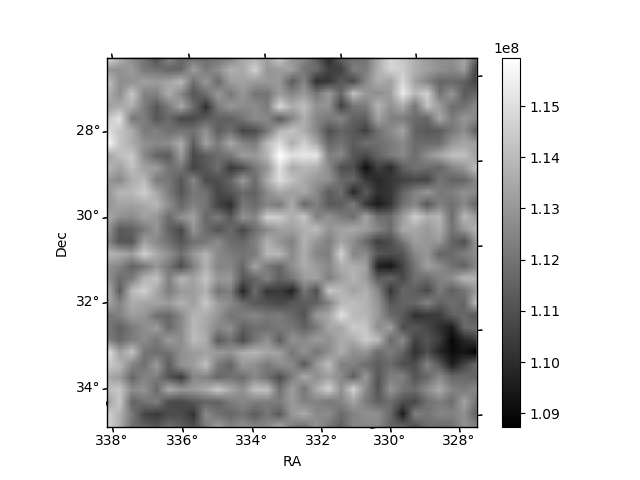 |
| Module-wise count rates for Quadrant C Data is divided into 100 sec bins |
 |
 |
| Module-wise count rates for Quadrant D Data is divided into 100 sec bins |
 |
 |
| Parameter | Plot |
|---|---|
| CZT HV Monitor | 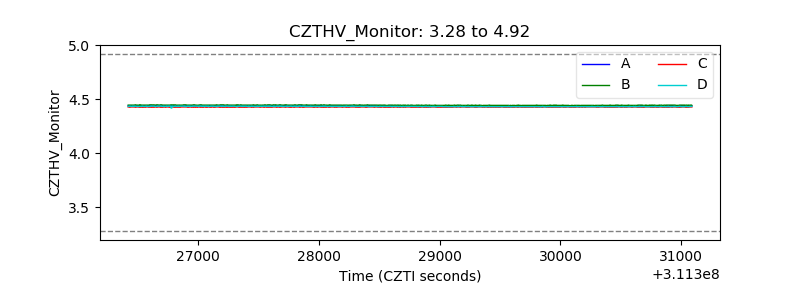 |
| D_VDD |  |
| Temperature 1 | 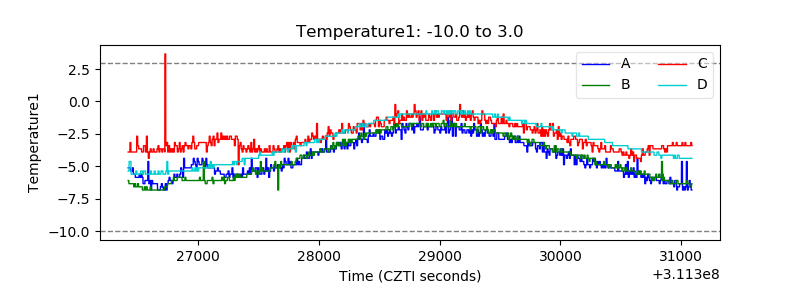 |
| Veto HV Monitor | 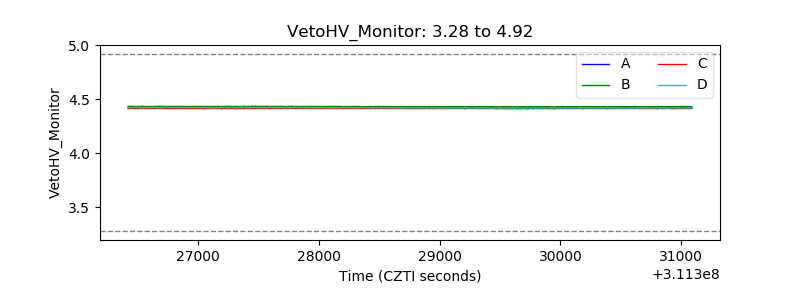 |
| Veto LLD | 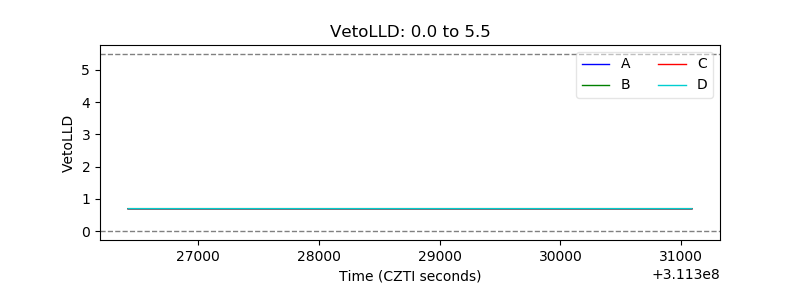 |
| Alpha Counter | 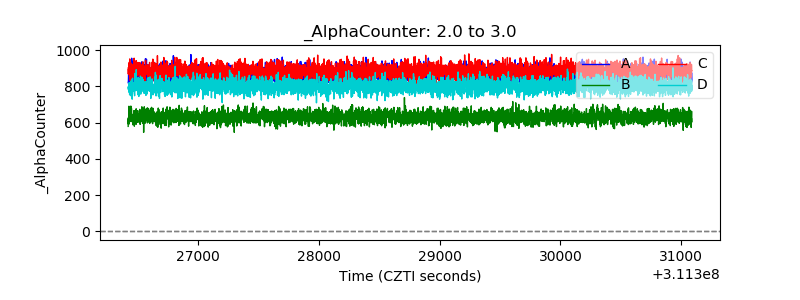 |
| _CPM_Rate | 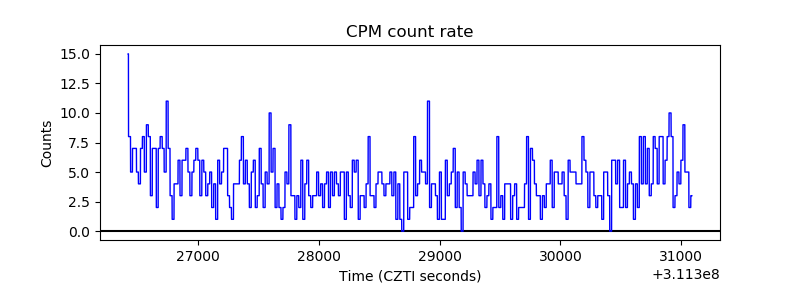 |
| CZT Counter | 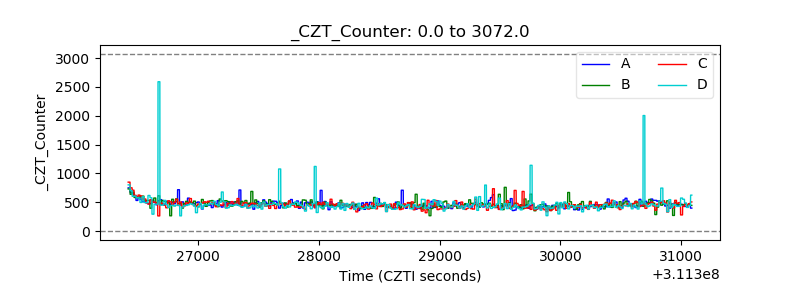 |
| +2.5 Volts monitor |  |
| +5 Volts monitor |  |
| _ROLL_ROT | 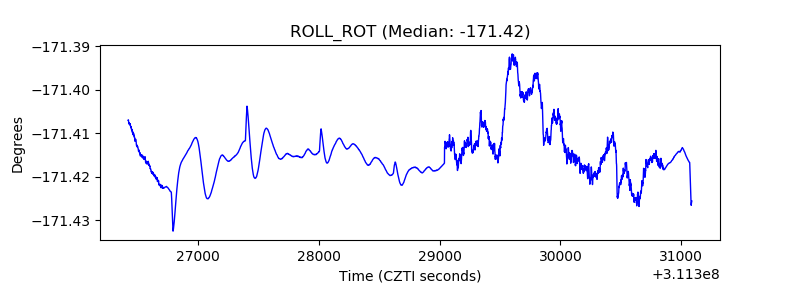 |
| _Roll_DEC | 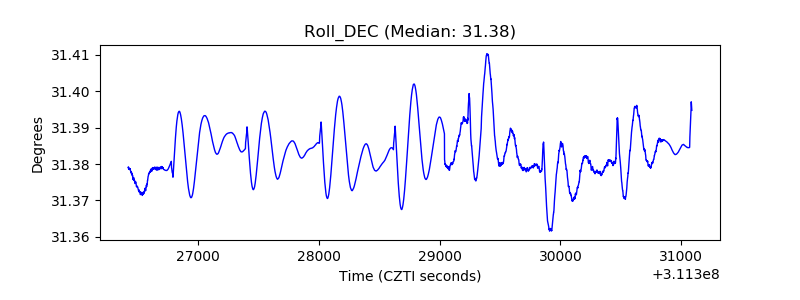 |
| _Roll_RA | 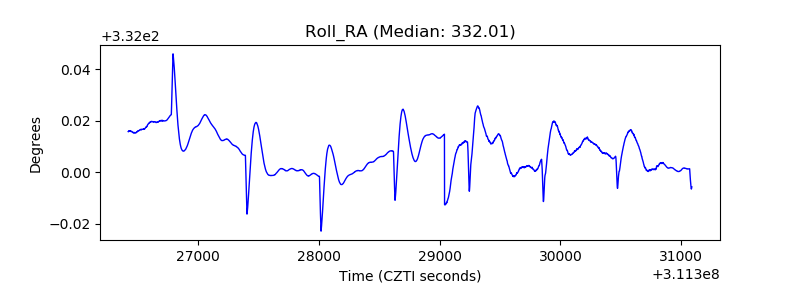 |
| Veto Counter | 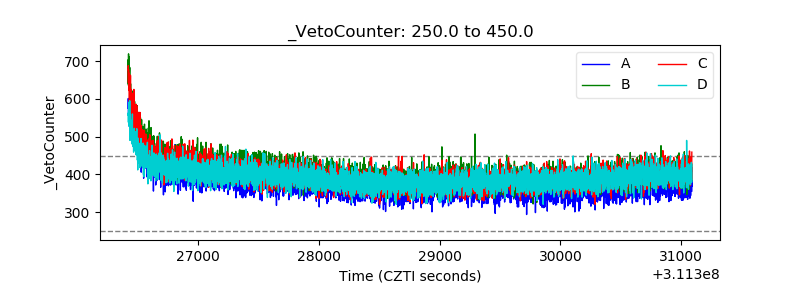 |