| Param | Original file | Final file |
|---|---|---|
| Filename | modeM0/AS1A07_047T09_9000003300_22309cztM0_level2.evt | modeM0/AS1A07_047T09_9000003300_22309cztM0_level2_quad_clean.evt |
| Size (bytes) | 116,052,480 | 13,285,440 |
| Size | 110.7 MB | 12.7 MB |
| Events in quadrant A | 834,865 | 69,528 |
| Events in quadrant B | 841,437 | 72,722 |
| Events in quadrant C | 861,321 | 70,388 |
| Events in quadrant D | 862,820 | 68,376 |
| Mode M9 | |||
|---|---|---|---|
| Quadrant | BADHDUFLAG | Total packets | Discarded packets |
| A | 0 | 3 | 0 |
| B | 0 | 3 | 0 |
| C | 0 | 3 | 0 |
| D | 0 | 3 | 0 |
| Mode M0 | |||
|---|---|---|---|
| Quadrant | BADHDUFLAG | Total packets | Discarded packets |
| A | 0 | 3503 | 1 |
| B | 0 | 3522 | 1 |
| C | 0 | 3531 | 1 |
| D | 0 | 3613 | 1 |
| Mode SS | |||
|---|---|---|---|
| Quadrant | BADHDUFLAG | Total packets | Discarded packets |
| A | 0 | 34 | 0 |
| B | 0 | 34 | 0 |
| C | 0 | 34 | 0 |
| D | 0 | 34 | 0 |
| Quadrant | Total seconds | Saturated seconds | Saturation percentage |
|---|---|---|---|
| A | 1640 | 135 | 8.231707% |
| B | 1640 | 136 | 8.292683% |
| C | 1640 | 153 | 9.329268% |
| D | 1640 | 127 | 7.743902% |
Noise dominated data is calculated using 1-second bins in cleaned event files. If a bin has >2000 counts, and if more than 50% of those come from <1% of pixels, then it is considered to be noise-dominated and hence unusable.
| Quadrant | # 1 sec bins | Bins with >0 counts | Bins with >2000 counts | High rate bins dominated by noise | Noise dominated (total time) | Noise dominated (detector-on time) | Marked lightcurve |
|---|---|---|---|---|---|---|---|
| A | 1935 | 1641 | 0 | 0 | 0.00% | 0.00% | 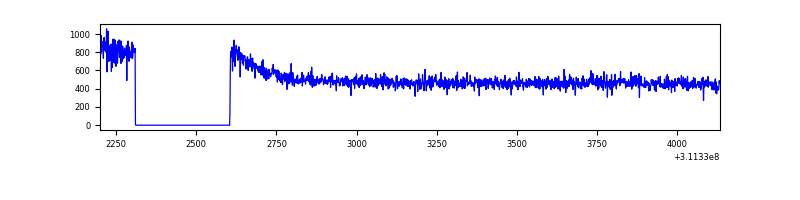 |
| B | 1935 | 1641 | 0 | 0 | 0.00% | 0.00% | 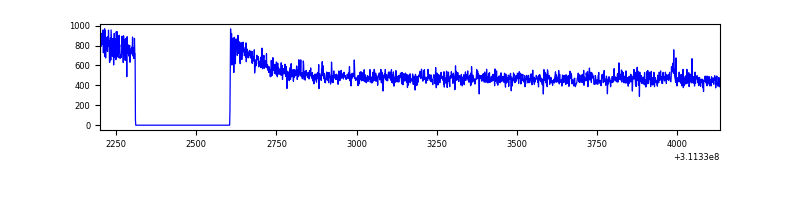 |
| C | 1935 | 1640 | 0 | 0 | 0.00% | 0.00% |  |
| D | 1935 | 1641 | 7 | 7 | 0.36% | 0.43% | 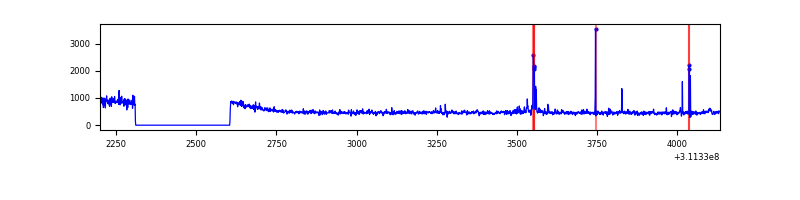 |
Top three noisy pixels from each quadrant. If the there are fewer than three noisy pixels in the level2.evt file, extra rows are filled as -1
| Pixel properties | Quadrant properties | ||||||
|---|---|---|---|---|---|---|---|
| Quadrant | DetID | PixID | Counts | Sigma | Mean | Median | Sigma |
| A | 3 | 137 | 1999 | 38.95 | 216 | 210 | 45.9 |
| A | 13 | 254 | 1920 | 37.23 | 216 | 210 | 45.9 |
| A | 0 | 226 | 1793 | 34.46 | 216 | 210 | 45.9 |
| B | 12 | 111 | 4986 | 109.84 | 213 | 207 | 43.5 |
| B | 11 | 111 | 4666 | 102.49 | 213 | 207 | 43.5 |
| B | 14 | 111 | 4120 | 89.94 | 213 | 207 | 43.5 |
| C | 14 | 238 | 33033 | 641.46 | 212 | 212 | 51.2 |
| C | 13 | 61 | 1421 | 23.63 | 212 | 212 | 51.2 |
| C | 0 | 10 | 542 | 6.45 | 212 | 212 | 51.2 |
| D | 1 | 52 | 16770 | 306.28 | 216 | 208 | 54.1 |
| D | 13 | 104 | 16494 | 301.17 | 216 | 208 | 54.1 |
| D | 2 | 120 | 7367 | 132.39 | 216 | 208 | 54.1 |
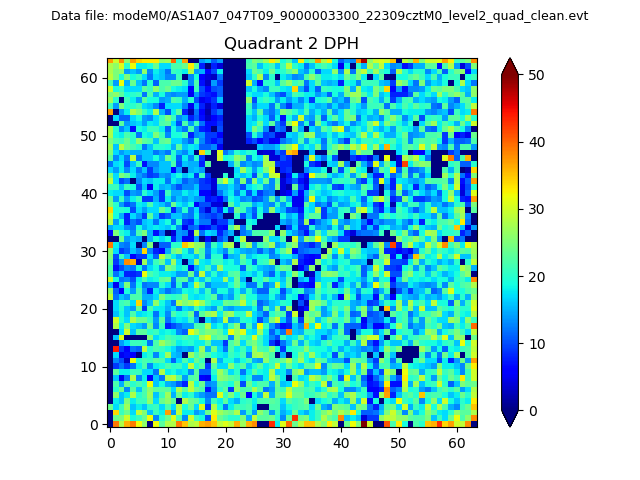
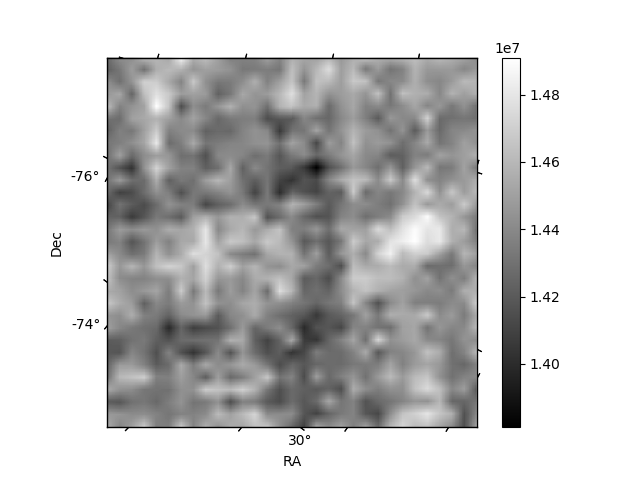
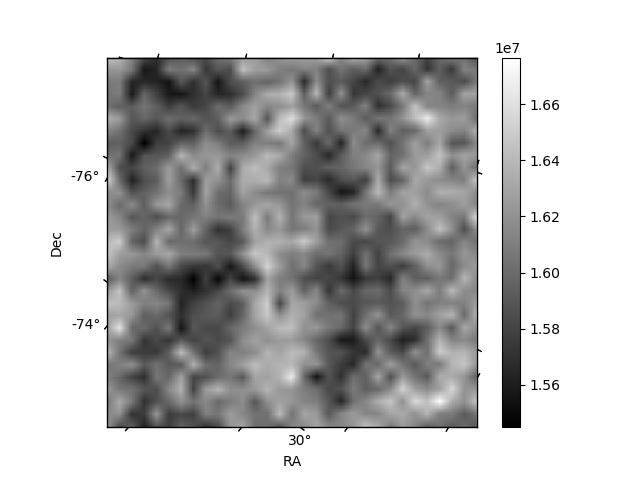
Histogram calculated using DETX and DETY for each event in the final _common_clean file
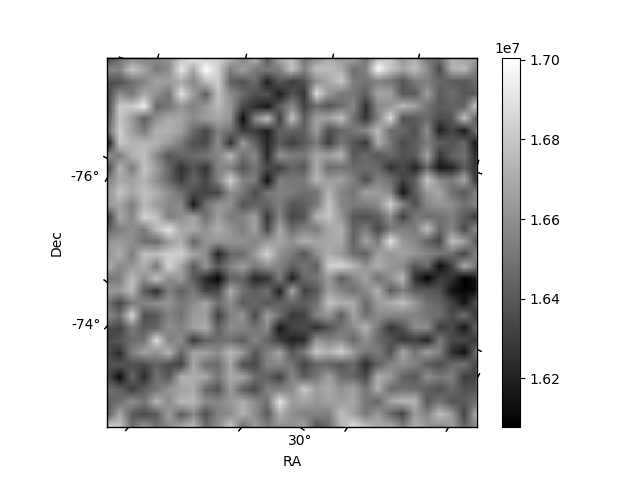
| Quadrant A |  |
 |
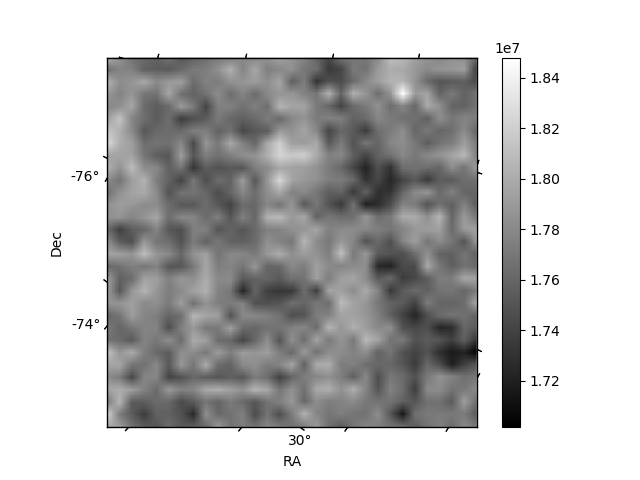
Quadrant B |
|---|---|---|---|
| Quadrant D | 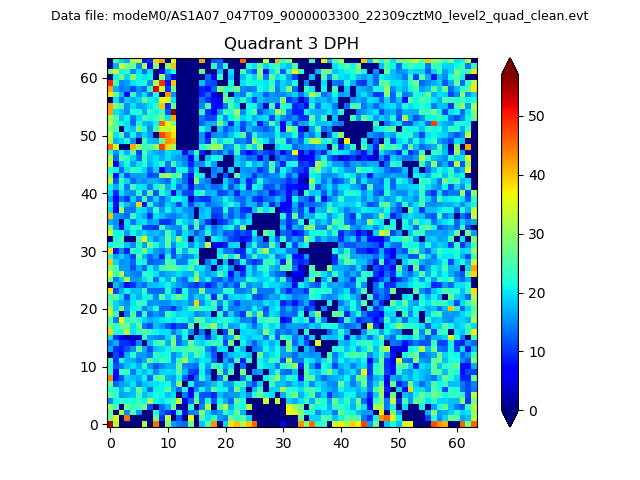 |
 |
Quadrant C |
| Plot type | Count rate plots | Images |
|---|---|---|
| Comparison with Poisson distribution Blue bars denote a histogram of data divided into 1 sec bins. Red curve is a Poisson curve with rate = median count rate of data. |
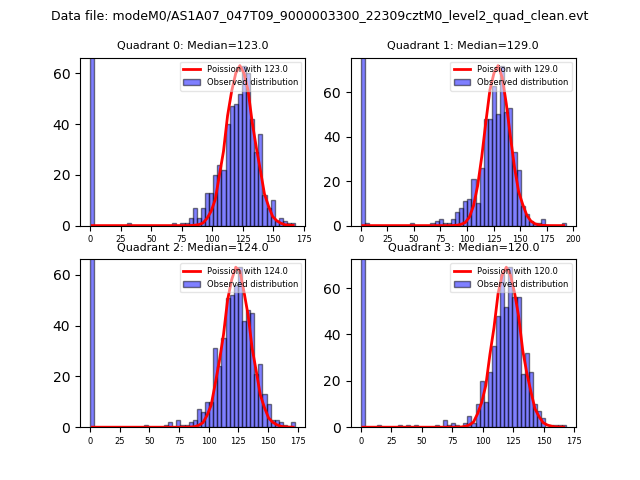 |
 |
| Quadrant-wise count rates Data is divided into 100 sec bins |
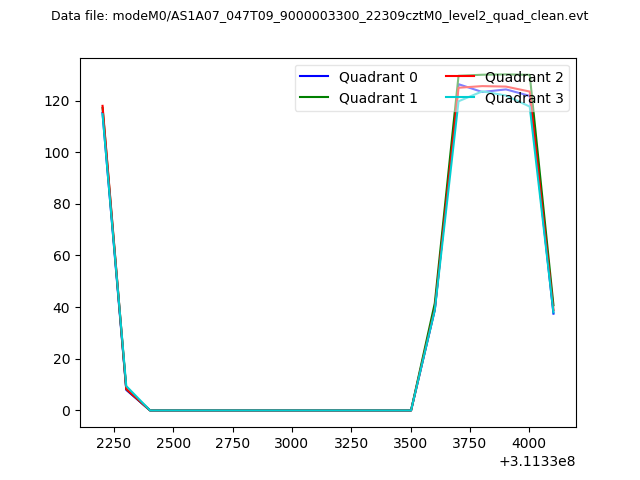 |
|
| Module-wise count rates for Quadrant A Data is divided into 100 sec bins |
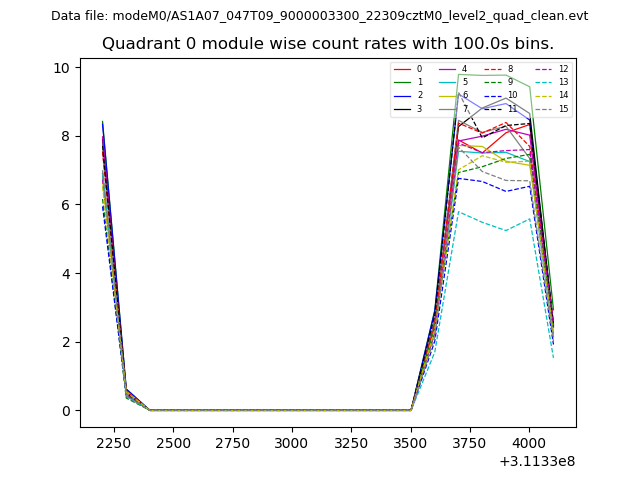 |
 |
| Module-wise count rates for Quadrant B Data is divided into 100 sec bins |
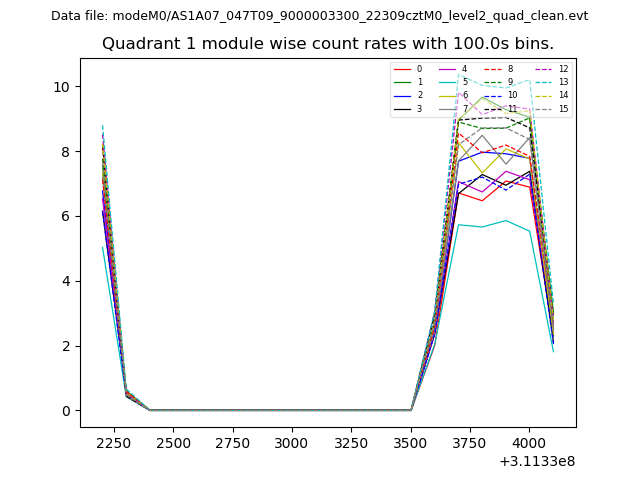 |
 |
| Module-wise count rates for Quadrant C Data is divided into 100 sec bins |
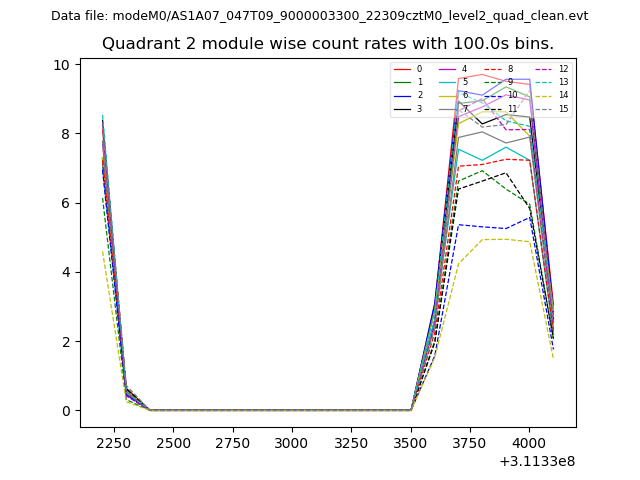 |
 |
| Module-wise count rates for Quadrant D Data is divided into 100 sec bins |
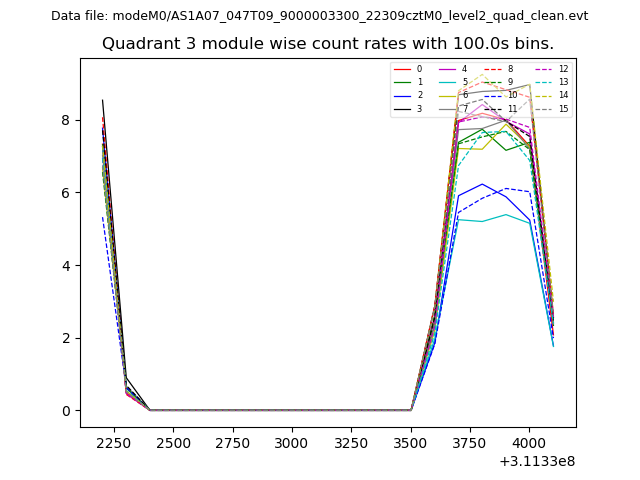 |
 |
| Parameter | Plot |
|---|---|
| CZT HV Monitor | 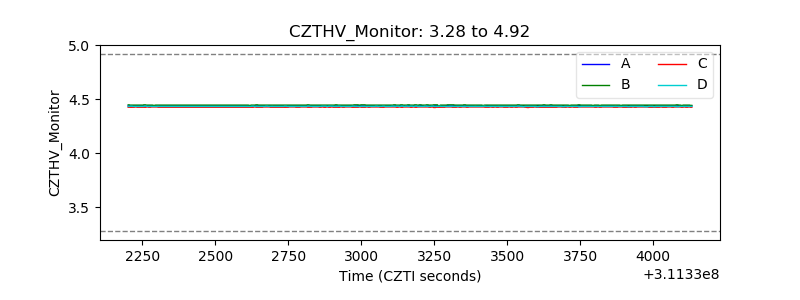 |
| D_VDD | 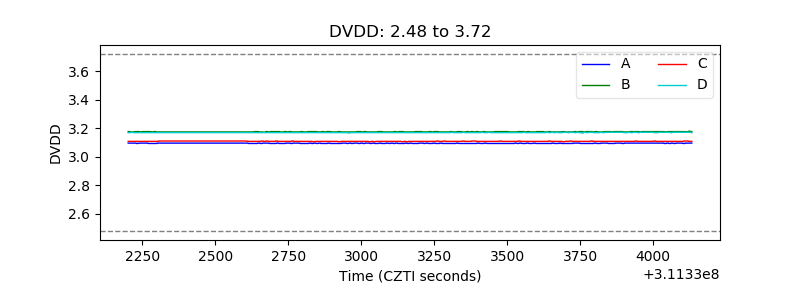 |
| Temperature 1 | 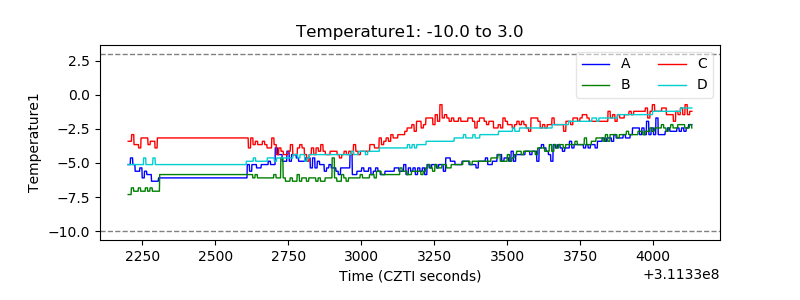 |
| Veto HV Monitor | 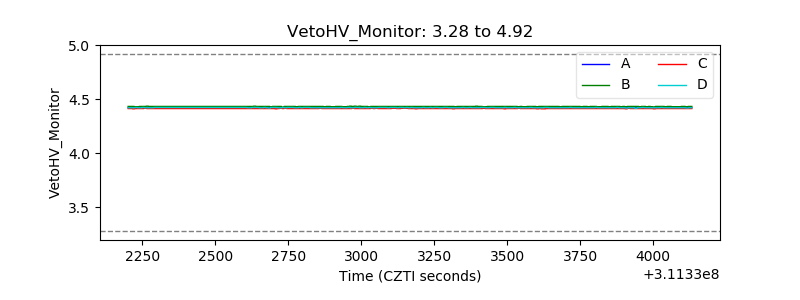 |
| Veto LLD | 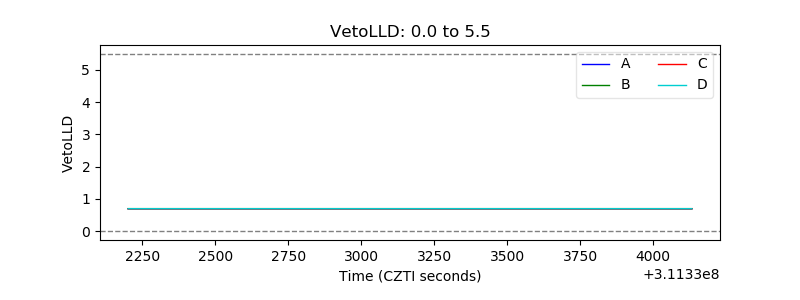 |
| Alpha Counter | 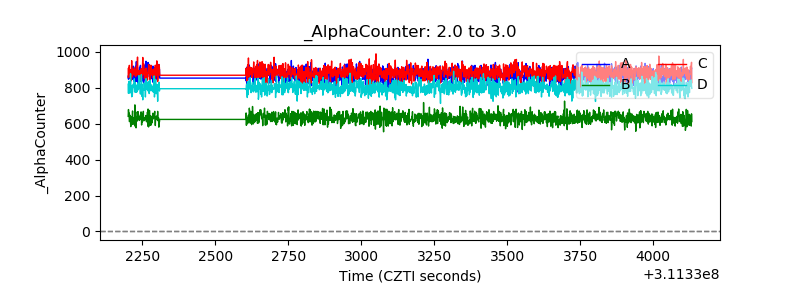 |
| _CPM_Rate | 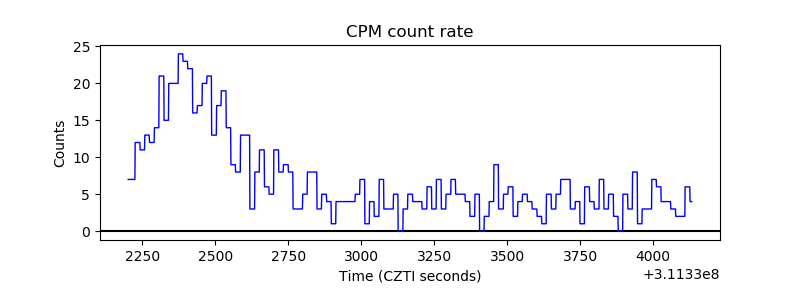 |
| CZT Counter | 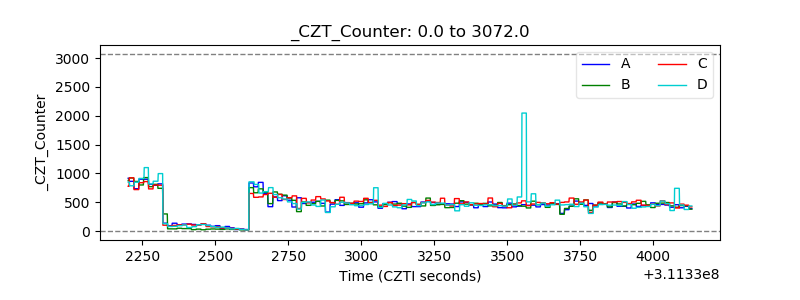 |
| +2.5 Volts monitor |  |
| +5 Volts monitor |  |
| _ROLL_ROT | 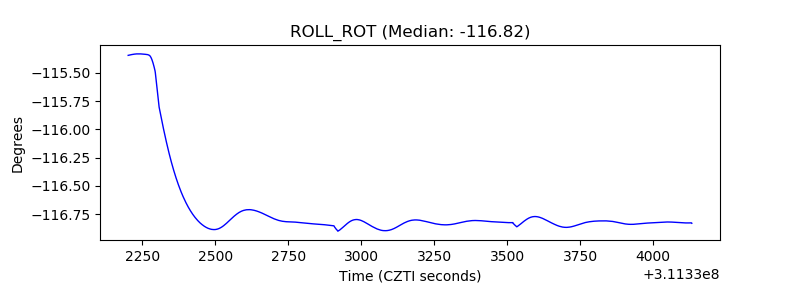 |
| _Roll_DEC | 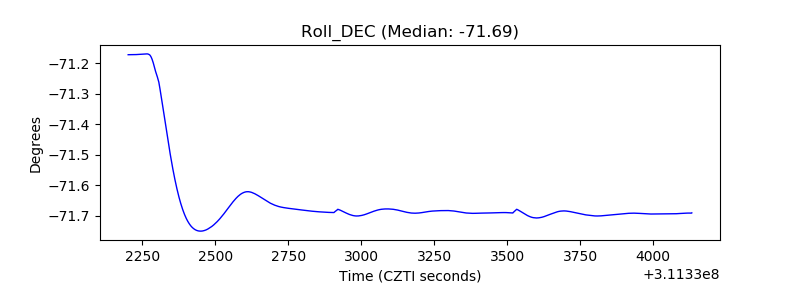 |
| _Roll_RA | 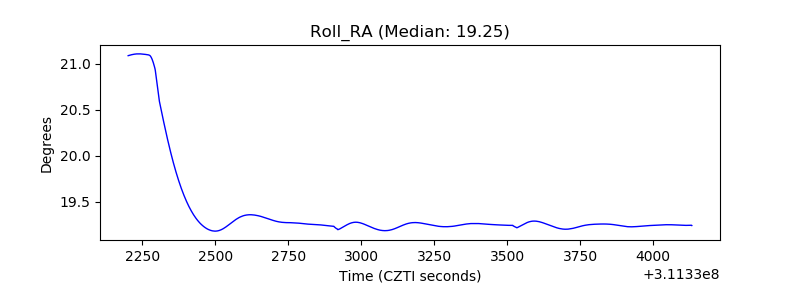 |
| Veto Counter | 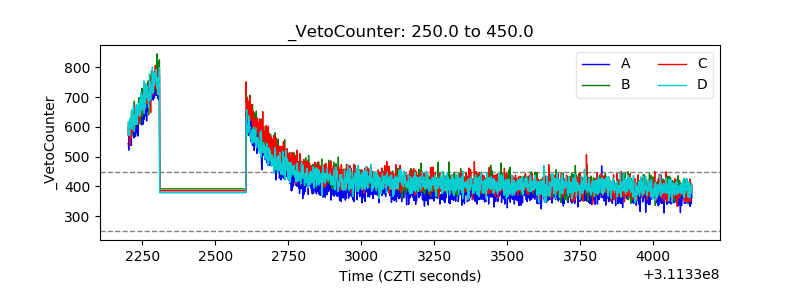 |