| Param | Original file | Final file |
|---|---|---|
| Filename | modeM0/AS1A07_047T09_9000003300_22310cztM0_level2.evt | modeM0/AS1A07_047T09_9000003300_22310cztM0_level2_quad_clean.evt |
| Size (bytes) | 484,387,200 | 108,956,160 |
| Size | 461.9 MB | 103.9 MB |
| Events in quadrant A | 3,386,413 | 708,972 |
| Events in quadrant B | 3,470,741 | 722,291 |
| Events in quadrant C | 3,405,517 | 690,502 |
| Events in quadrant D | 3,914,283 | 673,500 |
| Mode M9 | |||
|---|---|---|---|
| Quadrant | BADHDUFLAG | Total packets | Discarded packets |
| A | 0 | 1 | 0 |
| B | 0 | 1 | 0 |
| C | 0 | 1 | 0 |
| D | 0 | 1 | 0 |
| Mode M0 | |||
|---|---|---|---|
| Quadrant | BADHDUFLAG | Total packets | Discarded packets |
| A | 0 | 14967 | 1 |
| B | 0 | 15064 | 1 |
| C | 0 | 14933 | 1 |
| D | 0 | 16632 | 1 |
| Mode SS | |||
|---|---|---|---|
| Quadrant | BADHDUFLAG | Total packets | Discarded packets |
| A | 0 | 146 | 0 |
| B | 0 | 146 | 0 |
| C | 0 | 146 | 0 |
| D | 0 | 146 | 0 |
| Quadrant | Total seconds | Saturated seconds | Saturation percentage |
|---|---|---|---|
| A | 7249 | 211 | 2.910746% |
| B | 7250 | 231 | 3.186207% |
| C | 7250 | 228 | 3.144828% |
| D | 7250 | 204 | 2.813793% |
Noise dominated data is calculated using 1-second bins in cleaned event files. If a bin has >2000 counts, and if more than 50% of those come from <1% of pixels, then it is considered to be noise-dominated and hence unusable.
| Quadrant | # 1 sec bins | Bins with >0 counts | Bins with >2000 counts | High rate bins dominated by noise | Noise dominated (total time) | Noise dominated (detector-on time) | Marked lightcurve |
|---|---|---|---|---|---|---|---|
| A | 7314 | 7250 | 1 | 1 | 0.01% | 0.01% | 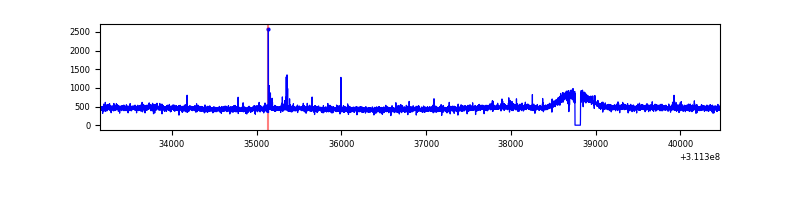 |
| B | 7315 | 7251 | 1 | 1 | 0.01% | 0.01% | 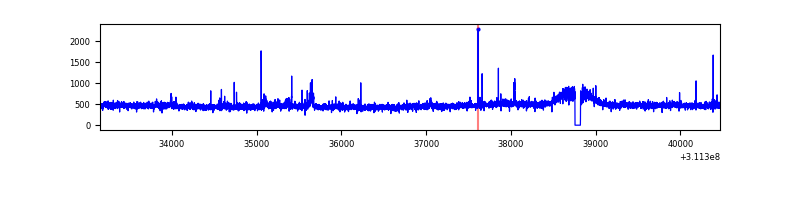 |
| C | 7315 | 7251 | 0 | 0 | 0.00% | 0.00% | 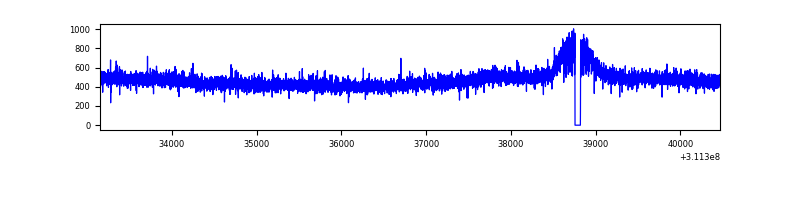 |
| D | 7315 | 7251 | 64 | 64 | 0.87% | 0.88% | 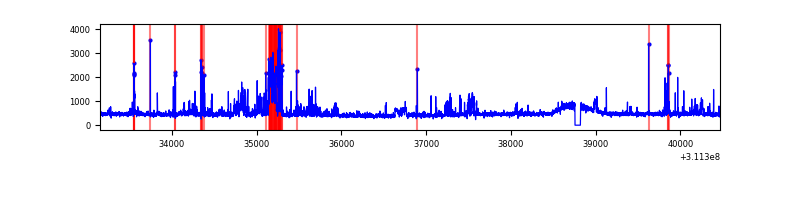 |
Top three noisy pixels from each quadrant. If the there are fewer than three noisy pixels in the level2.evt file, extra rows are filled as -1
| Pixel properties | Quadrant properties | ||||||
|---|---|---|---|---|---|---|---|
| Quadrant | DetID | PixID | Counts | Sigma | Mean | Median | Sigma |
| A | 4 | 2 | 20230 | 110.41 | 872 | 851 | 175.5 |
| A | 13 | 254 | 8554 | 43.89 | 872 | 851 | 175.5 |
| A | 3 | 137 | 7509 | 37.93 | 872 | 851 | 175.5 |
| B | 0 | 190 | 34788 | 205.03 | 869 | 846 | 165.5 |
| B | 12 | 111 | 20134 | 116.51 | 869 | 846 | 165.5 |
| B | 11 | 111 | 18022 | 103.75 | 869 | 846 | 165.5 |
| C | 14 | 238 | 132515 | 673.6 | 837 | 841 | 195.5 |
| C | 13 | 61 | 5867 | 25.71 | 837 | 841 | 195.5 |
| C | 8 | 128 | 4782 | 20.16 | 837 | 841 | 195.5 |
| D | 1 | 52 | 273469 | 1324.43 | 851 | 825 | 205.9 |
| D | 14 | 34 | 247148 | 1196.57 | 851 | 825 | 205.9 |
| D | 13 | 172 | 64266 | 308.18 | 851 | 825 | 205.9 |
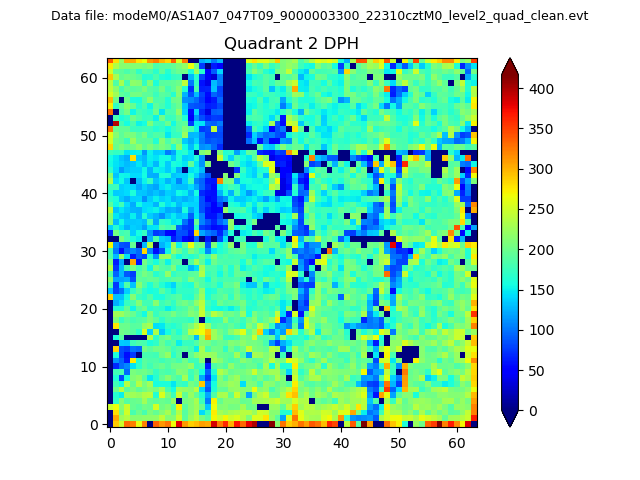
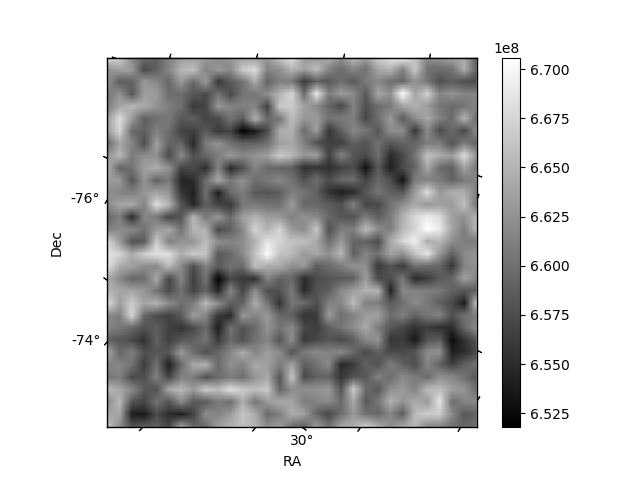
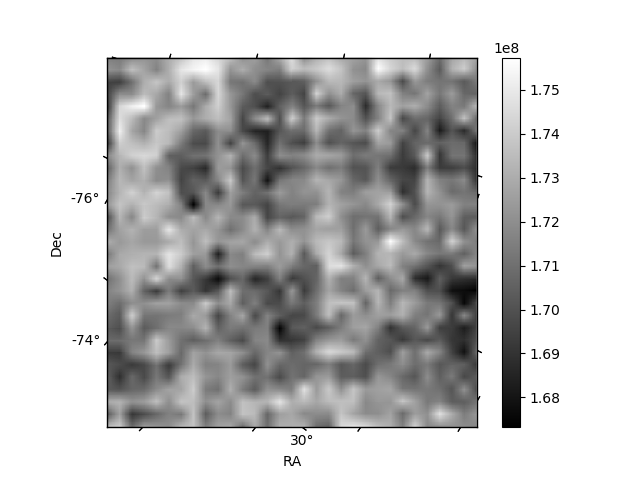
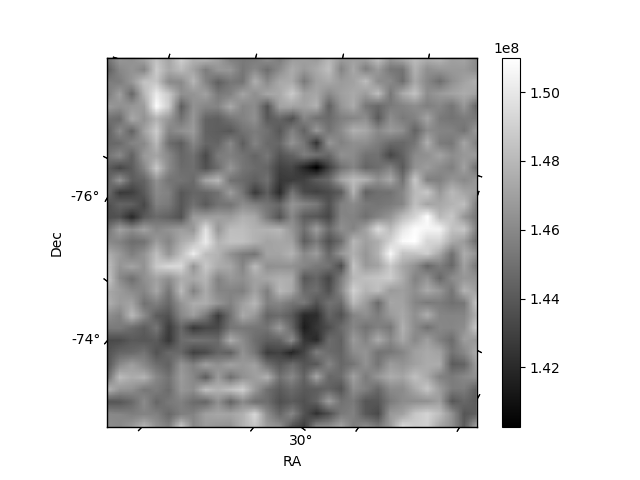
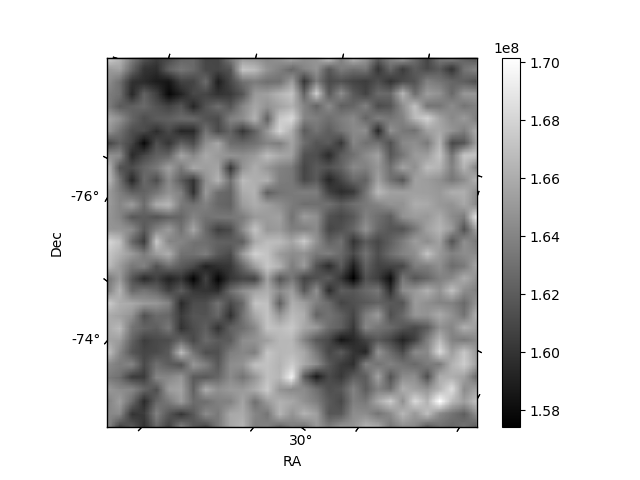
Histogram calculated using DETX and DETY for each event in the final _common_clean file
| Quadrant A | 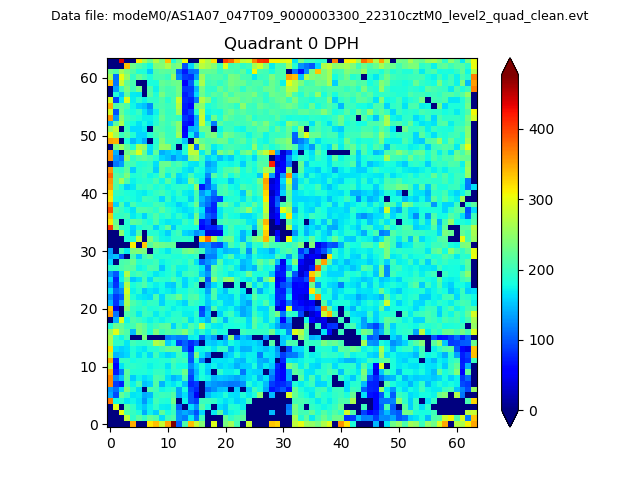 |
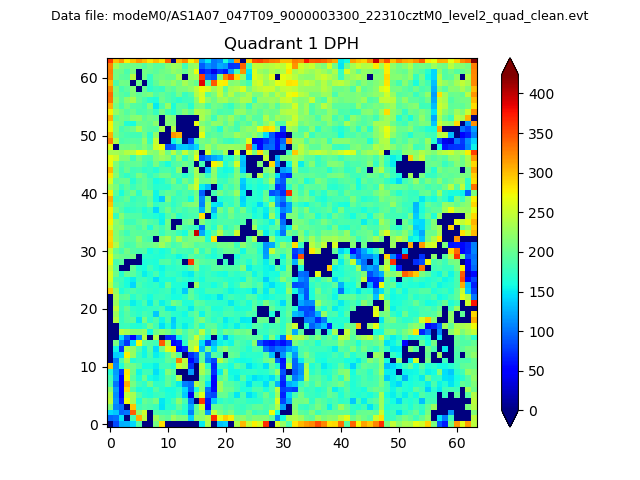 |
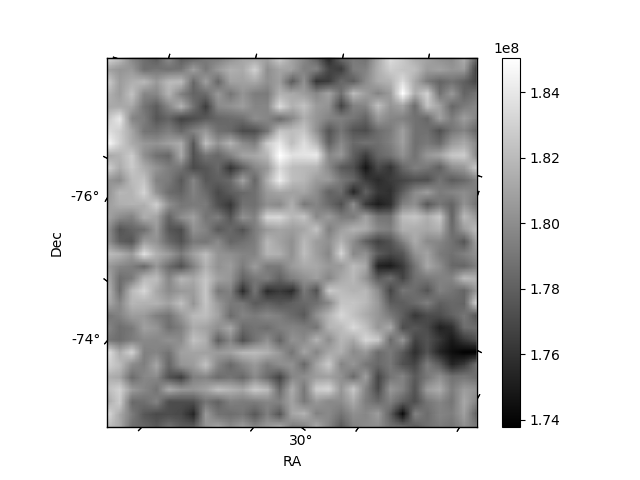
Quadrant B |
|---|---|---|---|
| Quadrant D | 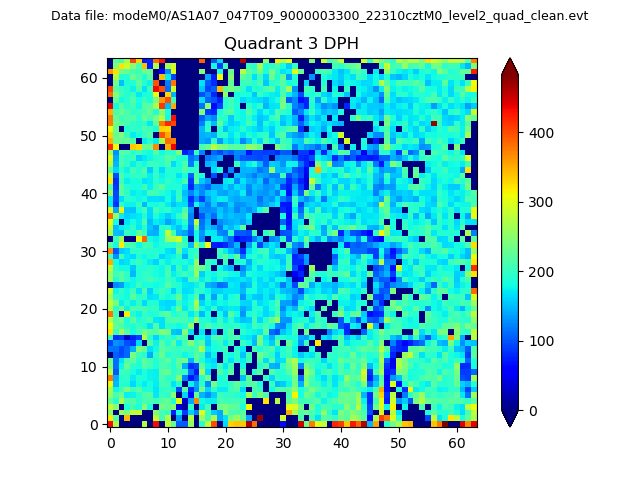 |
 |
Quadrant C |
| Plot type | Count rate plots | Images |
|---|---|---|
| Comparison with Poisson distribution Blue bars denote a histogram of data divided into 1 sec bins. Red curve is a Poisson curve with rate = median count rate of data. |
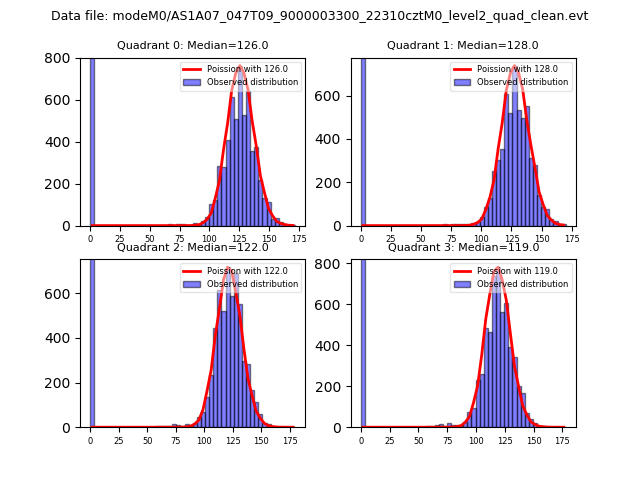 |
 |
| Quadrant-wise count rates Data is divided into 100 sec bins |
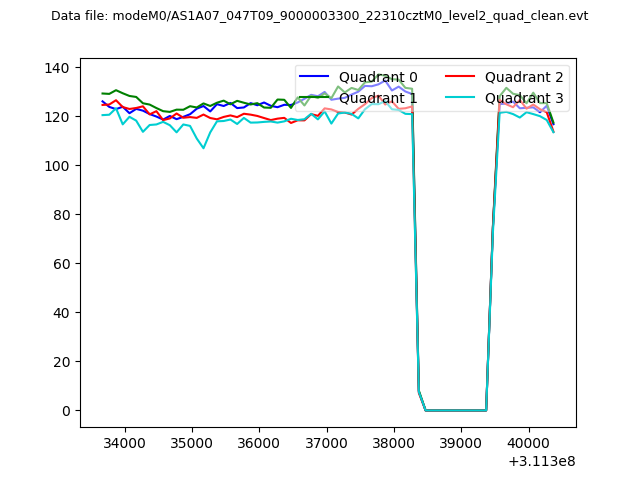 |
|
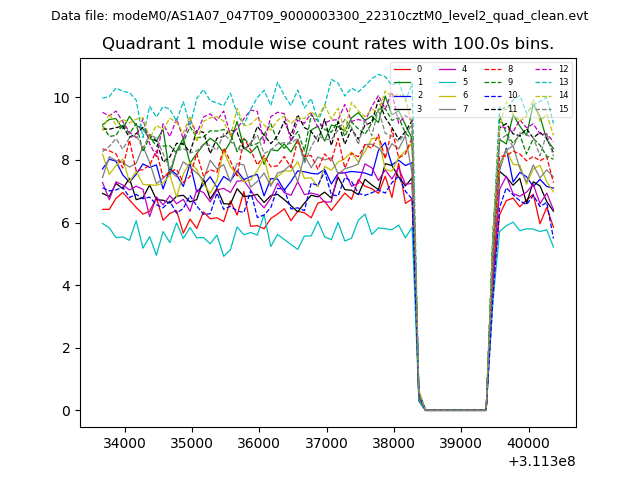
| Module-wise count rates for Quadrant A Data is divided into 100 sec bins |
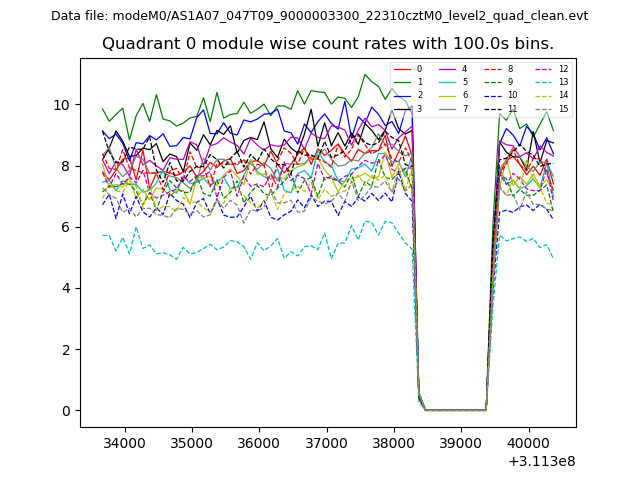 |
 |
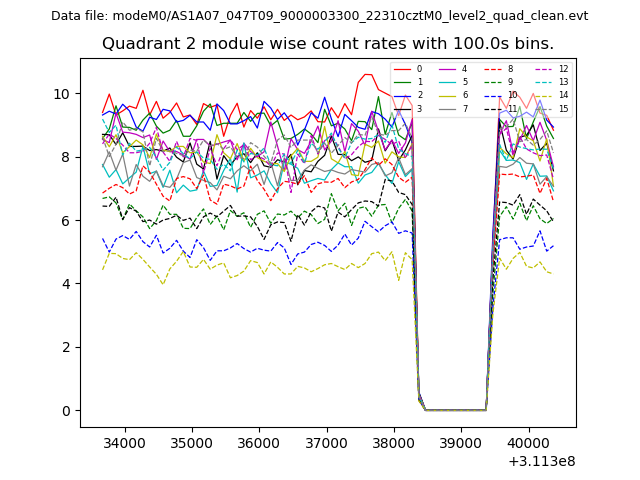
| Module-wise count rates for Quadrant B Data is divided into 100 sec bins |
 |
 |
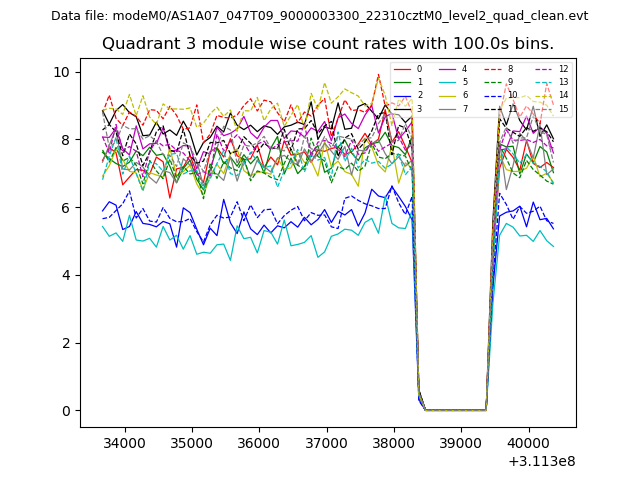
| Module-wise count rates for Quadrant C Data is divided into 100 sec bins |
 |
 |
| Module-wise count rates for Quadrant D Data is divided into 100 sec bins |
 |
 |
| Parameter | Plot |
|---|---|
| CZT HV Monitor | 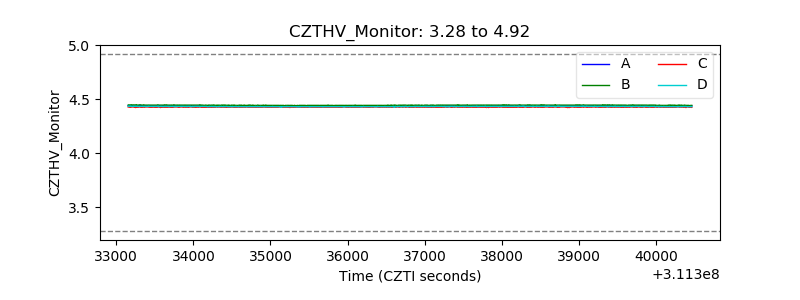 |
| D_VDD | 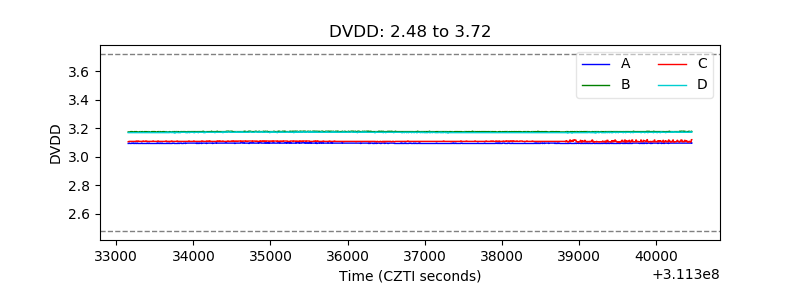 |
| Temperature 1 | 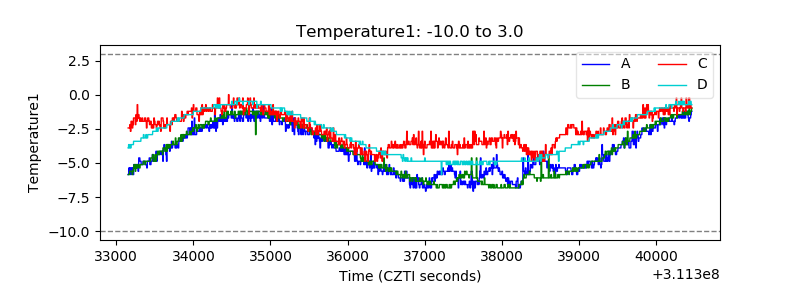 |
| Veto HV Monitor | 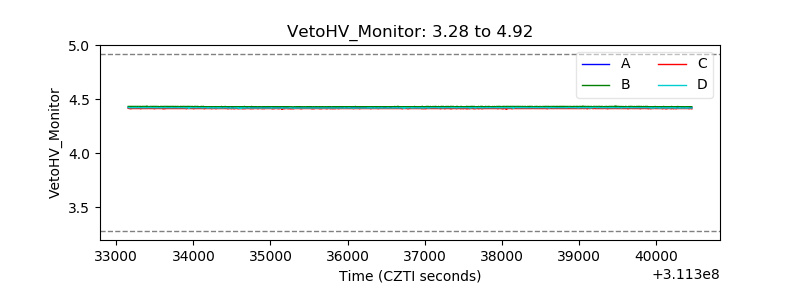 |
| Veto LLD | 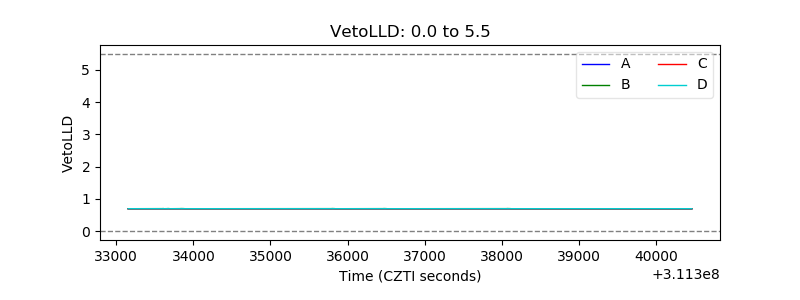 |
| Alpha Counter | 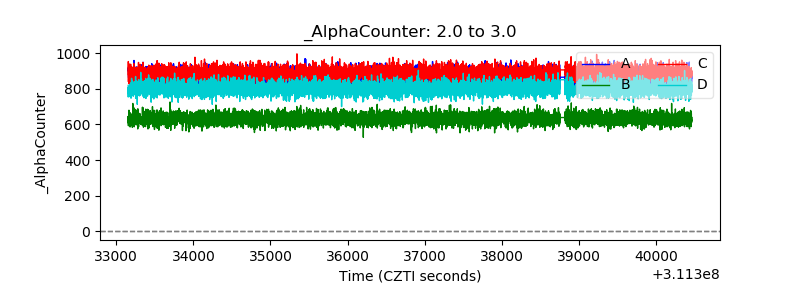 |
| _CPM_Rate |  |
| CZT Counter | 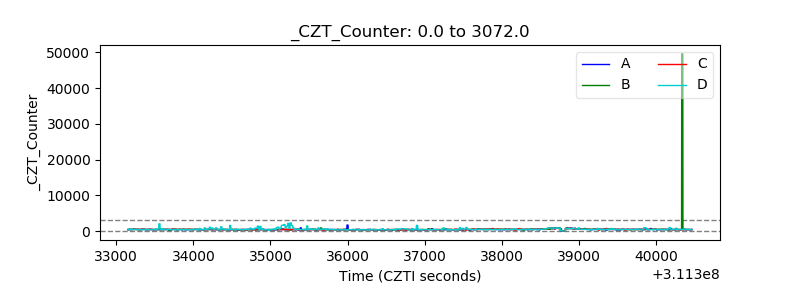 |
| +2.5 Volts monitor |  |
| +5 Volts monitor |  |
| _ROLL_ROT | 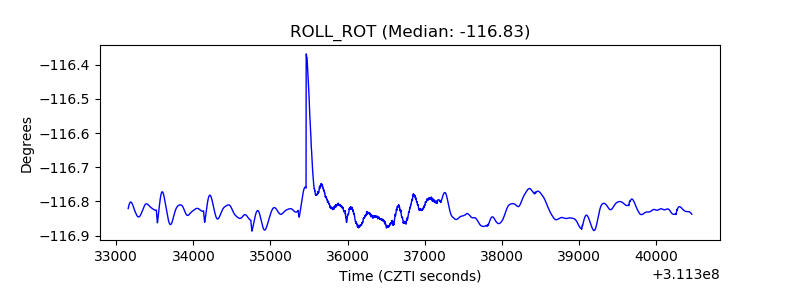 |
| _Roll_DEC | 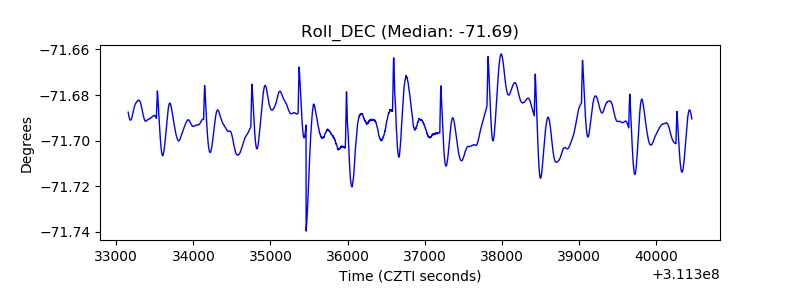 |
| _Roll_RA | 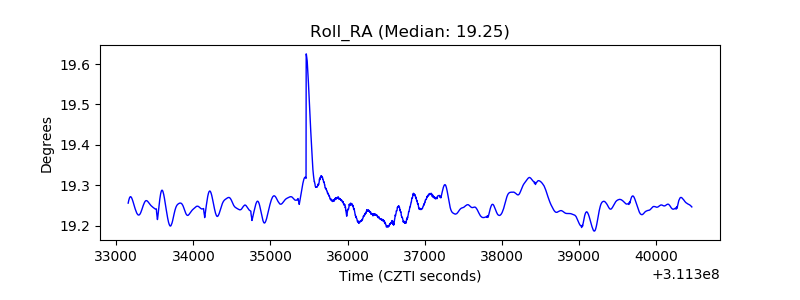 |
| Veto Counter | 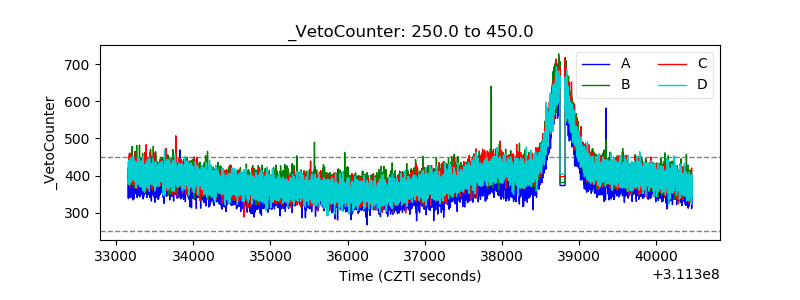 |