| Param | Original file | Final file |
|---|---|---|
| Filename | modeM0/AS1A07_149T01_9000003304cztM0_level2.fits | modeM0/AS1A07_149T01_9000003304cztM0_level2_quad_clean.evt |
| Size (bytes) | 813,363,840 | 675,109,440 |
| Size | 775.7 MB | 643.8 MB |
| Events in quadrant A | 4,996,804 | 3,886,982 |
| Events in quadrant B | 4,861,720 | 3,935,501 |
| Events in quadrant C | 4,957,548 | 3,706,236 |
| Events in quadrant D | 4,309,118 | 3,406,652 |
| Mode SS | |||
|---|---|---|---|
| Quadrant | BADHDUFLAG | Total packets | Discarded packets |
| A | 0 | 1638 | 0 |
| B | 0 | 1638 | 0 |
| C | 0 | 1638 | 0 |
| D | 0 | 1638 | 0 |
| Mode M0 | |||
|---|---|---|---|
| Quadrant | BADHDUFLAG | Total packets | Discarded packets |
| A | 0 | 165860 | 0 |
| B | 0 | 168399 | 0 |
| C | 0 | 166891 | 0 |
| D | 0 | 179661 | 0 |
| Mode M9 | |||
|---|---|---|---|
| Quadrant | BADHDUFLAG | Total packets | Discarded packets |
| A | 0 | 155 | 0 |
| B | 0 | 156 | 0 |
| C | 0 | 156 | 0 |
| D | 0 | 156 | 0 |
| Quadrant | Total seconds | Saturated seconds | Saturation percentage |
|---|---|---|---|
| A | 80336 | 703 | 0.875075% |
| B | 80336 | 928 | 1.155148% |
| C | 80336 | 1151 | 1.432733% |
| D | 80336 | 1099 | 1.368004% |
Noise dominated data is calculated using 1-second bins in cleaned event files. If a bin has >2000 counts, and if more than 50% of those come from <1% of pixels, then it is considered to be noise-dominated and hence unusable.
| Quadrant | # 1 sec bins | Bins with >0 counts | Bins with >2000 counts | High rate bins dominated by noise | Noise dominated (total time) | Noise dominated (detector-on time) | Marked lightcurve |
|---|---|---|---|---|---|---|---|
| A | 107328 | 80330 | 0 | 0 | 0.00% | 0.00% | 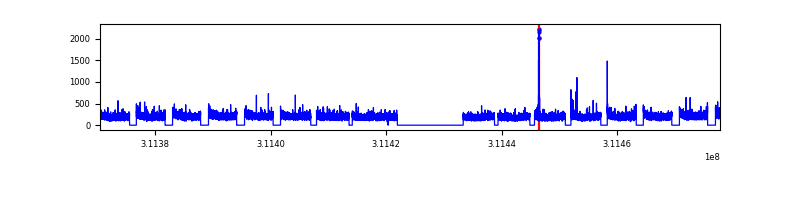 |
| B | 107328 | 80332 | 0 | 0 | 0.00% | 0.00% |  |
| C | 107328 | 80334 | 0 | 0 | 0.00% | 0.00% |  |
| D | 107328 | 80333 | 0 | 0 | 0.00% | 0.00% | 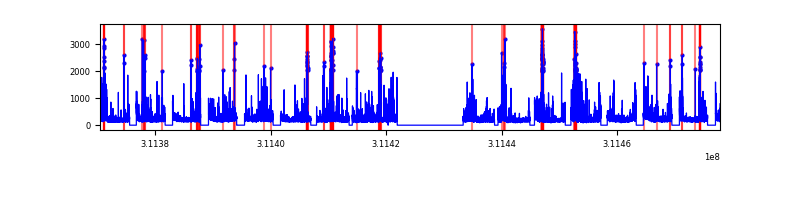 |
Top three noisy pixels from each quadrant. If the there are fewer than three noisy pixels in the level2.evt file, extra rows are filled as -1
| Pixel properties | Quadrant properties | ||||||
|---|---|---|---|---|---|---|---|
| Quadrant | DetID | PixID | Counts | Sigma | Mean | Median | Sigma |
| A | 0 | 29 | 4737 | 10.99 | 1301 | 1228 | 319.2 |
| A | 7 | 110 | 3989 | 8.65 | 1301 | 1228 | 319.2 |
| A | 9 | 19 | 3712 | 7.78 | 1301 | 1228 | 319.2 |
| B | 2 | 9 | 3982 | 10.98 | 1287 | 1234 | 250.2 |
| B | 2 | 8 | 3358 | 8.49 | 1287 | 1234 | 250.2 |
| B | 5 | 128 | 3240 | 8.02 | 1287 | 1234 | 250.2 |
| C | 12 | 241 | 3529 | 6.89 | 1311 | 1234 | 333.2 |
| C | 3 | 234 | 3508 | 6.82 | 1311 | 1234 | 333.2 |
| C | 3 | 126 | 3348 | 6.34 | 1311 | 1234 | 333.2 |
| D | 3 | 14 | 3103 | 6.16 | 1229 | 1124 | 321.3 |
| D | 15 | 46 | 3094 | 6.13 | 1229 | 1124 | 321.3 |
| D | 10 | 189 | 3090 | 6.12 | 1229 | 1124 | 321.3 |
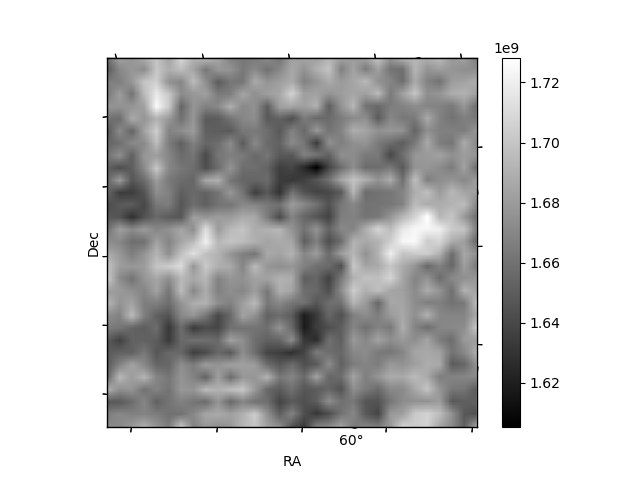
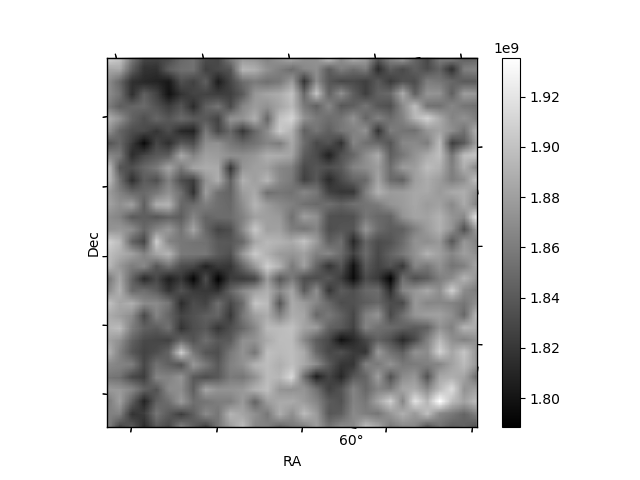
Histogram calculated using DETX and DETY for each event in the final _common_clean file
| Quadrant A | 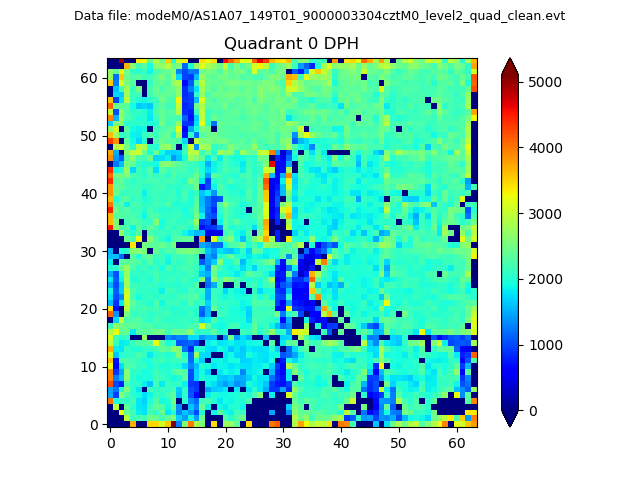 |
 |
Quadrant B |
|---|---|---|---|
| Quadrant D |  |
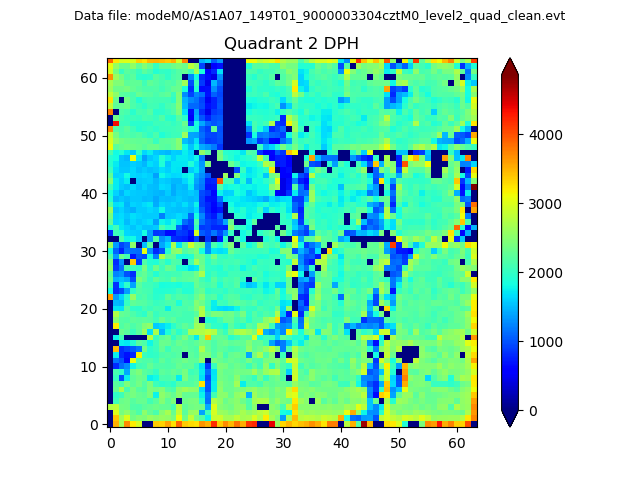 |
Quadrant C |
| Plot type | Count rate plots | Images |
|---|---|---|
| Comparison with Poisson distribution Blue bars denote a histogram of data divided into 1 sec bins. Red curve is a Poisson curve with rate = median count rate of data. |
 |
 |
| Quadrant-wise count rates Data is divided into 100 sec bins |
 |
|
| Module-wise count rates for Quadrant A Data is divided into 100 sec bins |
 |
 |
| Module-wise count rates for Quadrant B Data is divided into 100 sec bins |
 |
 |
| Module-wise count rates for Quadrant C Data is divided into 100 sec bins |
 |
 |
| Module-wise count rates for Quadrant D Data is divided into 100 sec bins |
 |
 |
| Parameter | Plot |
|---|---|
| CZT HV Monitor |  |
| D_VDD |  |
| Temperature 1 |  |
| Veto HV Monitor |  |
| Veto LLD | 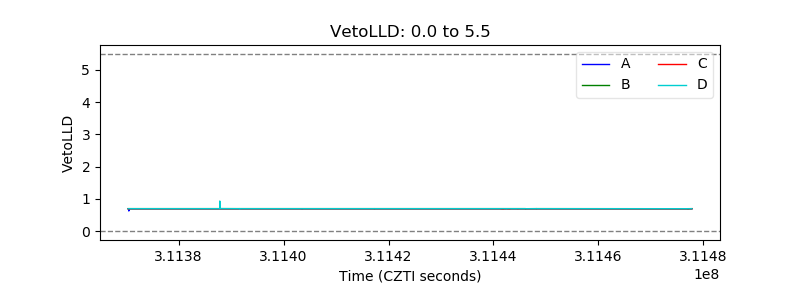 |
| Alpha Counter |  |
| _CPM_Rate |  |
| CZT Counter |  |
| +2.5 Volts monitor | 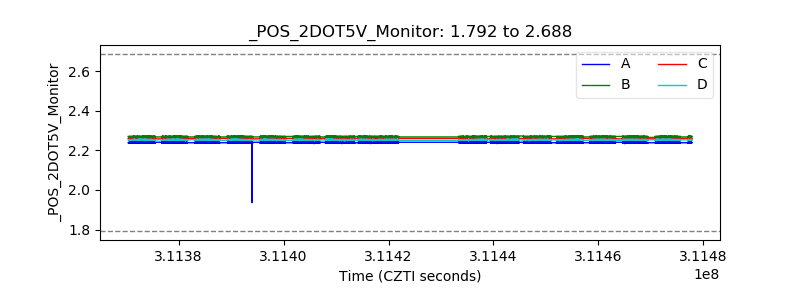 |
| +5 Volts monitor | 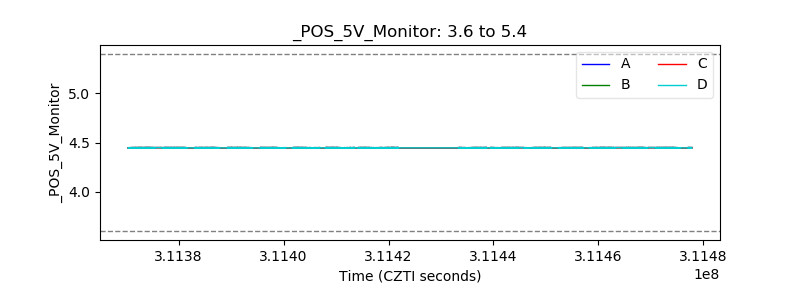 |
| _ROLL_ROT |  |
| _Roll_DEC | 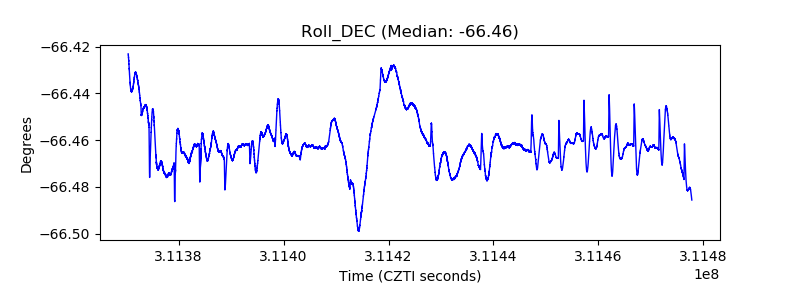 |
| _Roll_RA |  |
| Veto Counter |  |