| Param | Original file | Final file |
|---|---|---|
| Filename | modeM0/AS1A07_149T01_9000003304_22317cztM0_level2.evt | modeM0/AS1A07_149T01_9000003304_22317cztM0_level2_quad_clean.evt |
| Size (bytes) | 446,783,040 | 109,702,080 |
| Size | 426.1 MB | 104.6 MB |
| Events in quadrant A | 3,132,427 | 726,891 |
| Events in quadrant B | 3,218,976 | 752,159 |
| Events in quadrant C | 3,190,028 | 704,308 |
| Events in quadrant D | 3,536,755 | 674,985 |
| Mode SS | |||
|---|---|---|---|
| Quadrant | BADHDUFLAG | Total packets | Discarded packets |
| A | 0 | 136 | 0 |
| B | 0 | 136 | 0 |
| C | 0 | 136 | 0 |
| D | 0 | 136 | 0 |
| Mode M0 | |||
|---|---|---|---|
| Quadrant | BADHDUFLAG | Total packets | Discarded packets |
| A | 0 | 13762 | 2 |
| B | 0 | 13889 | 2 |
| C | 0 | 13742 | 3 |
| D | 0 | 15127 | 2 |
| Mode M9 | |||
|---|---|---|---|
| Quadrant | BADHDUFLAG | Total packets | Discarded packets |
| A | 0 | 12 | 0 |
| B | 0 | 13 | 0 |
| C | 0 | 13 | 0 |
| D | 0 | 13 | 0 |
| Quadrant | Total seconds | Saturated seconds | Saturation percentage |
|---|---|---|---|
| A | 6655 | 29 | 0.435763% |
| B | 6655 | 39 | 0.586026% |
| C | 6654 | 52 | 0.781485% |
| D | 6654 | 96 | 1.442741% |
Noise dominated data is calculated using 1-second bins in cleaned event files. If a bin has >2000 counts, and if more than 50% of those come from <1% of pixels, then it is considered to be noise-dominated and hence unusable.
| Quadrant | # 1 sec bins | Bins with >0 counts | Bins with >2000 counts | High rate bins dominated by noise | Noise dominated (total time) | Noise dominated (detector-on time) | Marked lightcurve |
|---|---|---|---|---|---|---|---|
| A | 7835 | 6656 | 0 | 0 | 0.00% | 0.00% | 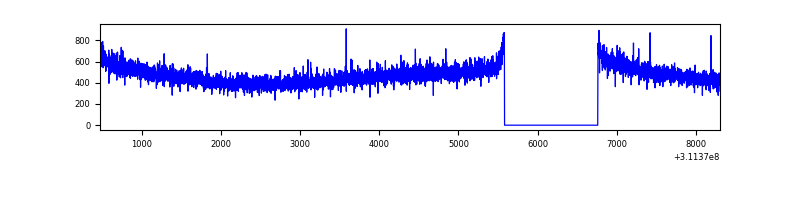 |
| B | 7835 | 6656 | 0 | 0 | 0.00% | 0.00% | 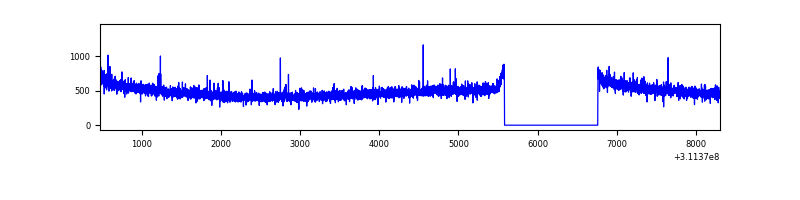 |
| C | 7834 | 6655 | 0 | 0 | 0.00% | 0.00% | 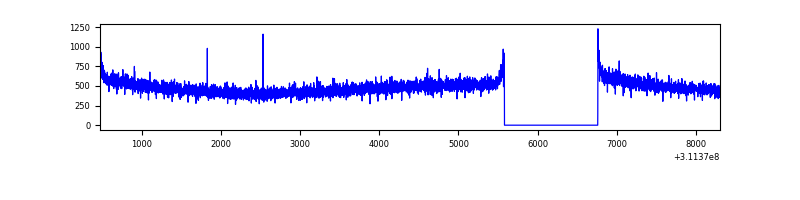 |
| D | 7834 | 6655 | 68 | 68 | 0.87% | 1.02% | 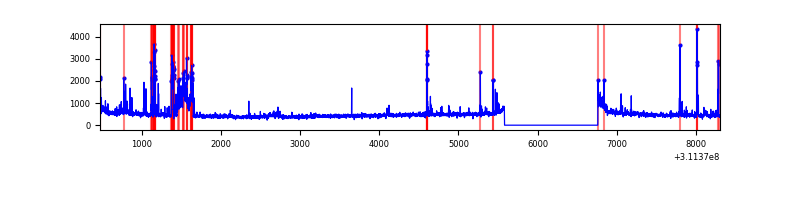 |
Top three noisy pixels from each quadrant. If the there are fewer than three noisy pixels in the level2.evt file, extra rows are filled as -1
| Pixel properties | Quadrant properties | ||||||
|---|---|---|---|---|---|---|---|
| Quadrant | DetID | PixID | Counts | Sigma | Mean | Median | Sigma |
| A | 13 | 254 | 9870 | 55.64 | 812 | 797 | 163.1 |
| A | 0 | 226 | 7007 | 38.08 | 812 | 797 | 163.1 |
| A | 3 | 137 | 6927 | 37.59 | 812 | 797 | 163.1 |
| B | 12 | 111 | 18521 | 115.3 | 821 | 801 | 153.7 |
| B | 11 | 111 | 16313 | 100.93 | 821 | 801 | 153.7 |
| B | 14 | 111 | 14613 | 89.87 | 821 | 801 | 153.7 |
| C | 14 | 238 | 127426 | 691.68 | 784 | 789 | 183.1 |
| C | 0 | 10 | 7836 | 38.49 | 784 | 789 | 183.1 |
| C | 13 | 61 | 5505 | 25.76 | 784 | 789 | 183.1 |
| D | 13 | 174 | 317886 | 1689.48 | 777 | 753 | 187.7 |
| D | 1 | 52 | 111684 | 590.97 | 777 | 753 | 187.7 |
| D | 12 | 217 | 53364 | 280.28 | 777 | 753 | 187.7 |
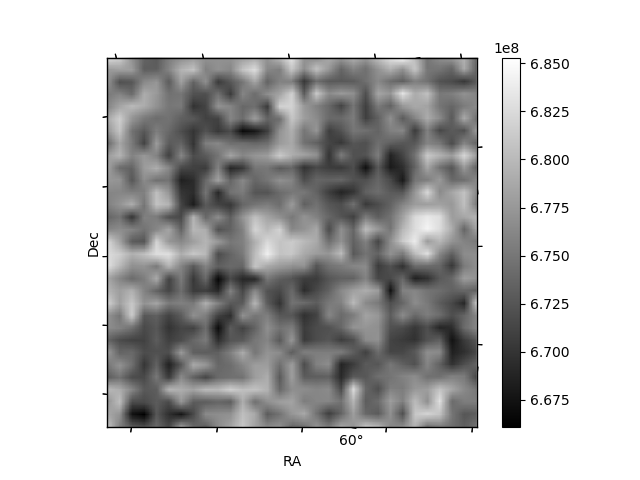
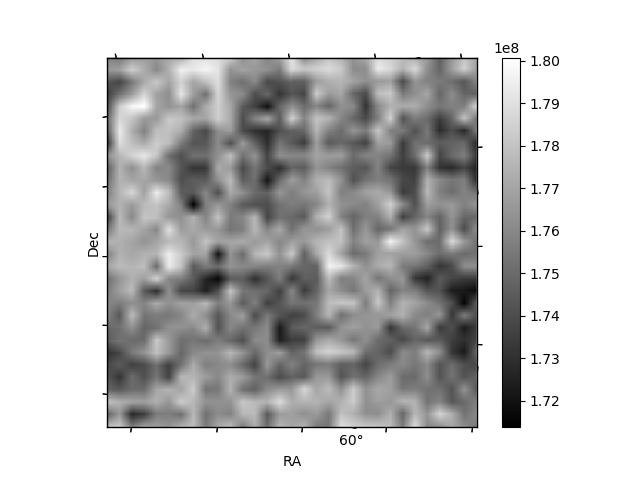
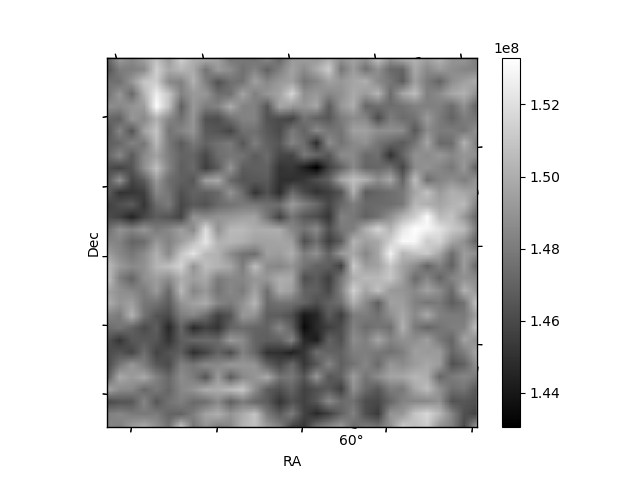
Histogram calculated using DETX and DETY for each event in the final _common_clean file
| Quadrant A | 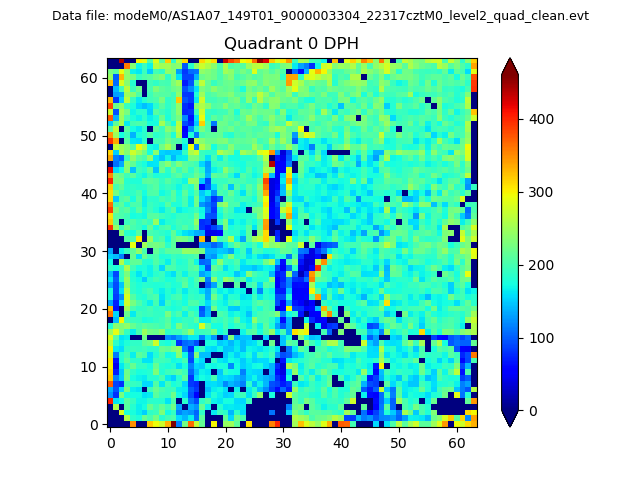 |
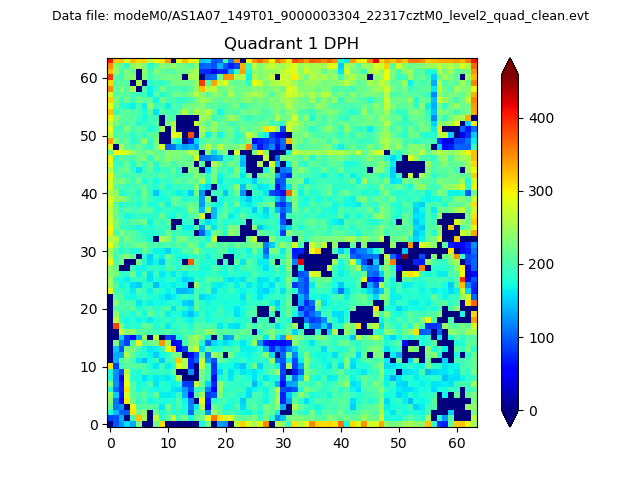 |
Quadrant B |
|---|---|---|---|
| Quadrant D | 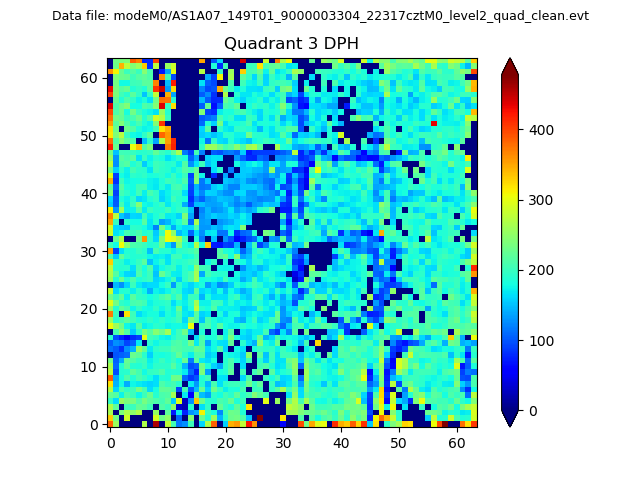 |
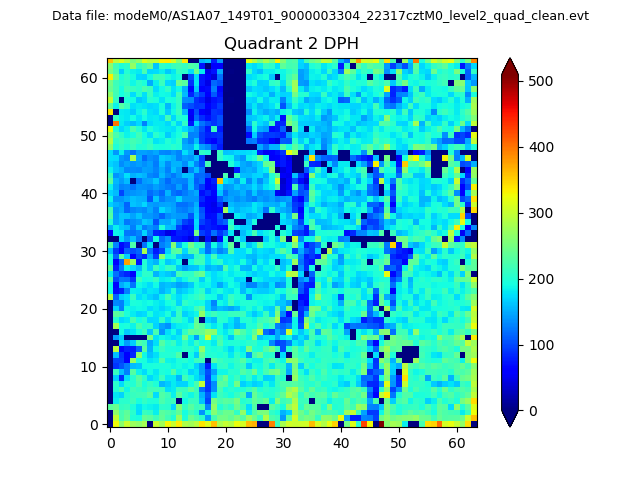 |
Quadrant C |
| Plot type | Count rate plots | Images |
|---|---|---|
| Comparison with Poisson distribution Blue bars denote a histogram of data divided into 1 sec bins. Red curve is a Poisson curve with rate = median count rate of data. |
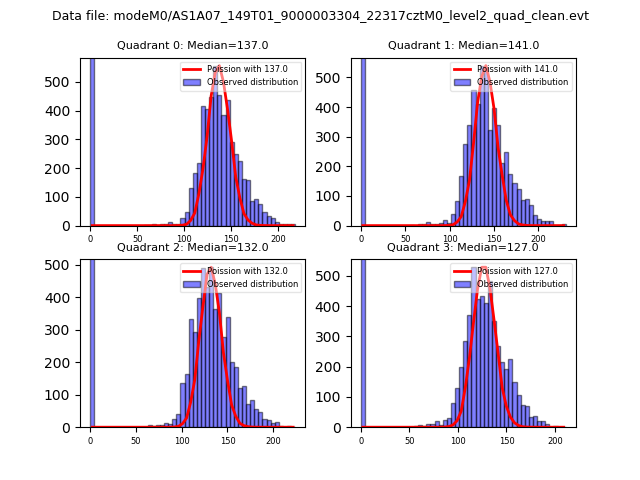 |
 |
| Quadrant-wise count rates Data is divided into 100 sec bins |
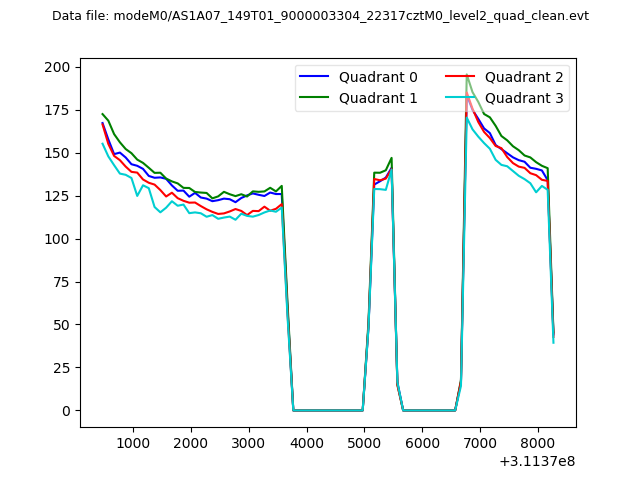 |
|
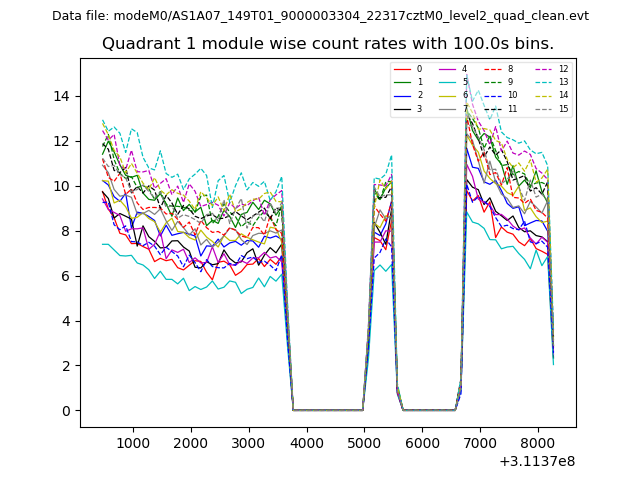
| Module-wise count rates for Quadrant A Data is divided into 100 sec bins |
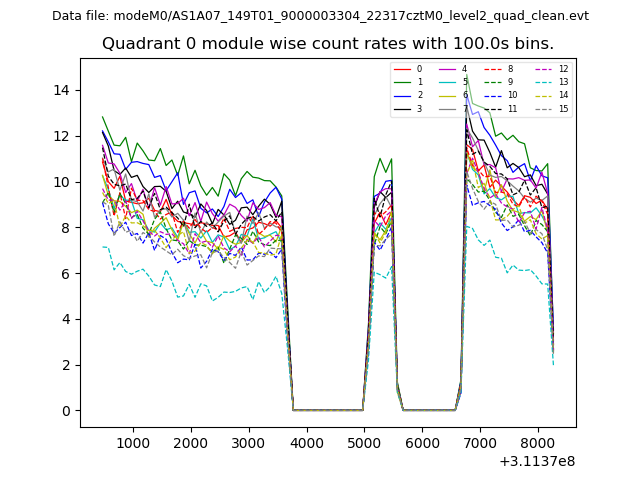 |
 |
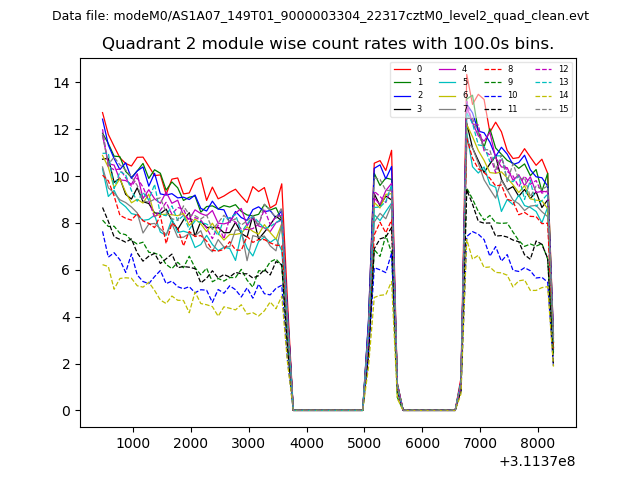
| Module-wise count rates for Quadrant B Data is divided into 100 sec bins |
 |
 |
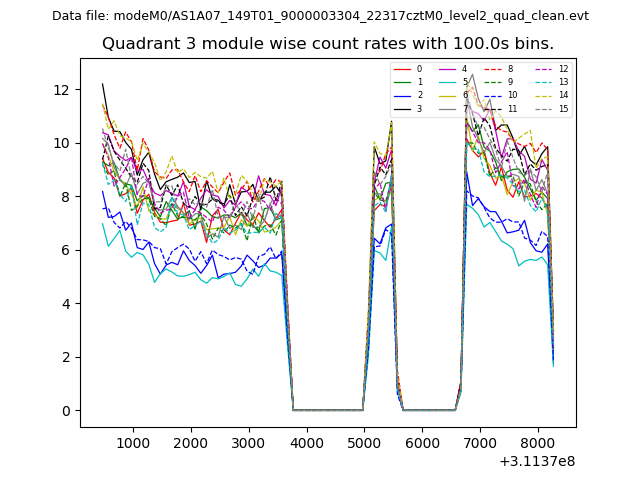
| Module-wise count rates for Quadrant C Data is divided into 100 sec bins |
 |
 |
| Module-wise count rates for Quadrant D Data is divided into 100 sec bins |
 |
 |
| Parameter | Plot |
|---|---|
| CZT HV Monitor | 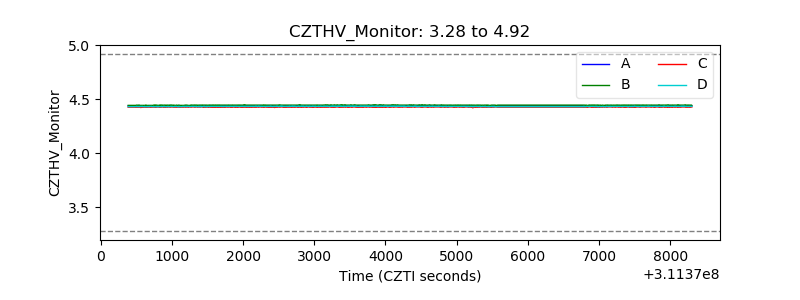 |
| D_VDD | 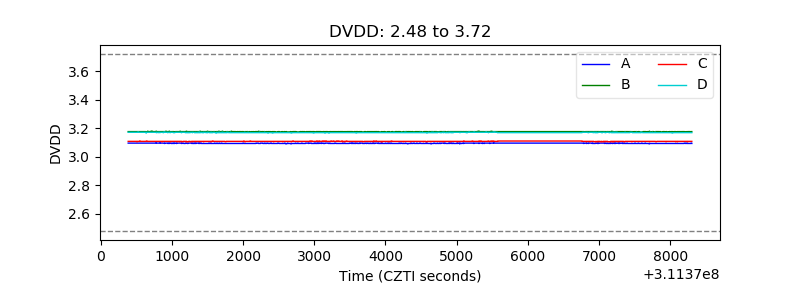 |
| Temperature 1 | 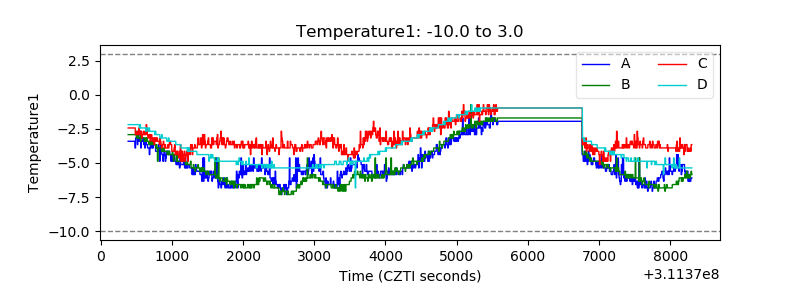 |
| Veto HV Monitor | 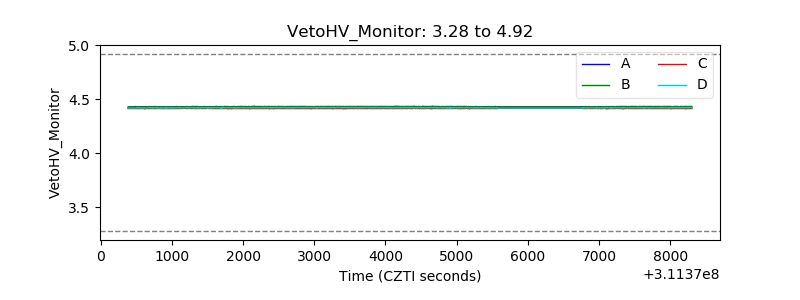 |
| Veto LLD | 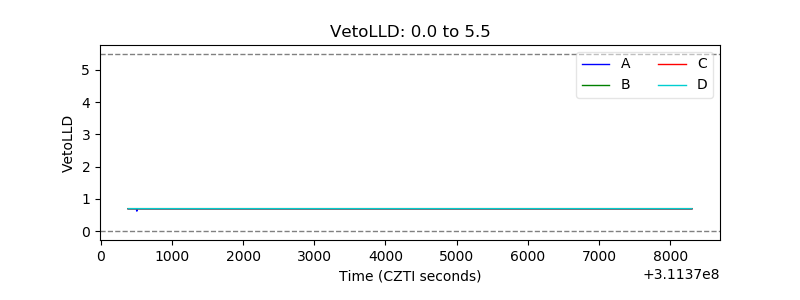 |
| Alpha Counter | 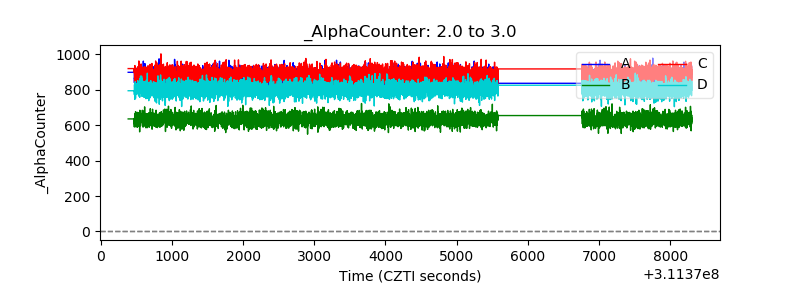 |
| _CPM_Rate | 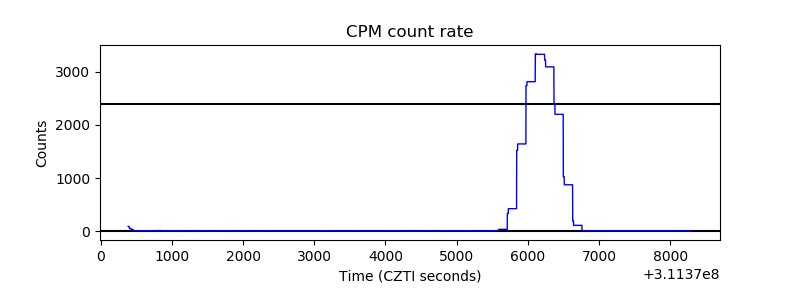 |
| CZT Counter | 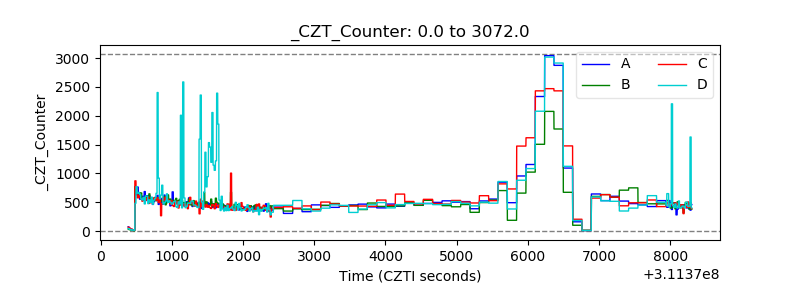 |
| +2.5 Volts monitor | 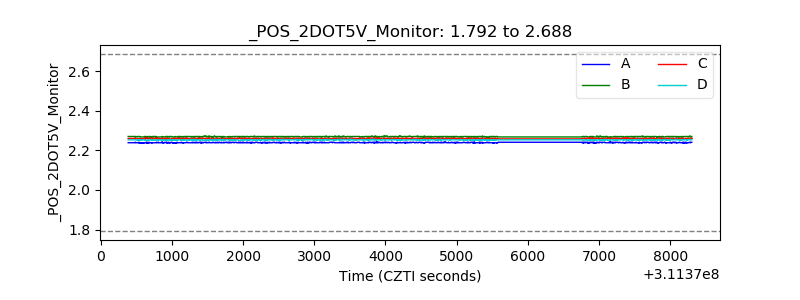 |
| +5 Volts monitor |  |
| _ROLL_ROT | 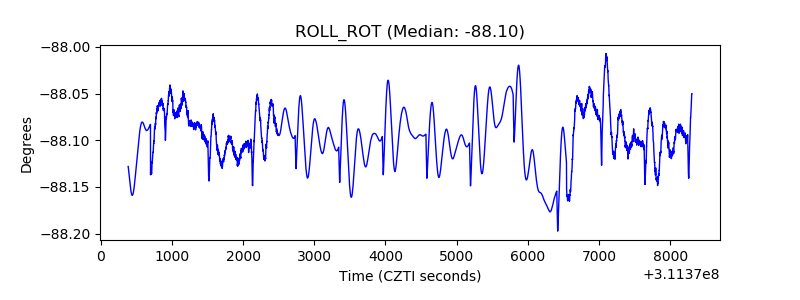 |
| _Roll_DEC | 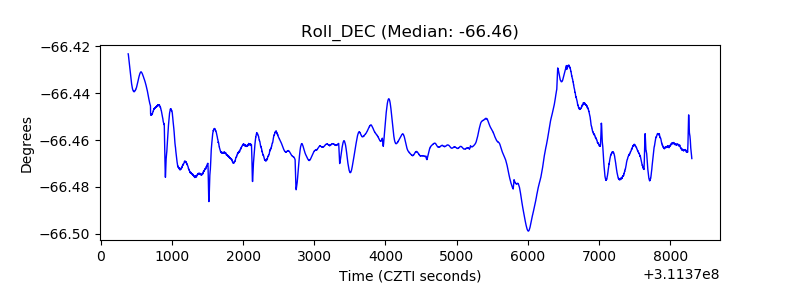 |
| _Roll_RA |  |
| Veto Counter | 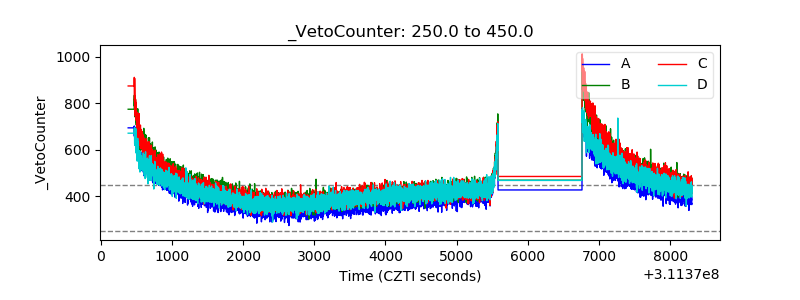 |