| Param | Original file | Final file |
|---|---|---|
| Filename | modeM0/AS1A07_149T01_9000003304_22318cztM0_level2.evt | modeM0/AS1A07_149T01_9000003304_22318cztM0_level2_quad_clean.evt |
| Size (bytes) | 445,256,640 | 114,514,560 |
| Size | 424.6 MB | 109.2 MB |
| Events in quadrant A | 3,167,878 | 758,693 |
| Events in quadrant B | 3,274,322 | 792,912 |
| Events in quadrant C | 3,285,516 | 746,645 |
| Events in quadrant D | 3,314,858 | 716,350 |
| Mode SS | |||
|---|---|---|---|
| Quadrant | BADHDUFLAG | Total packets | Discarded packets |
| A | 0 | 132 | 0 |
| B | 0 | 132 | 0 |
| C | 0 | 132 | 0 |
| D | 0 | 132 | 0 |
| Mode M0 | |||
|---|---|---|---|
| Quadrant | BADHDUFLAG | Total packets | Discarded packets |
| A | 0 | 13570 | 2 |
| B | 0 | 13798 | 2 |
| C | 0 | 13726 | 2 |
| D | 0 | 14109 | 2 |
| Mode M9 | |||
|---|---|---|---|
| Quadrant | BADHDUFLAG | Total packets | Discarded packets |
| A | 0 | 17 | 0 |
| B | 0 | 18 | 0 |
| C | 0 | 18 | 0 |
| D | 0 | 18 | 0 |
| Quadrant | Total seconds | Saturated seconds | Saturation percentage |
|---|---|---|---|
| A | 6505 | 30 | 0.461184% |
| B | 6505 | 42 | 0.645657% |
| C | 6505 | 64 | 0.983859% |
| D | 6505 | 32 | 0.491929% |
Noise dominated data is calculated using 1-second bins in cleaned event files. If a bin has >2000 counts, and if more than 50% of those come from <1% of pixels, then it is considered to be noise-dominated and hence unusable.
| Quadrant | # 1 sec bins | Bins with >0 counts | Bins with >2000 counts | High rate bins dominated by noise | Noise dominated (total time) | Noise dominated (detector-on time) | Marked lightcurve |
|---|---|---|---|---|---|---|---|
| A | 7800 | 6506 | 0 | 0 | 0.00% | 0.00% | 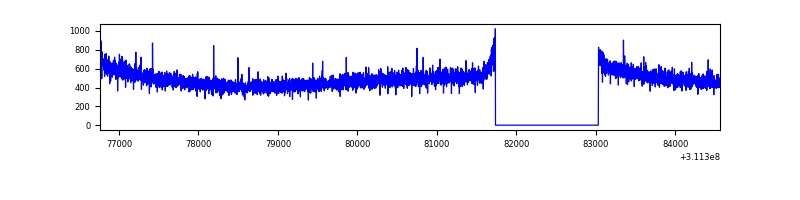 |
| B | 7800 | 6506 | 0 | 0 | 0.00% | 0.00% | 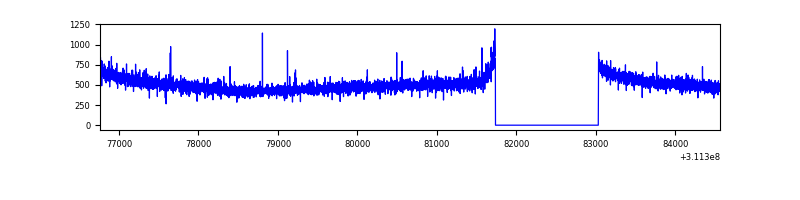 |
| C | 7800 | 6505 | 0 | 0 | 0.00% | 0.00% | 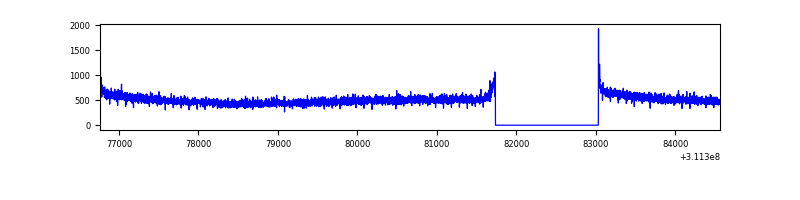 |
| D | 7800 | 6506 | 12 | 12 | 0.15% | 0.18% | 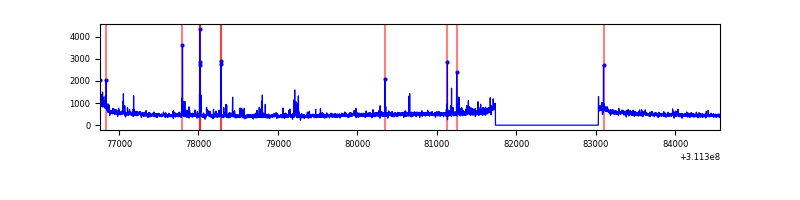 |
Top three noisy pixels from each quadrant. If the there are fewer than three noisy pixels in the level2.evt file, extra rows are filled as -1
| Pixel properties | Quadrant properties | ||||||
|---|---|---|---|---|---|---|---|
| Quadrant | DetID | PixID | Counts | Sigma | Mean | Median | Sigma |
| A | 13 | 254 | 9074 | 50.47 | 822 | 806 | 163.8 |
| A | 0 | 226 | 7040 | 38.05 | 822 | 806 | 163.8 |
| A | 3 | 137 | 6724 | 36.12 | 822 | 806 | 163.8 |
| B | 12 | 111 | 18227 | 112.58 | 835 | 817 | 154.6 |
| B | 11 | 111 | 15865 | 97.31 | 835 | 817 | 154.6 |
| B | 14 | 111 | 14721 | 89.91 | 835 | 817 | 154.6 |
| C | 14 | 238 | 130516 | 698.73 | 805 | 810 | 185.6 |
| C | 0 | 10 | 12912 | 65.19 | 805 | 810 | 185.6 |
| C | 13 | 61 | 5696 | 26.32 | 805 | 810 | 185.6 |
| D | 1 | 52 | 159156 | 828.97 | 800 | 779 | 191.1 |
| D | 11 | 66 | 47848 | 246.37 | 800 | 779 | 191.1 |
| D | 2 | 136 | 30309 | 154.56 | 800 | 779 | 191.1 |
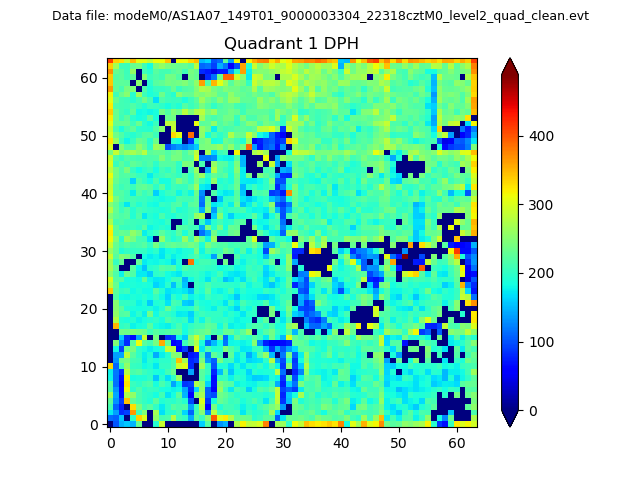
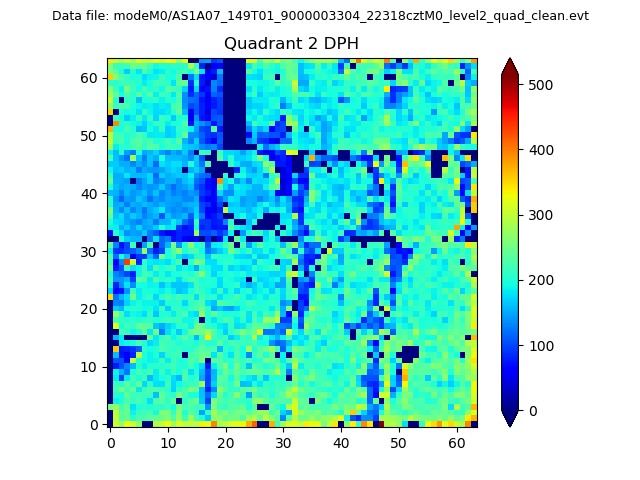
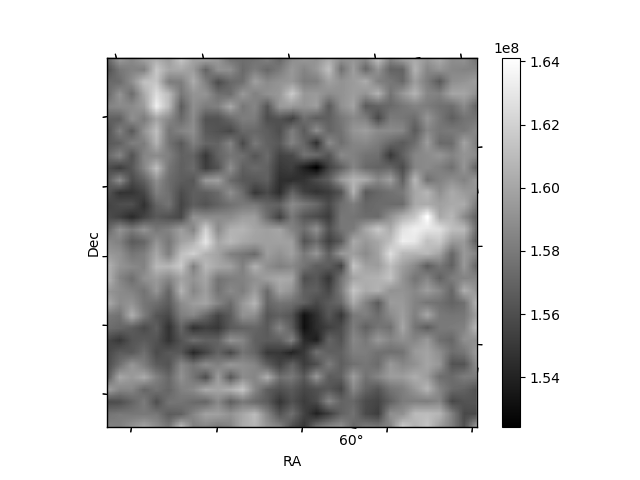
Histogram calculated using DETX and DETY for each event in the final _common_clean file
| Quadrant A |  |
 |
Quadrant B |
|---|---|---|---|
| Quadrant D |  |
 |
Quadrant C |
| Plot type | Count rate plots | Images |
|---|---|---|
| Comparison with Poisson distribution Blue bars denote a histogram of data divided into 1 sec bins. Red curve is a Poisson curve with rate = median count rate of data. |
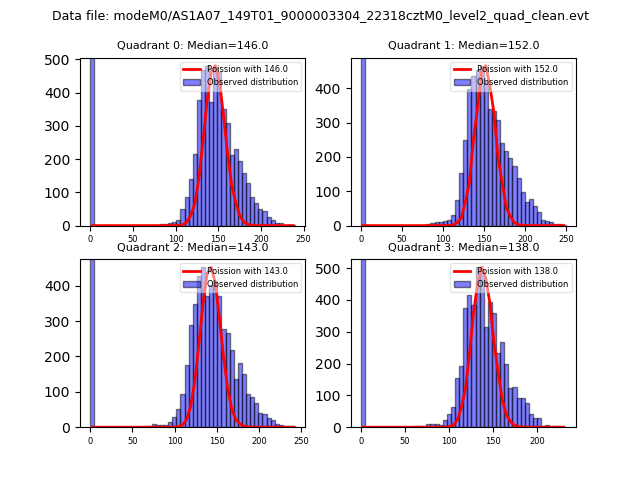 |
 |
| Quadrant-wise count rates Data is divided into 100 sec bins |
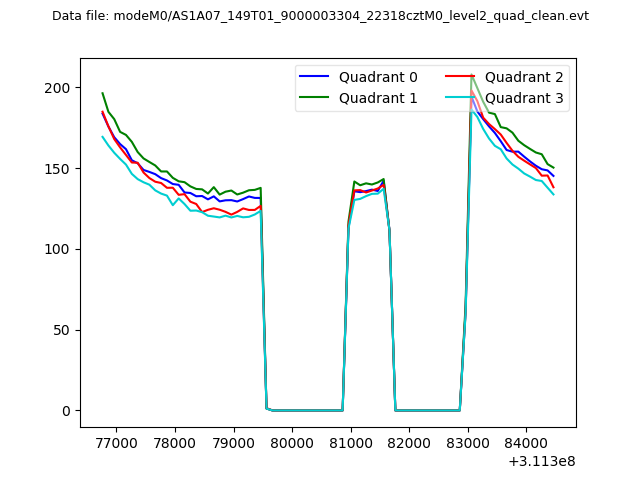 |
|
| Module-wise count rates for Quadrant A Data is divided into 100 sec bins |
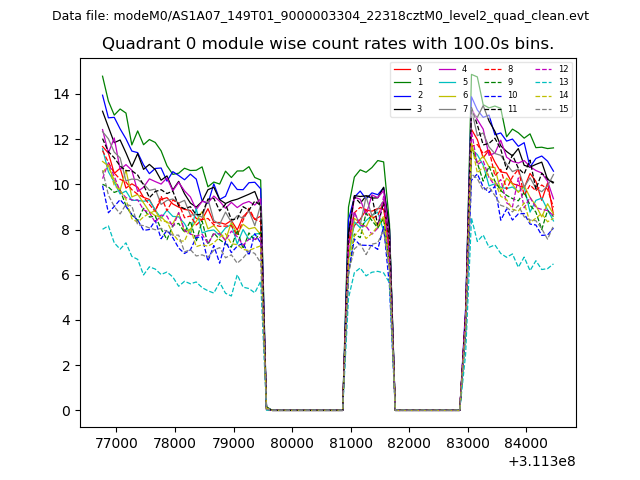 |
 |
| Module-wise count rates for Quadrant B Data is divided into 100 sec bins |
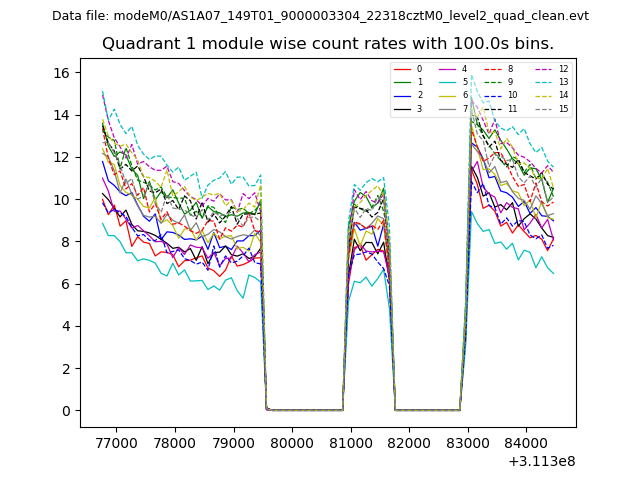 |
 |
| Module-wise count rates for Quadrant C Data is divided into 100 sec bins |
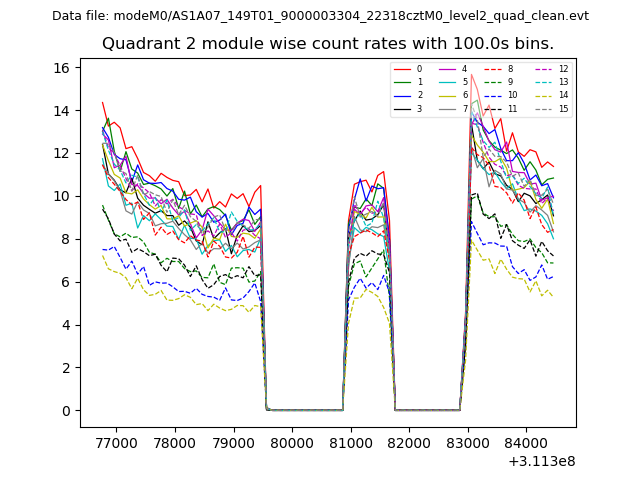 |
 |
| Module-wise count rates for Quadrant D Data is divided into 100 sec bins |
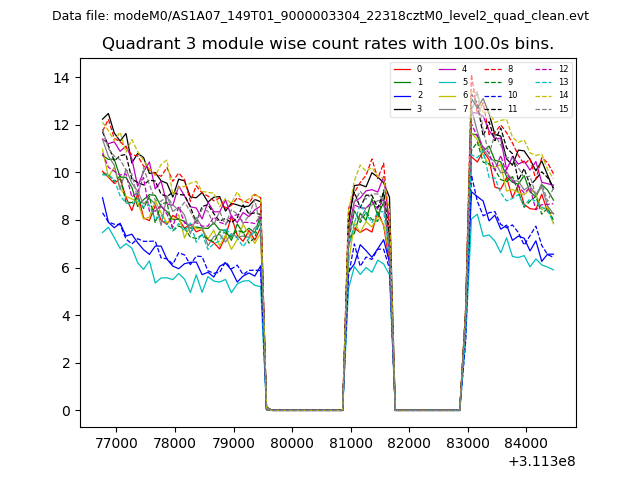 |
 |
| Parameter | Plot |
|---|---|
| CZT HV Monitor | 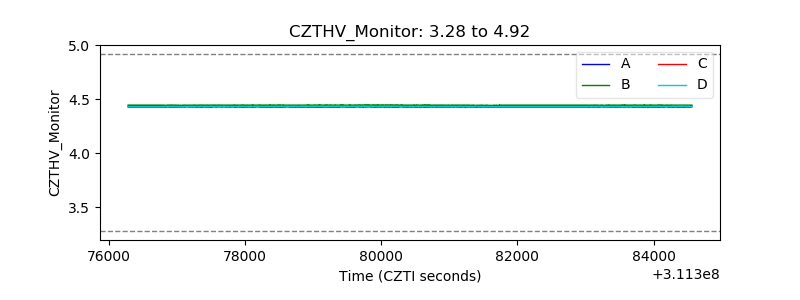 |
| D_VDD | 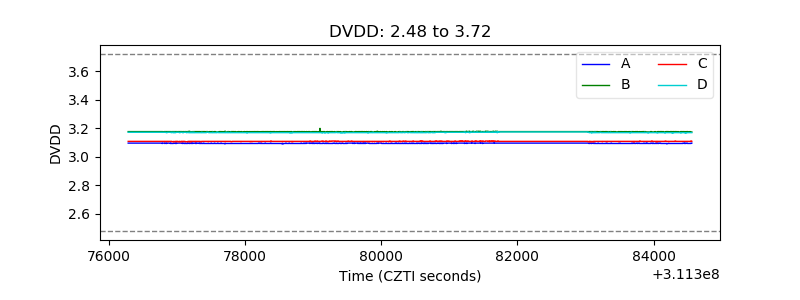 |
| Temperature 1 | 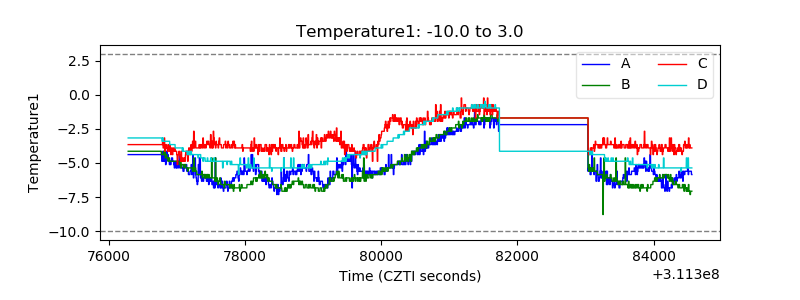 |
| Veto HV Monitor | 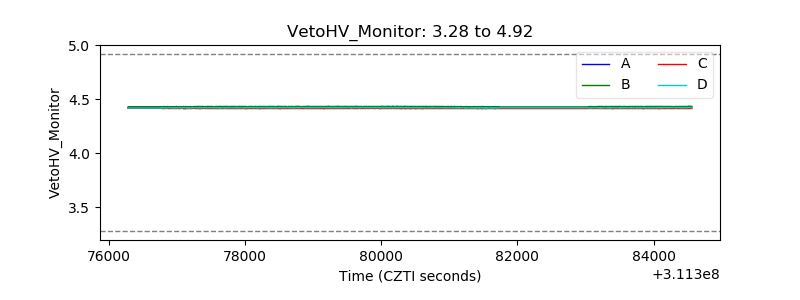 |
| Veto LLD | 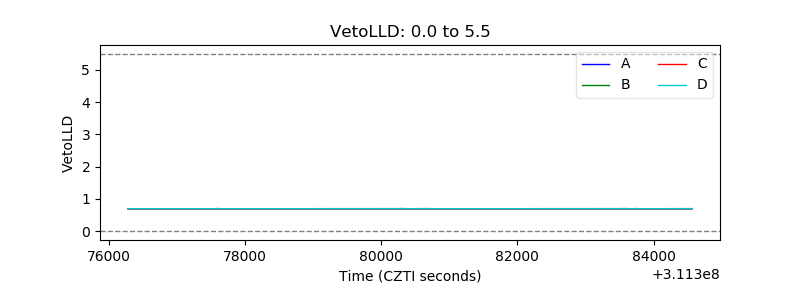 |
| Alpha Counter | 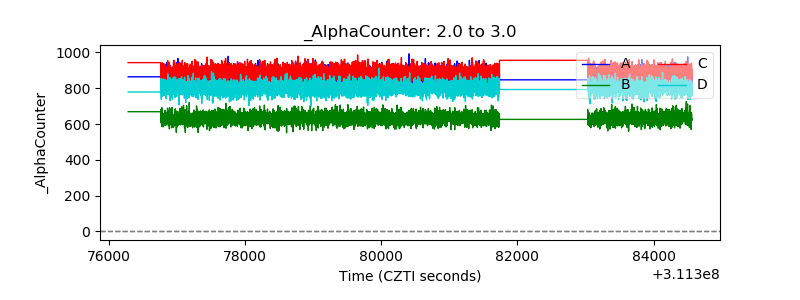 |
| _CPM_Rate | 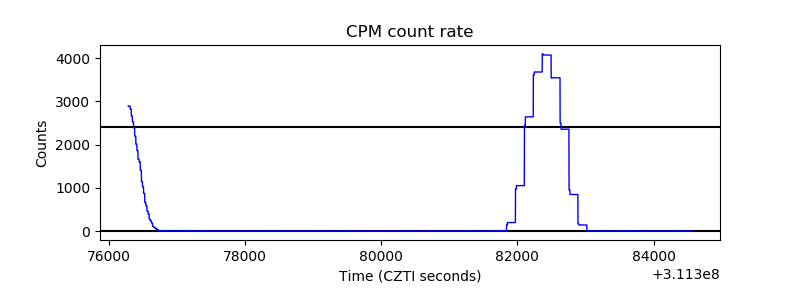 |
| CZT Counter | 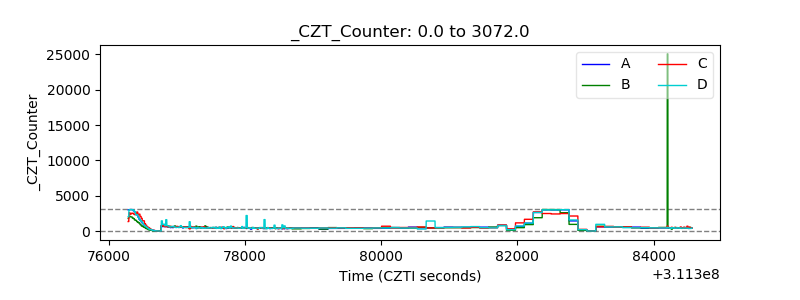 |
| +2.5 Volts monitor | 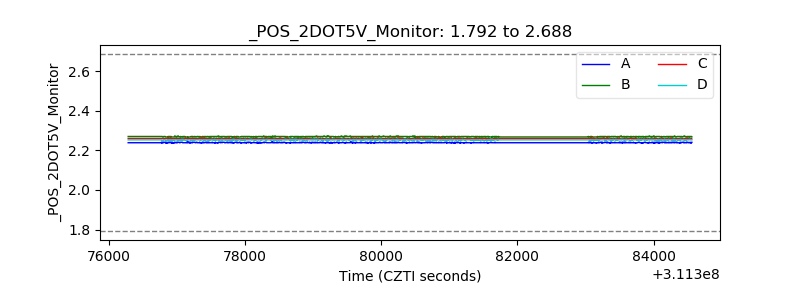 |
| +5 Volts monitor |  |
| _ROLL_ROT | 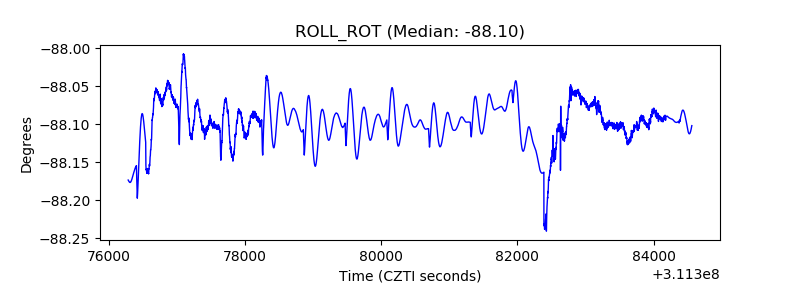 |
| _Roll_DEC | 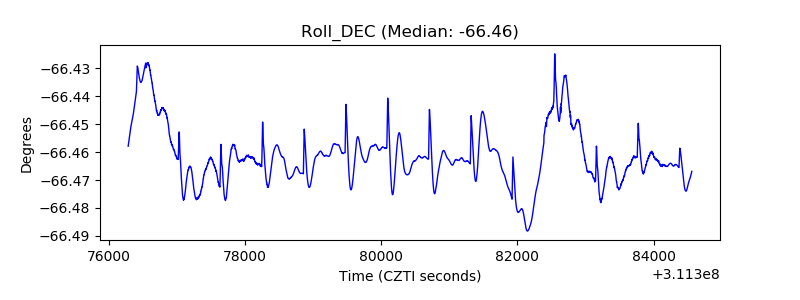 |
| _Roll_RA | 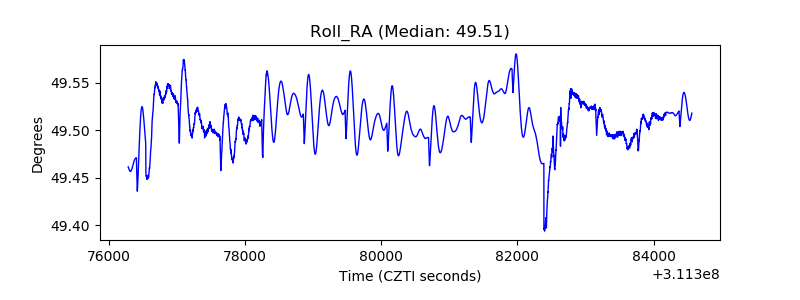 |
| Veto Counter | 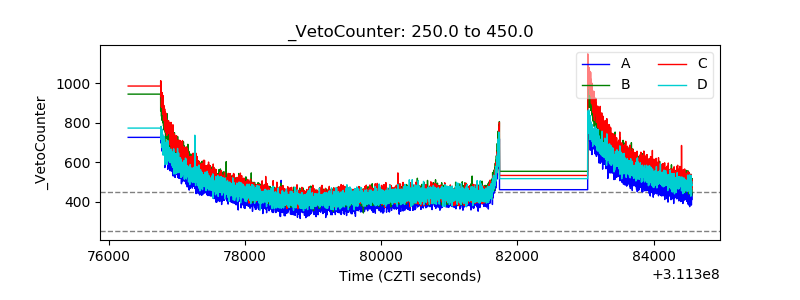 |