| Param | Original file | Final file |
|---|---|---|
| Filename | modeM0/AS1A07_149T01_9000003304_22319cztM0_level2.evt | modeM0/AS1A07_149T01_9000003304_22319cztM0_level2_quad_clean.evt |
| Size (bytes) | 456,799,680 | 117,763,200 |
| Size | 435.6 MB | 112.3 MB |
| Events in quadrant A | 3,203,342 | 781,889 |
| Events in quadrant B | 3,318,072 | 822,308 |
| Events in quadrant C | 3,359,388 | 778,683 |
| Events in quadrant D | 3,520,652 | 739,260 |
| Mode SS | |||
|---|---|---|---|
| Quadrant | BADHDUFLAG | Total packets | Discarded packets |
| A | 0 | 128 | 0 |
| B | 0 | 128 | 0 |
| C | 0 | 128 | 0 |
| D | 0 | 128 | 0 |
| Mode M0 | |||
|---|---|---|---|
| Quadrant | BADHDUFLAG | Total packets | Discarded packets |
| A | 0 | 13373 | 2 |
| B | 0 | 13670 | 2 |
| C | 0 | 13723 | 2 |
| D | 0 | 14598 | 2 |
| Mode M9 | |||
|---|---|---|---|
| Quadrant | BADHDUFLAG | Total packets | Discarded packets |
| A | 0 | 22 | 0 |
| B | 0 | 23 | 0 |
| C | 0 | 23 | 0 |
| D | 0 | 23 | 0 |
| Quadrant | Total seconds | Saturated seconds | Saturation percentage |
|---|---|---|---|
| A | 6377 | 11 | 0.172495% |
| B | 6377 | 32 | 0.501803% |
| C | 6377 | 48 | 0.752705% |
| D | 6377 | 96 | 1.505410% |
Noise dominated data is calculated using 1-second bins in cleaned event files. If a bin has >2000 counts, and if more than 50% of those come from <1% of pixels, then it is considered to be noise-dominated and hence unusable.
| Quadrant | # 1 sec bins | Bins with >0 counts | Bins with >2000 counts | High rate bins dominated by noise | Noise dominated (total time) | Noise dominated (detector-on time) | Marked lightcurve |
|---|---|---|---|---|---|---|---|
| A | 7747 | 6378 | 0 | 0 | 0.00% | 0.00% | 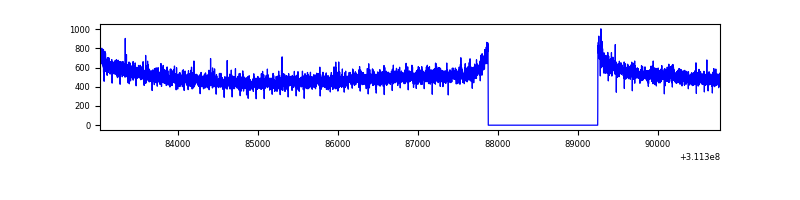 |
| B | 7747 | 6378 | 0 | 0 | 0.00% | 0.00% |  |
| C | 7747 | 6378 | 0 | 0 | 0.00% | 0.00% |  |
| D | 7747 | 6378 | 64 | 64 | 0.83% | 1.00% | 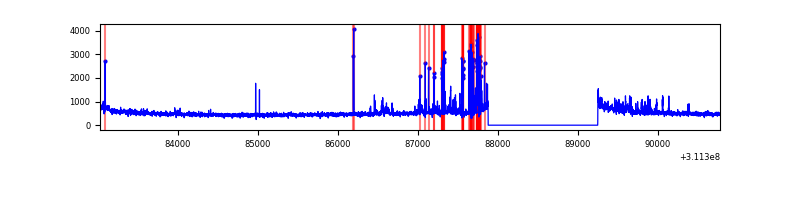 |
Top three noisy pixels from each quadrant. If the there are fewer than three noisy pixels in the level2.evt file, extra rows are filled as -1
| Pixel properties | Quadrant properties | ||||||
|---|---|---|---|---|---|---|---|
| Quadrant | DetID | PixID | Counts | Sigma | Mean | Median | Sigma |
| A | 13 | 254 | 9109 | 50.55 | 831 | 817 | 164.0 |
| A | 0 | 226 | 7148 | 38.6 | 831 | 817 | 164.0 |
| A | 3 | 137 | 6530 | 34.83 | 831 | 817 | 164.0 |
| B | 12 | 111 | 17703 | 108.68 | 846 | 829 | 155.3 |
| B | 11 | 111 | 15602 | 95.15 | 846 | 829 | 155.3 |
| B | 14 | 111 | 14612 | 88.77 | 846 | 829 | 155.3 |
| C | 14 | 238 | 133109 | 698.9 | 825 | 831 | 189.3 |
| C | 0 | 10 | 10807 | 52.71 | 825 | 831 | 189.3 |
| C | 13 | 61 | 5693 | 25.69 | 825 | 831 | 189.3 |
| D | 1 | 52 | 314315 | 1606.54 | 811 | 788 | 195.2 |
| D | 13 | 174 | 49756 | 250.92 | 811 | 788 | 195.2 |
| D | 2 | 136 | 35874 | 179.78 | 811 | 788 | 195.2 |
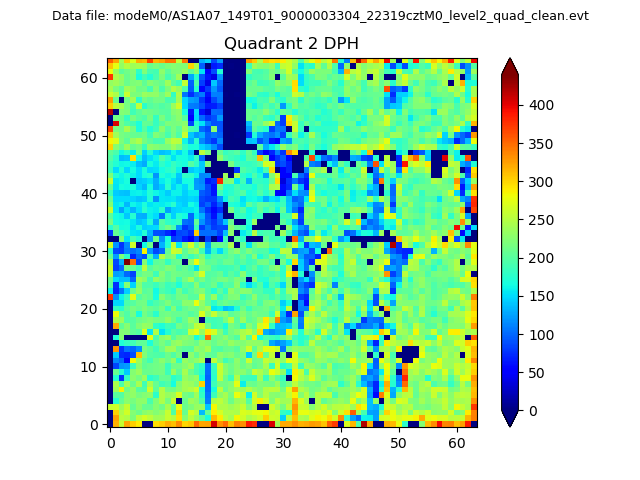
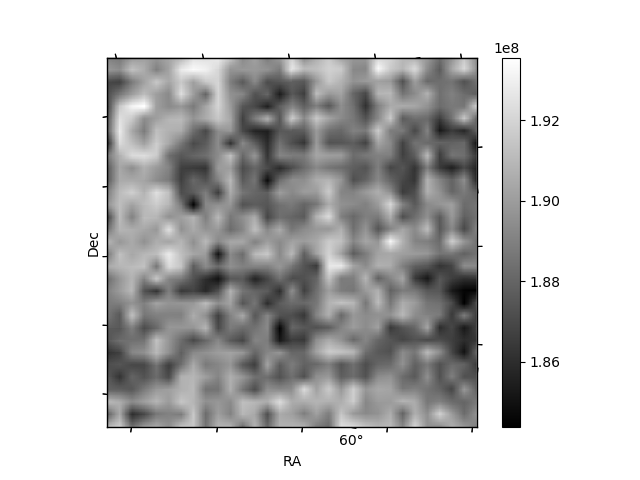
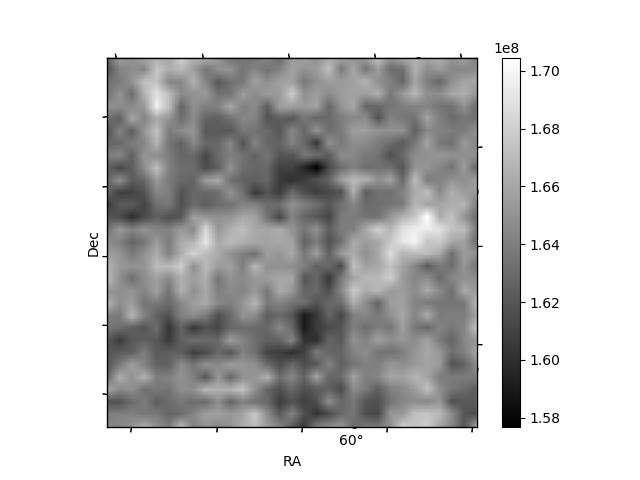
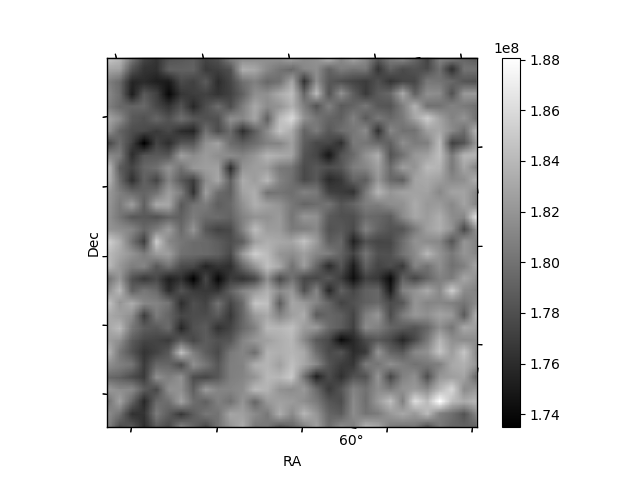
Histogram calculated using DETX and DETY for each event in the final _common_clean file
| Quadrant A | 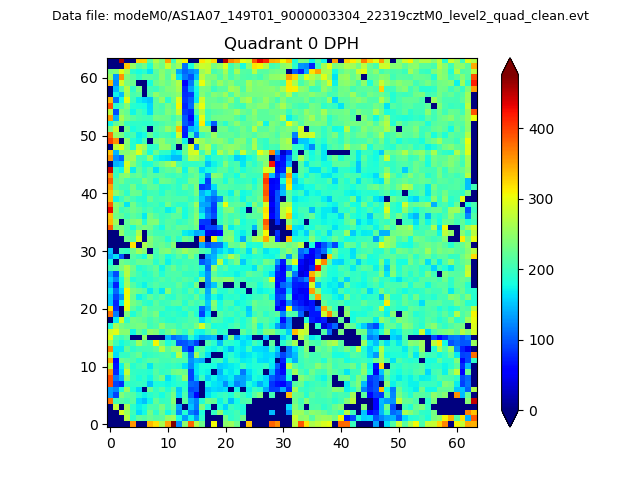 |
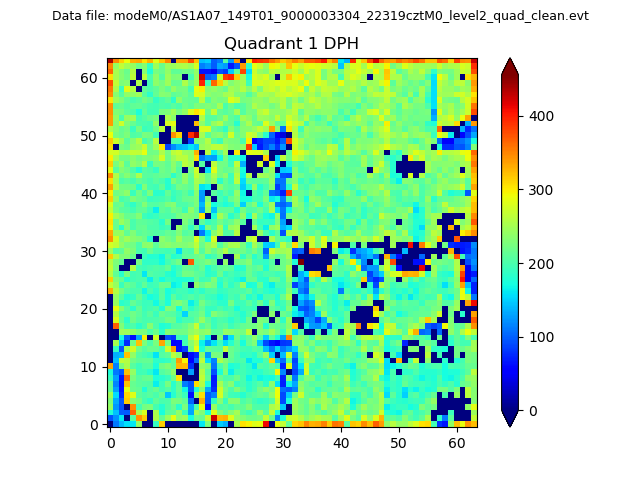 |
Quadrant B |
|---|---|---|---|
| Quadrant D | 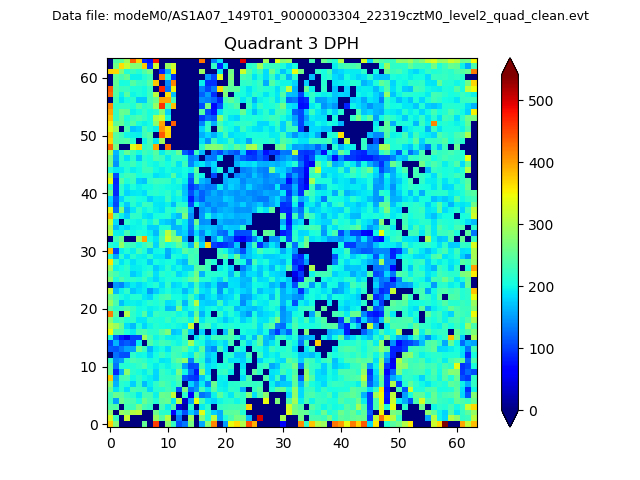 |
 |
Quadrant C |
| Plot type | Count rate plots | Images |
|---|---|---|
| Comparison with Poisson distribution Blue bars denote a histogram of data divided into 1 sec bins. Red curve is a Poisson curve with rate = median count rate of data. |
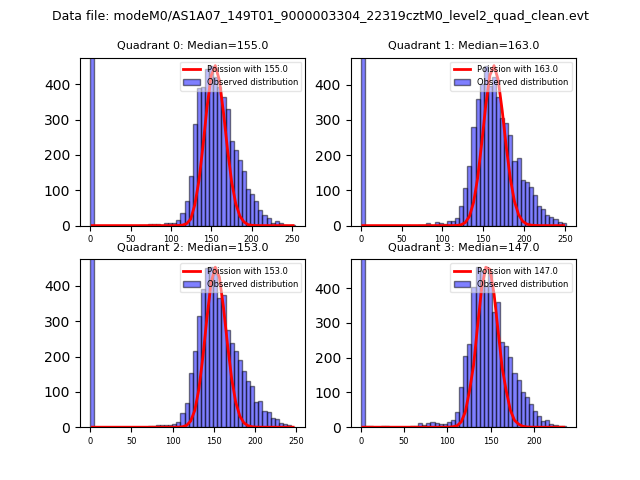 |
 |
| Quadrant-wise count rates Data is divided into 100 sec bins |
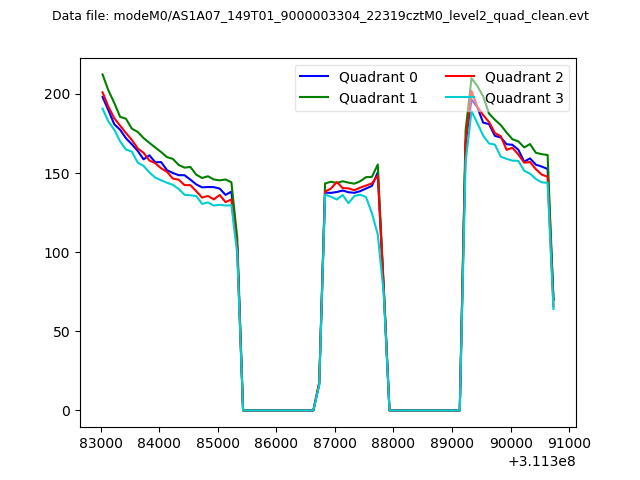 |
|
| Module-wise count rates for Quadrant A Data is divided into 100 sec bins |
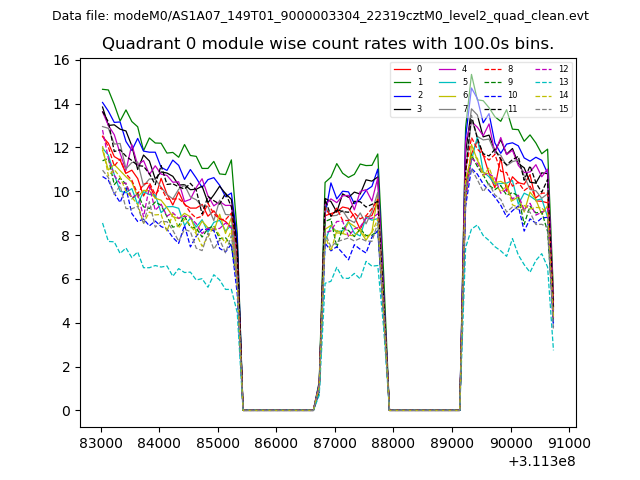 |
 |
| Module-wise count rates for Quadrant B Data is divided into 100 sec bins |
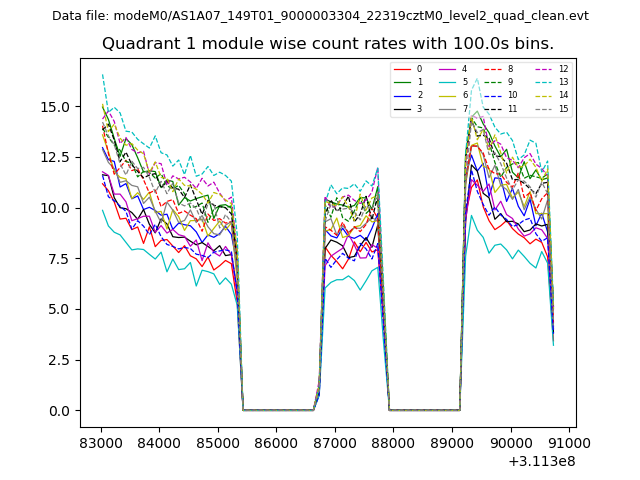 |
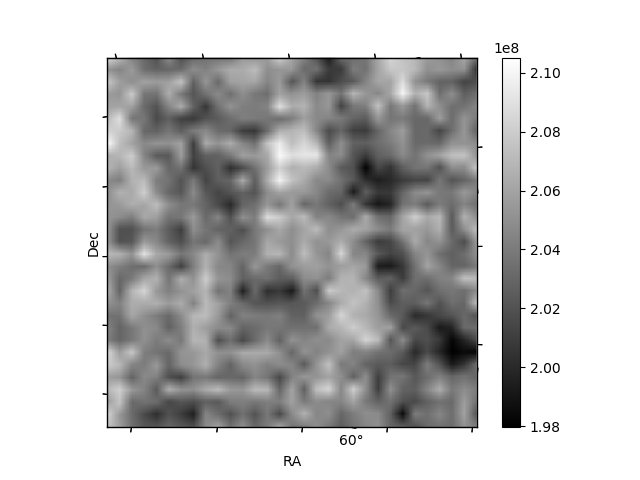 |
| Module-wise count rates for Quadrant C Data is divided into 100 sec bins |
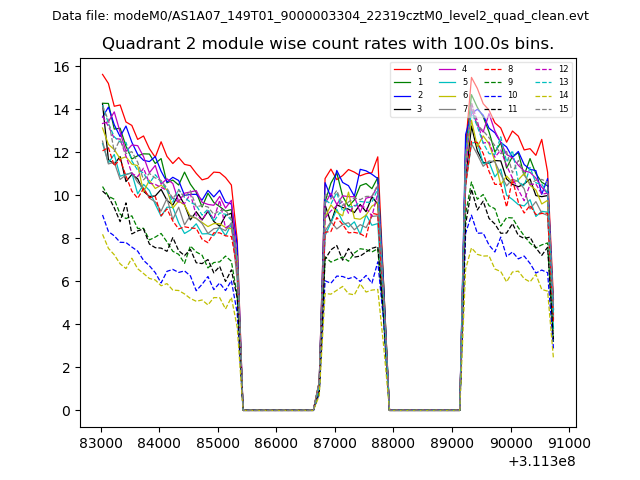 |
 |
| Module-wise count rates for Quadrant D Data is divided into 100 sec bins |
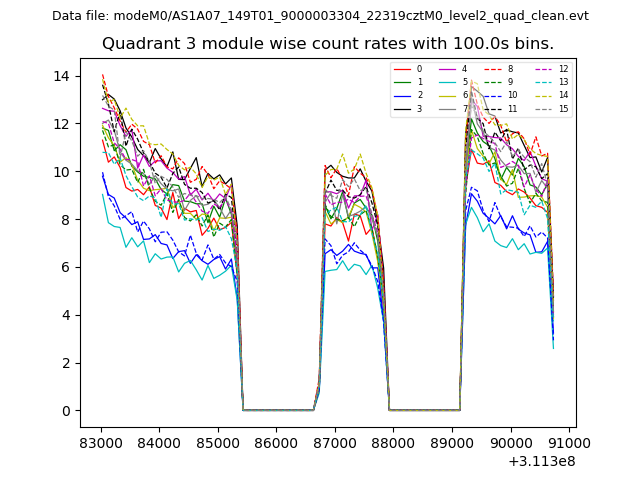 |
 |
| Parameter | Plot |
|---|---|
| CZT HV Monitor | 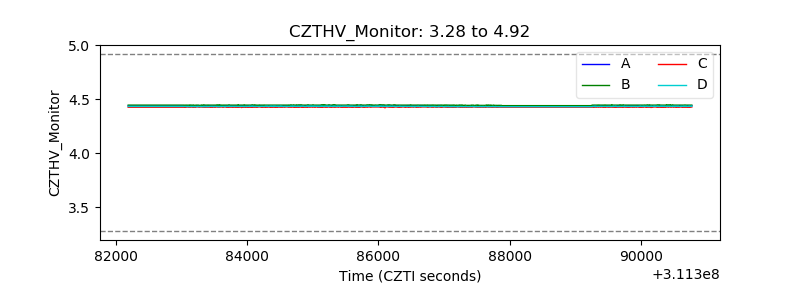 |
| D_VDD | 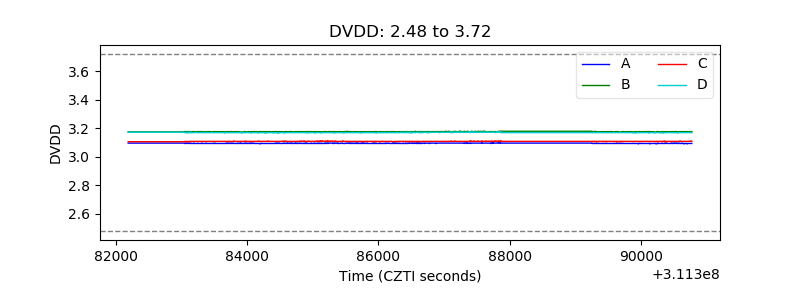 |
| Temperature 1 | 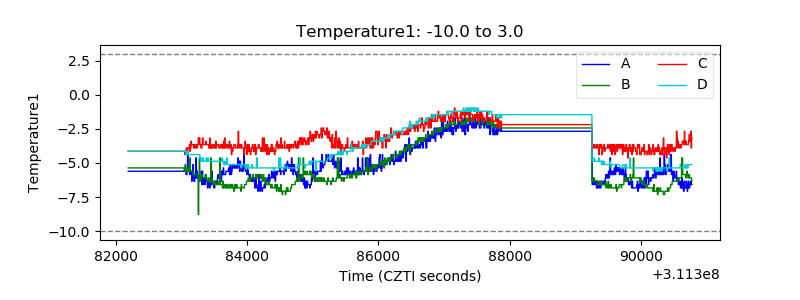 |
| Veto HV Monitor | 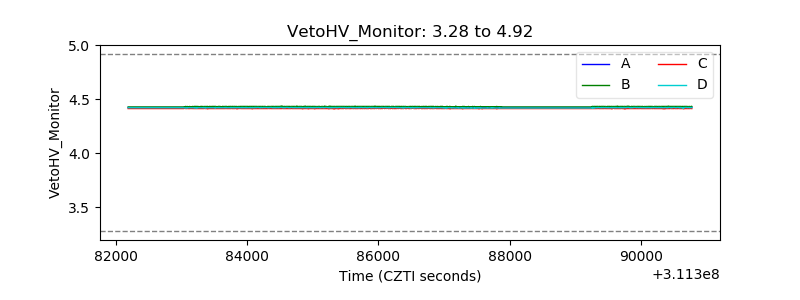 |
| Veto LLD | 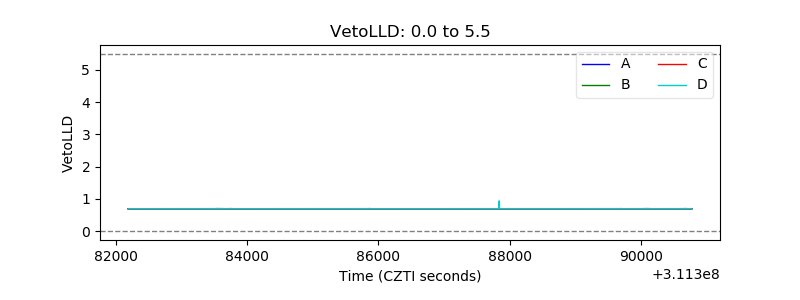 |
| Alpha Counter | 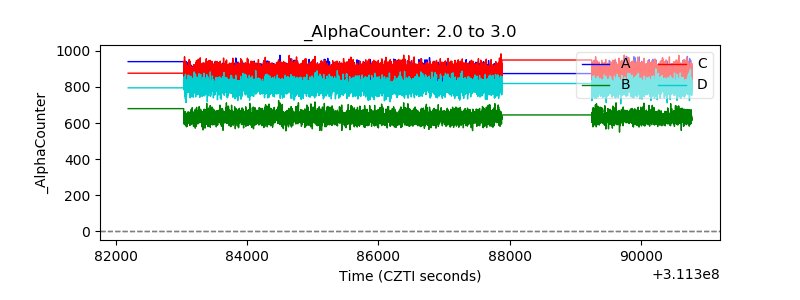 |
| _CPM_Rate | 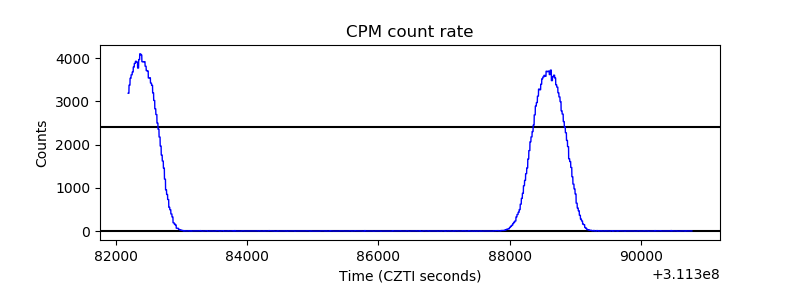 |
| CZT Counter | 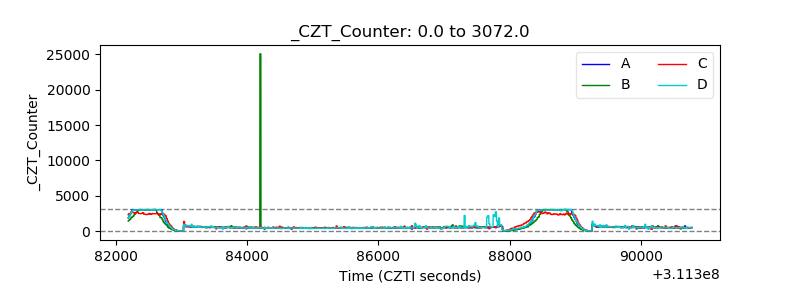 |
| +2.5 Volts monitor |  |
| +5 Volts monitor |  |
| _ROLL_ROT | 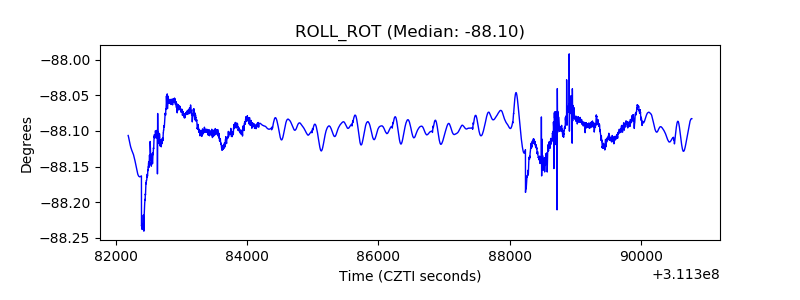 |
| _Roll_DEC | 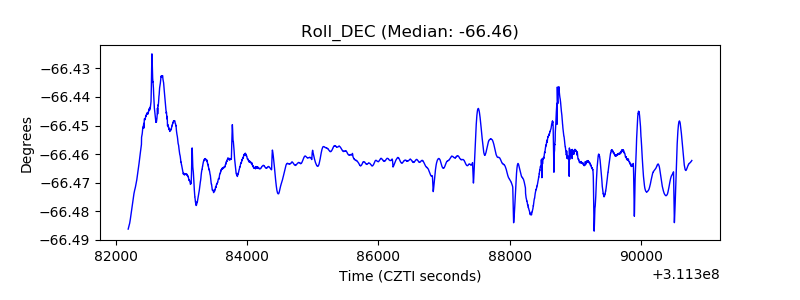 |
| _Roll_RA | 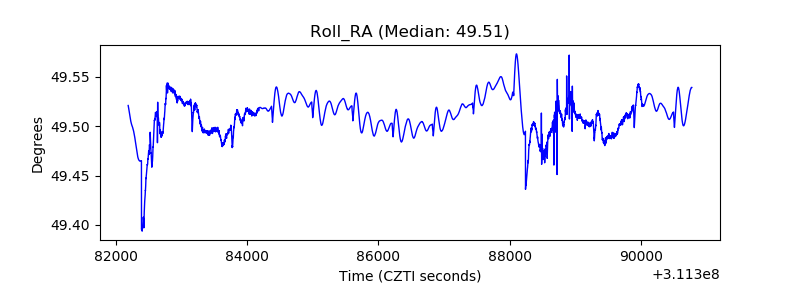 |
| Veto Counter | 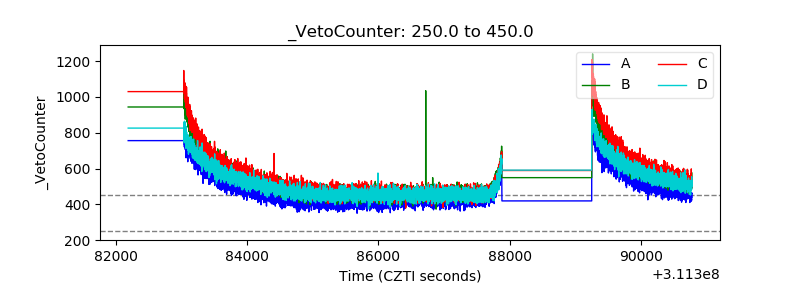 |