| Param | Original file | Final file |
|---|---|---|
| Filename | modeM0/AS1A07_149T01_9000003304_22322cztM0_level2.evt | modeM0/AS1A07_149T01_9000003304_22322cztM0_level2_quad_clean.evt |
| Size (bytes) | 416,102,400 | 95,938,560 |
| Size | 396.8 MB | 91.5 MB |
| Events in quadrant A | 2,983,140 | 622,854 |
| Events in quadrant B | 3,059,737 | 638,743 |
| Events in quadrant C | 3,080,536 | 610,527 |
| Events in quadrant D | 3,052,089 | 596,105 |
| Mode SS | |||
|---|---|---|---|
| Quadrant | BADHDUFLAG | Total packets | Discarded packets |
| A | 0 | 128 | 0 |
| B | 0 | 128 | 0 |
| C | 0 | 128 | 0 |
| D | 0 | 128 | 0 |
| Mode M0 | |||
|---|---|---|---|
| Quadrant | BADHDUFLAG | Total packets | Discarded packets |
| A | 0 | 12725 | 1 |
| B | 0 | 12824 | 1 |
| C | 0 | 12819 | 2 |
| D | 0 | 13146 | 1 |
| Mode M9 | |||
|---|---|---|---|
| Quadrant | BADHDUFLAG | Total packets | Discarded packets |
| A | 0 | 10 | 0 |
| B | 0 | 10 | 0 |
| C | 0 | 10 | 0 |
| D | 0 | 10 | 0 |
| Quadrant | Total seconds | Saturated seconds | Saturation percentage |
|---|---|---|---|
| A | 6263 | 48 | 0.766406% |
| B | 6263 | 64 | 1.021875% |
| C | 6262 | 96 | 1.533057% |
| D | 6263 | 63 | 1.005908% |
Noise dominated data is calculated using 1-second bins in cleaned event files. If a bin has >2000 counts, and if more than 50% of those come from <1% of pixels, then it is considered to be noise-dominated and hence unusable.
| Quadrant | # 1 sec bins | Bins with >0 counts | Bins with >2000 counts | High rate bins dominated by noise | Noise dominated (total time) | Noise dominated (detector-on time) | Marked lightcurve |
|---|---|---|---|---|---|---|---|
| A | 7263 | 6264 | 0 | 0 | 0.00% | 0.00% | 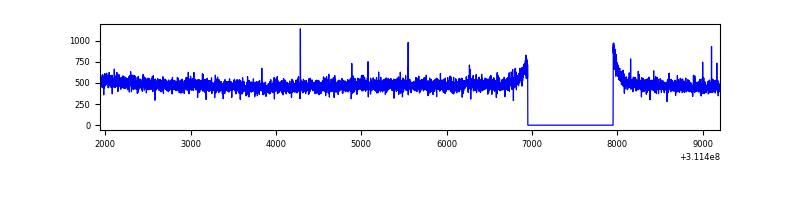 |
| B | 7263 | 6264 | 1 | 1 | 0.01% | 0.02% | 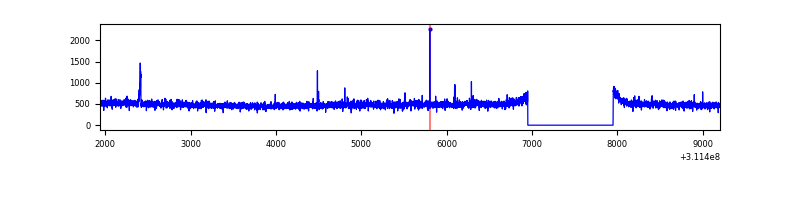 |
| C | 7262 | 6263 | 0 | 0 | 0.00% | 0.00% | 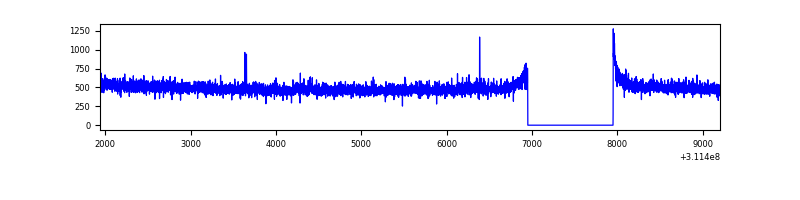 |
| D | 7263 | 6264 | 20 | 20 | 0.28% | 0.32% | 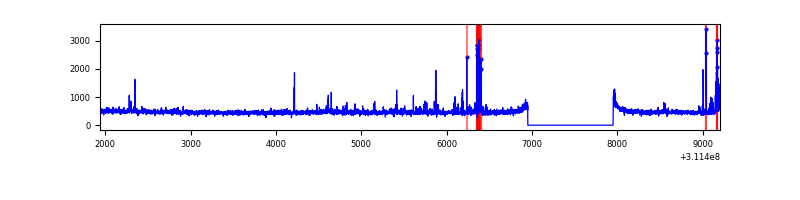 |
Top three noisy pixels from each quadrant. If the there are fewer than three noisy pixels in the level2.evt file, extra rows are filled as -1
| Pixel properties | Quadrant properties | ||||||
|---|---|---|---|---|---|---|---|
| Quadrant | DetID | PixID | Counts | Sigma | Mean | Median | Sigma |
| A | 13 | 254 | 8245 | 48.87 | 773 | 756 | 153.3 |
| A | 0 | 226 | 6547 | 37.79 | 773 | 756 | 153.3 |
| A | 3 | 137 | 6342 | 36.45 | 773 | 756 | 153.3 |
| B | 12 | 111 | 17024 | 112.88 | 775 | 756 | 144.1 |
| B | 11 | 111 | 15027 | 99.02 | 775 | 756 | 144.1 |
| B | 14 | 111 | 13526 | 88.61 | 775 | 756 | 144.1 |
| C | 14 | 238 | 122374 | 705.64 | 753 | 758 | 172.3 |
| C | 10 | 22 | 10267 | 55.17 | 753 | 758 | 172.3 |
| C | 0 | 10 | 7170 | 37.2 | 753 | 758 | 172.3 |
| D | 1 | 52 | 168693 | 919.63 | 758 | 736 | 182.6 |
| D | 2 | 234 | 24470 | 129.95 | 758 | 736 | 182.6 |
| D | 14 | 226 | 7355 | 36.24 | 758 | 736 | 182.6 |
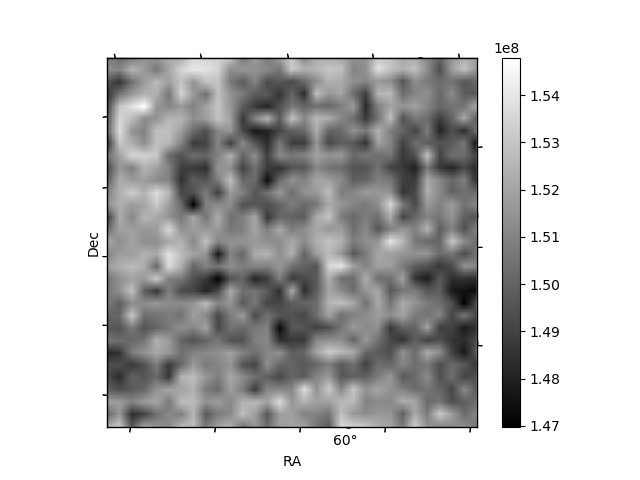
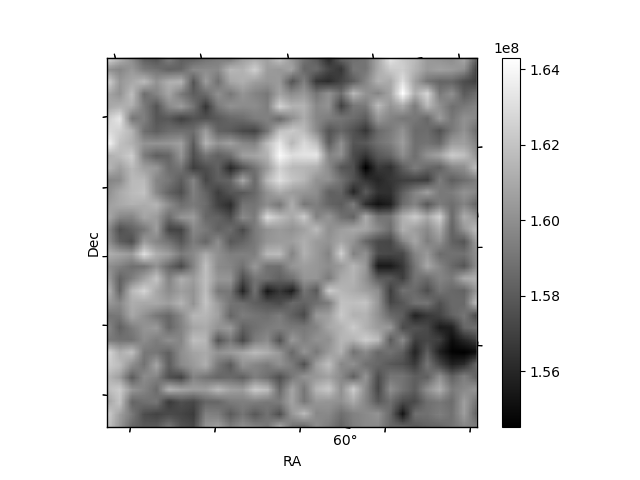
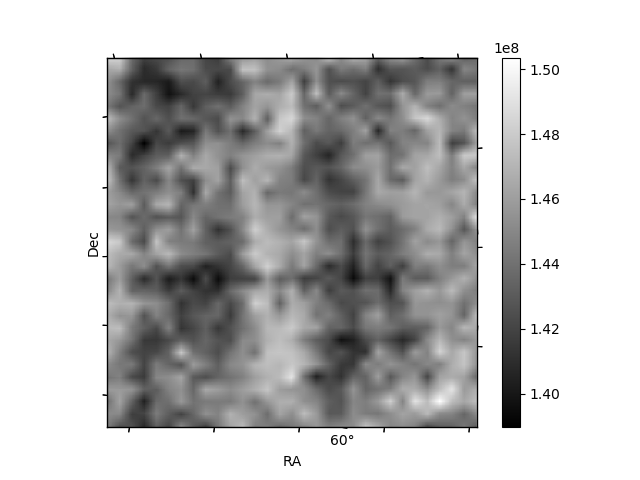
Histogram calculated using DETX and DETY for each event in the final _common_clean file
| Quadrant A | 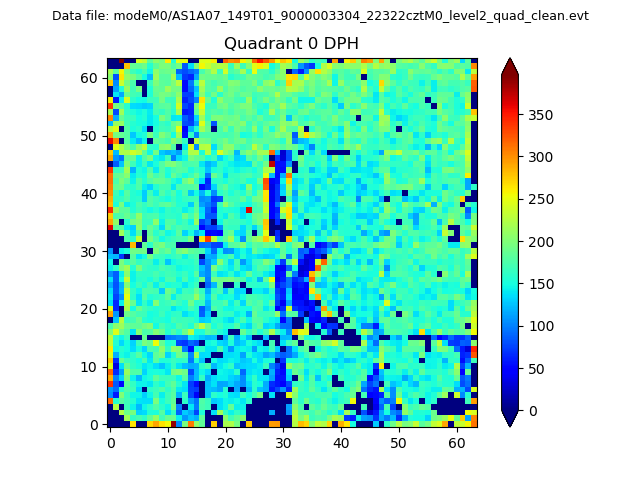 |
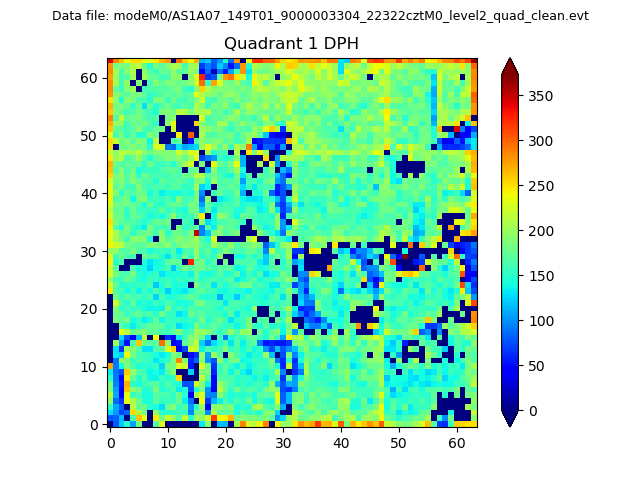 |
Quadrant B |
|---|---|---|---|
| Quadrant D | 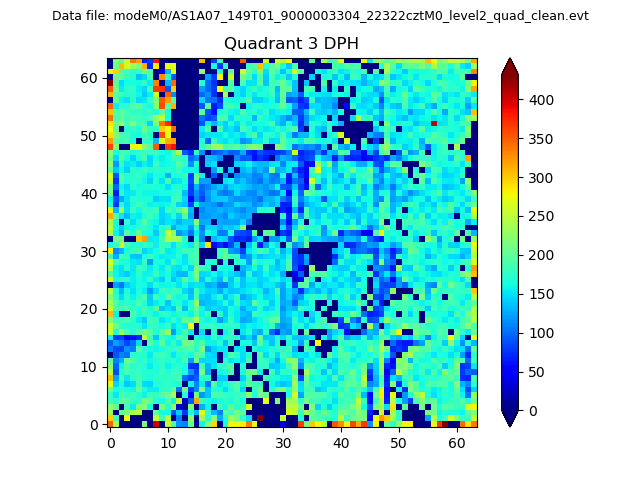 |
 |
Quadrant C |
| Plot type | Count rate plots | Images |
|---|---|---|
| Comparison with Poisson distribution Blue bars denote a histogram of data divided into 1 sec bins. Red curve is a Poisson curve with rate = median count rate of data. |
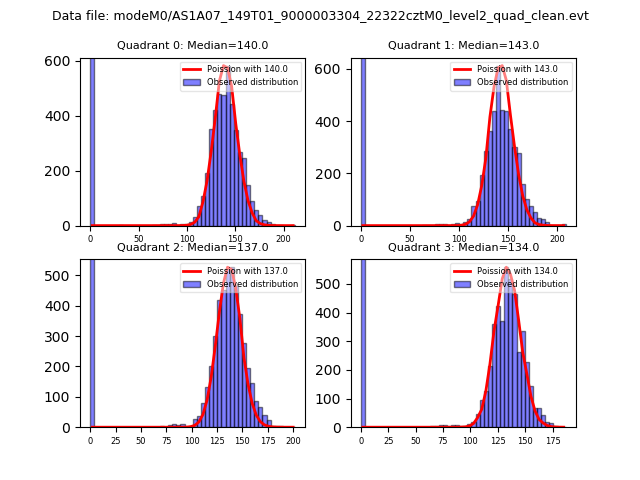 |
 |
| Quadrant-wise count rates Data is divided into 100 sec bins |
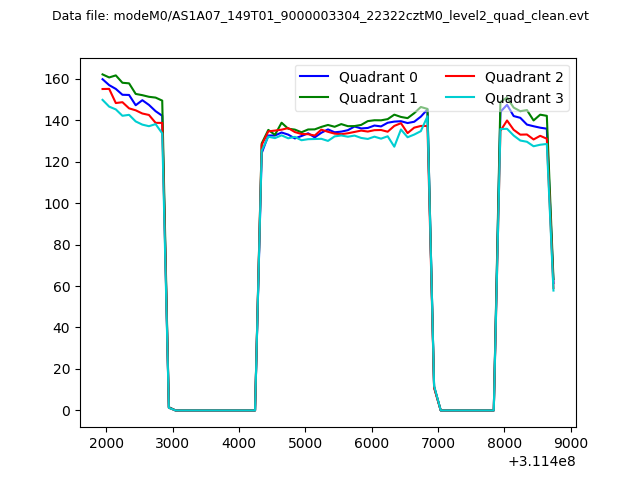 |
|
| Module-wise count rates for Quadrant A Data is divided into 100 sec bins |
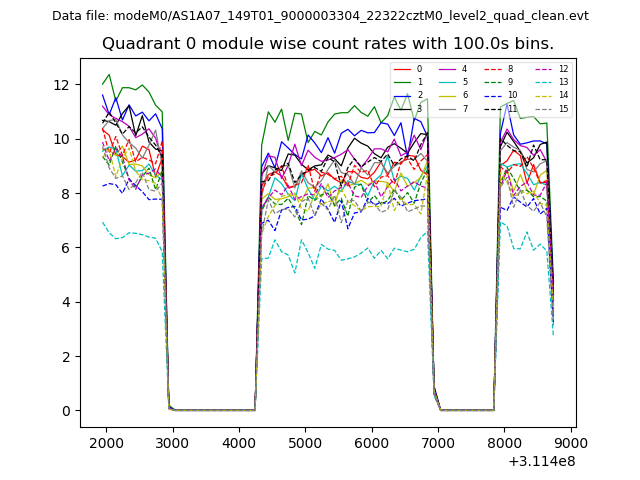 |
 |
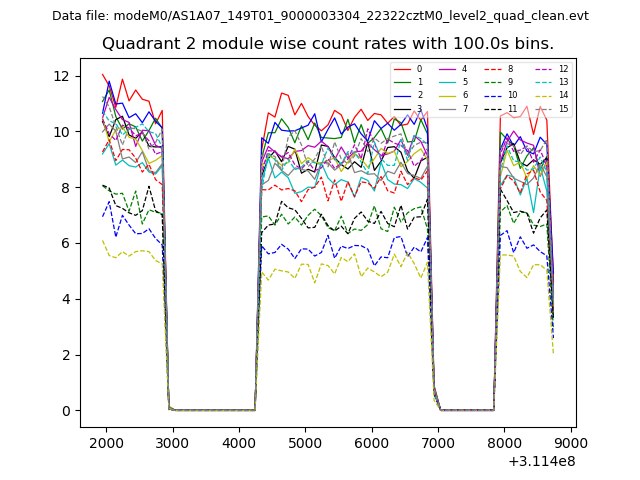
| Module-wise count rates for Quadrant B Data is divided into 100 sec bins |
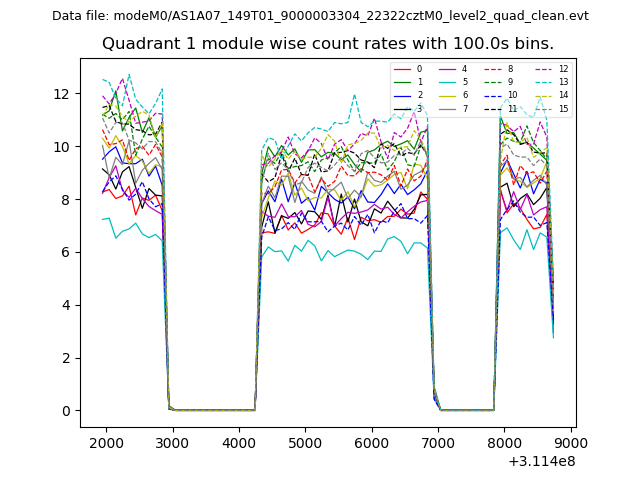 |
 |
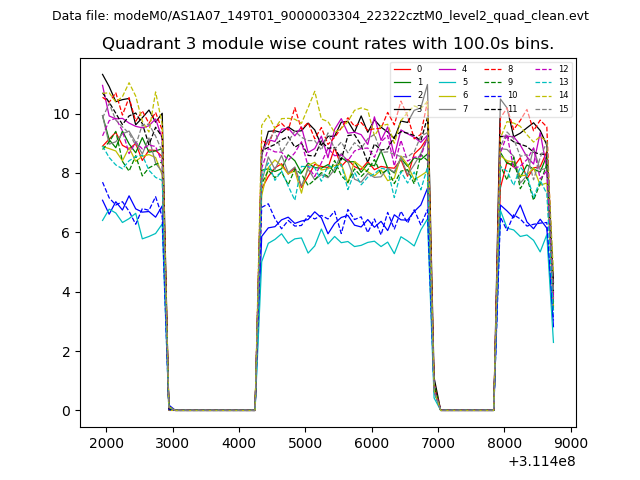
| Module-wise count rates for Quadrant C Data is divided into 100 sec bins |
 |
 |
| Module-wise count rates for Quadrant D Data is divided into 100 sec bins |
 |
 |
| Parameter | Plot |
|---|---|
| CZT HV Monitor | 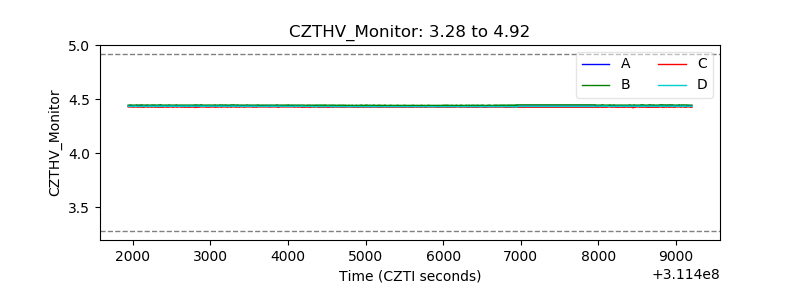 |
| D_VDD |  |
| Temperature 1 | 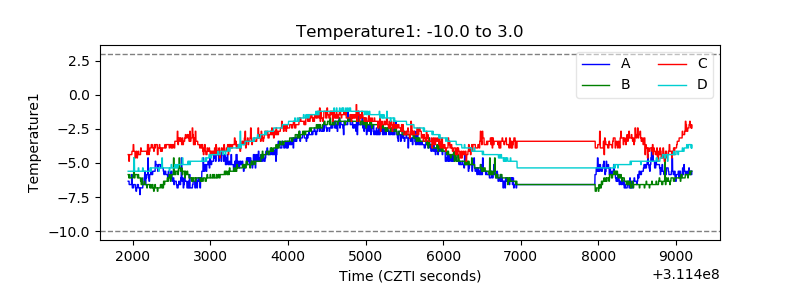 |
| Veto HV Monitor | 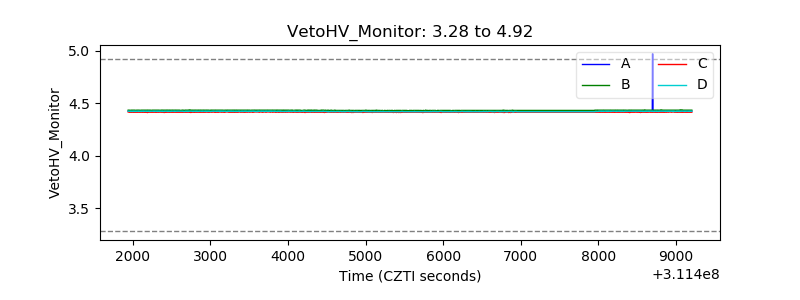 |
| Veto LLD | 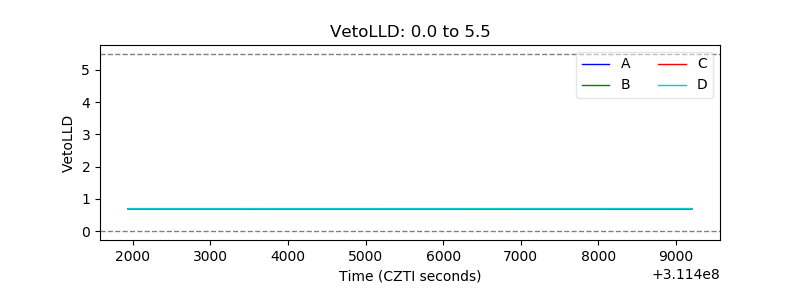 |
| Alpha Counter | 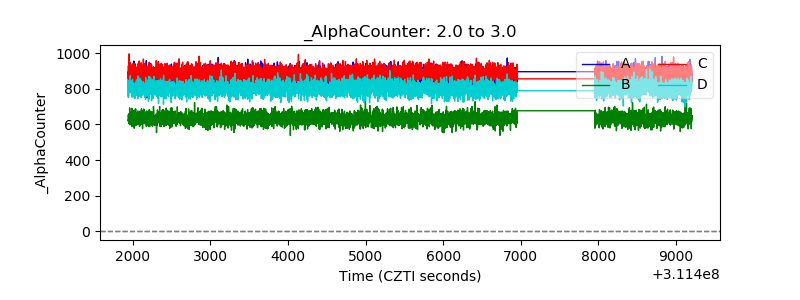 |
| _CPM_Rate | 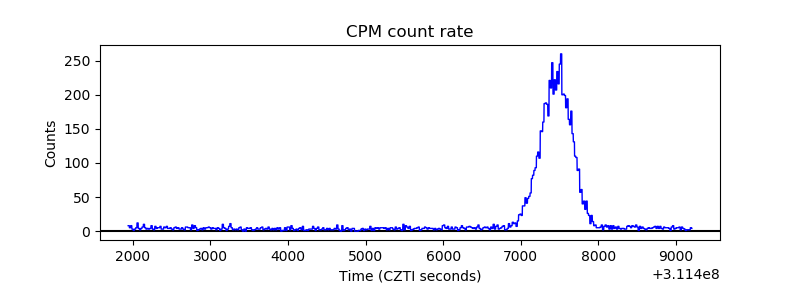 |
| CZT Counter |  |
| +2.5 Volts monitor |  |
| +5 Volts monitor |  |
| _ROLL_ROT | 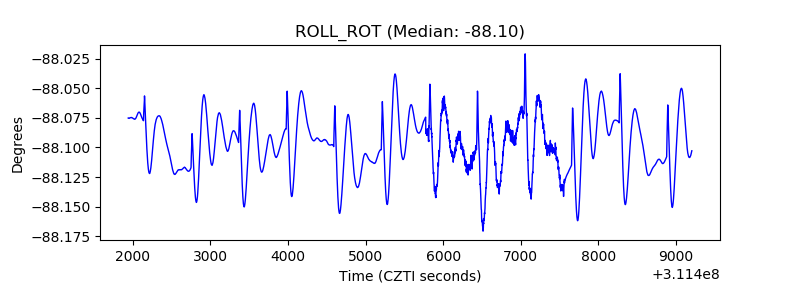 |
| _Roll_DEC | 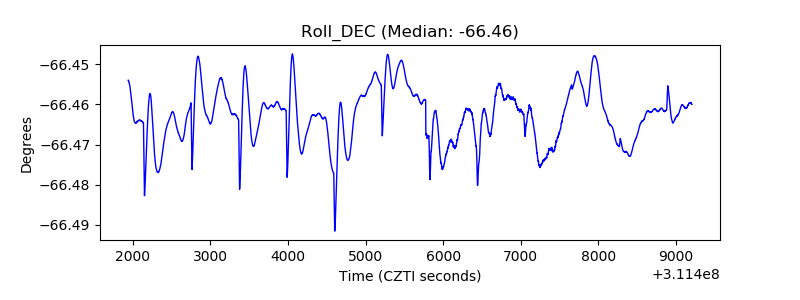 |
| _Roll_RA | 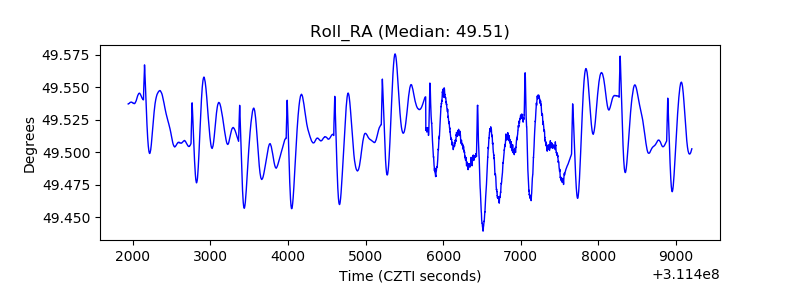 |
| Veto Counter | 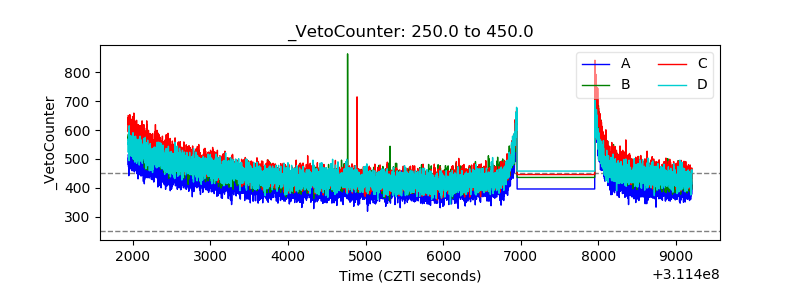 |