| Param | Original file | Final file |
|---|---|---|
| Filename | modeM0/AS1A07_149T01_9000003304_22323cztM0_level2.evt | modeM0/AS1A07_149T01_9000003304_22323cztM0_level2_quad_clean.evt |
| Size (bytes) | 467,622,720 | 96,739,200 |
| Size | 446.0 MB | 92.3 MB |
| Events in quadrant A | 3,258,638 | 617,395 |
| Events in quadrant B | 3,435,292 | 632,117 |
| Events in quadrant C | 3,367,118 | 603,707 |
| Events in quadrant D | 3,626,835 | 590,523 |
| Mode SS | |||
|---|---|---|---|
| Quadrant | BADHDUFLAG | Total packets | Discarded packets |
| A | 0 | 142 | 0 |
| B | 0 | 142 | 0 |
| C | 0 | 142 | 0 |
| D | 0 | 142 | 0 |
| Mode M0 | |||
|---|---|---|---|
| Quadrant | BADHDUFLAG | Total packets | Discarded packets |
| A | 0 | 14260 | 1 |
| B | 0 | 14616 | 1 |
| C | 0 | 14361 | 1 |
| D | 0 | 15495 | 1 |
| Mode M9 | |||
|---|---|---|---|
| Quadrant | BADHDUFLAG | Total packets | Discarded packets |
| A | 0 | 5 | 0 |
| B | 0 | 5 | 0 |
| C | 0 | 5 | 0 |
| D | 0 | 5 | 0 |
| Quadrant | Total seconds | Saturated seconds | Saturation percentage |
|---|---|---|---|
| A | 6972 | 103 | 1.477338% |
| B | 6972 | 124 | 1.778543% |
| C | 6972 | 137 | 1.965003% |
| D | 6972 | 161 | 2.309237% |
Noise dominated data is calculated using 1-second bins in cleaned event files. If a bin has >2000 counts, and if more than 50% of those come from <1% of pixels, then it is considered to be noise-dominated and hence unusable.
| Quadrant | # 1 sec bins | Bins with >0 counts | Bins with >2000 counts | High rate bins dominated by noise | Noise dominated (total time) | Noise dominated (detector-on time) | Marked lightcurve |
|---|---|---|---|---|---|---|---|
| A | 7527 | 6973 | 0 | 0 | 0.00% | 0.00% | 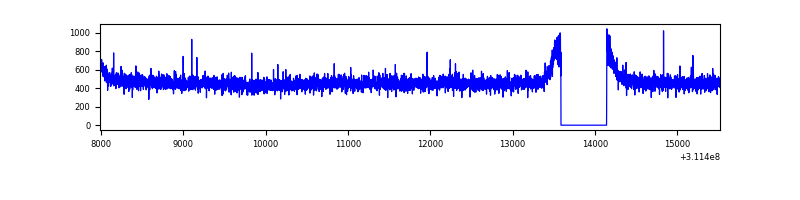 |
| B | 7527 | 6972 | 5 | 5 | 0.07% | 0.07% | 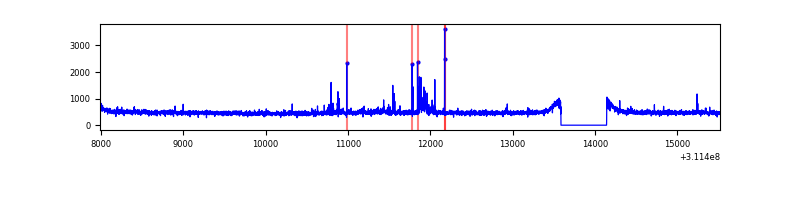 |
| C | 7527 | 6973 | 0 | 0 | 0.00% | 0.00% | 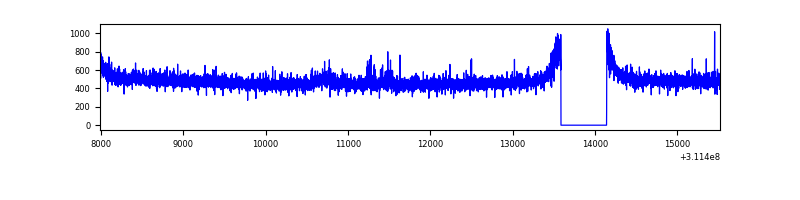 |
| D | 7527 | 6973 | 72 | 72 | 0.96% | 1.03% | 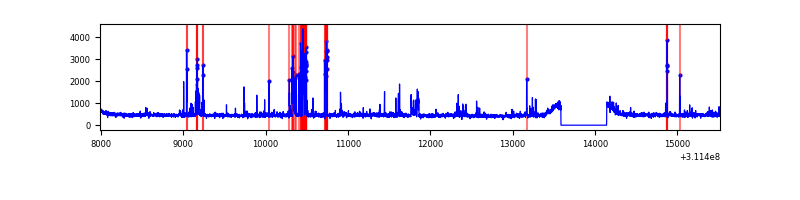 |
Top three noisy pixels from each quadrant. If the there are fewer than three noisy pixels in the level2.evt file, extra rows are filled as -1
| Pixel properties | Quadrant properties | ||||||
|---|---|---|---|---|---|---|---|
| Quadrant | DetID | PixID | Counts | Sigma | Mean | Median | Sigma |
| A | 13 | 254 | 9780 | 52.62 | 845 | 826 | 170.2 |
| A | 0 | 226 | 7183 | 37.36 | 845 | 826 | 170.2 |
| A | 3 | 137 | 7123 | 37.0 | 845 | 826 | 170.2 |
| B | 0 | 245 | 75093 | 463.96 | 844 | 822 | 160.1 |
| B | 12 | 111 | 19349 | 115.74 | 844 | 822 | 160.1 |
| B | 3 | 64 | 17942 | 106.95 | 844 | 822 | 160.1 |
| C | 14 | 238 | 131549 | 681.48 | 822 | 828 | 191.8 |
| C | 10 | 91 | 12925 | 63.06 | 822 | 828 | 191.8 |
| C | 3 | 9 | 8777 | 41.44 | 822 | 828 | 191.8 |
| D | 1 | 52 | 445130 | 2224.64 | 826 | 801 | 199.7 |
| D | 13 | 172 | 30060 | 146.49 | 826 | 801 | 199.7 |
| D | 2 | 234 | 26472 | 128.53 | 826 | 801 | 199.7 |
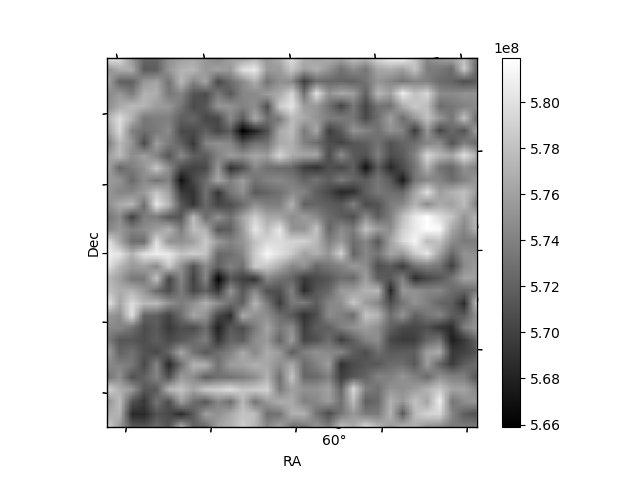
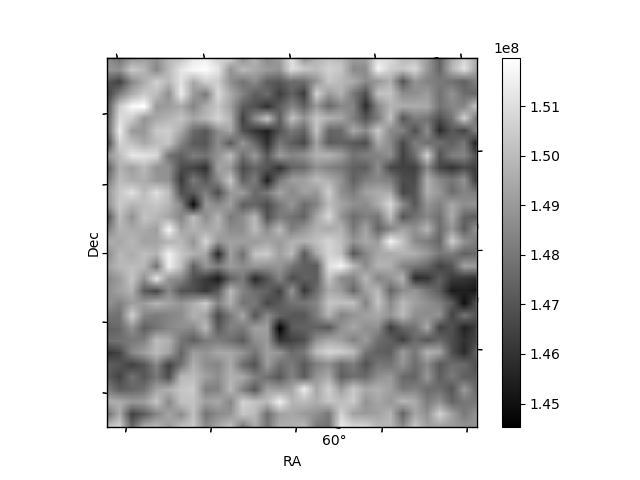
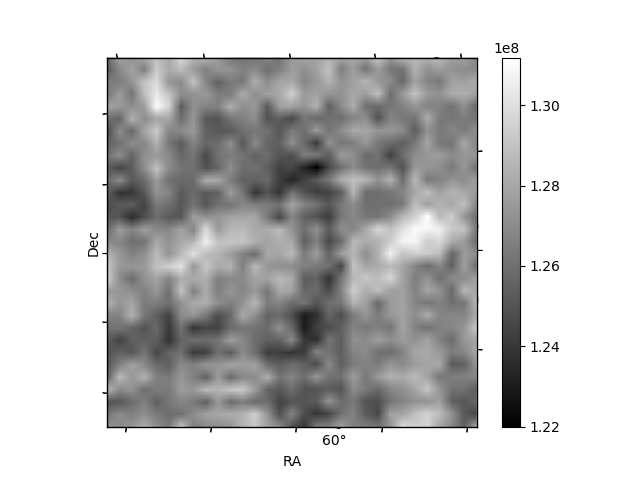
Histogram calculated using DETX and DETY for each event in the final _common_clean file
| Quadrant A | 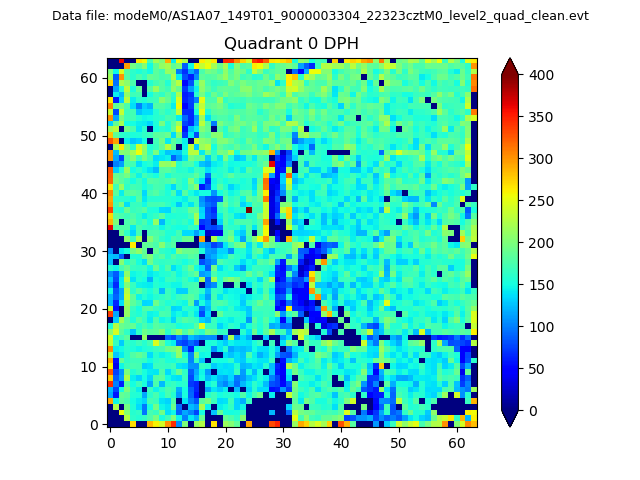 |
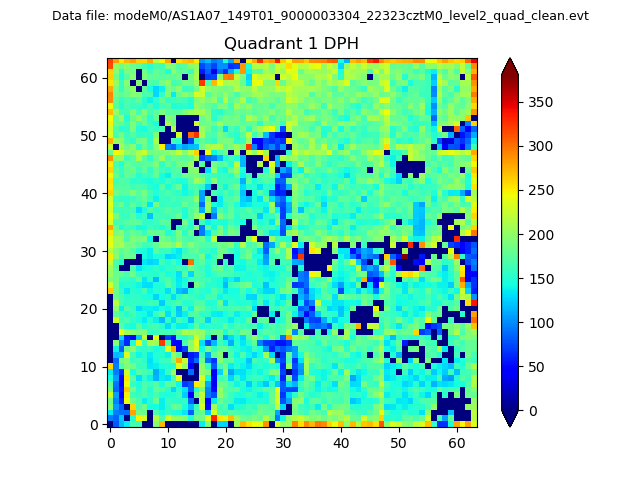 |
Quadrant B |
|---|---|---|---|
| Quadrant D | 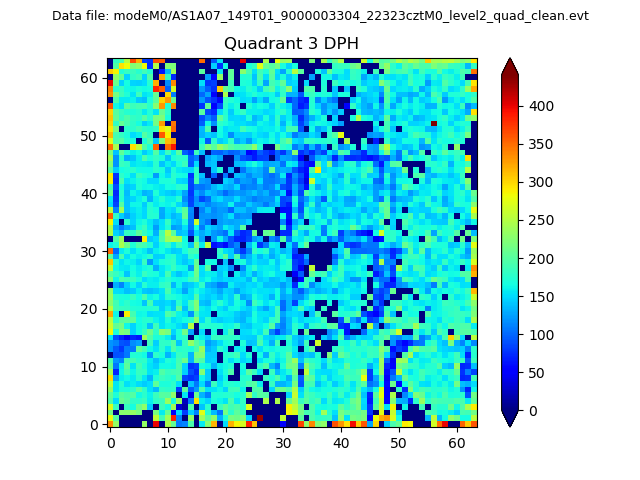 |
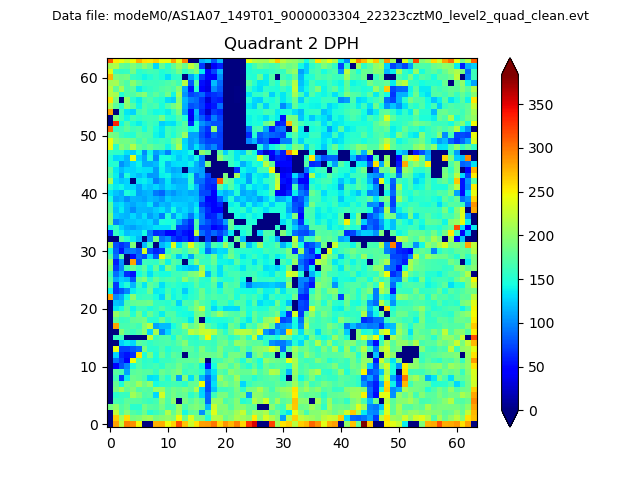 |
Quadrant C |
| Plot type | Count rate plots | Images |
|---|---|---|
| Comparison with Poisson distribution Blue bars denote a histogram of data divided into 1 sec bins. Red curve is a Poisson curve with rate = median count rate of data. |
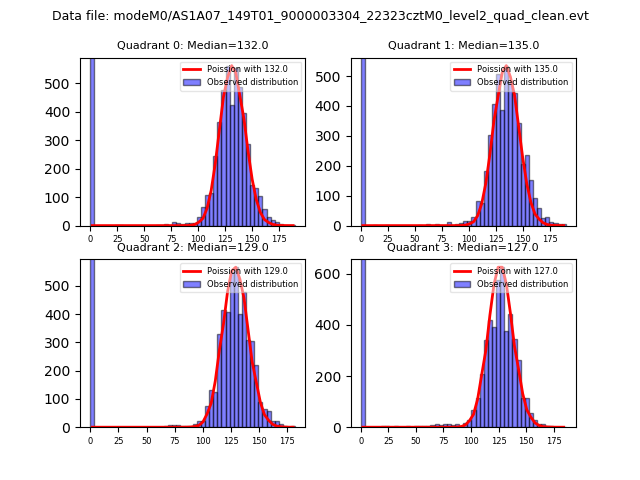 |
 |
| Quadrant-wise count rates Data is divided into 100 sec bins |
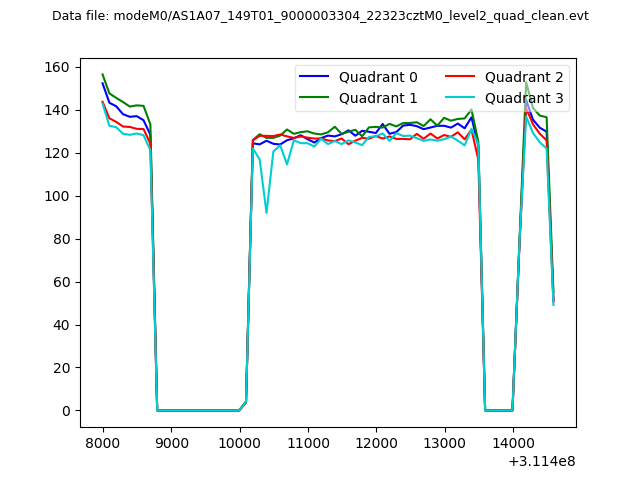 |
|
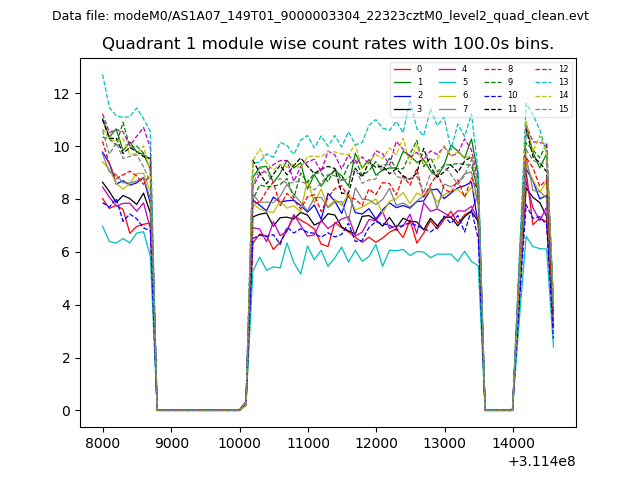
| Module-wise count rates for Quadrant A Data is divided into 100 sec bins |
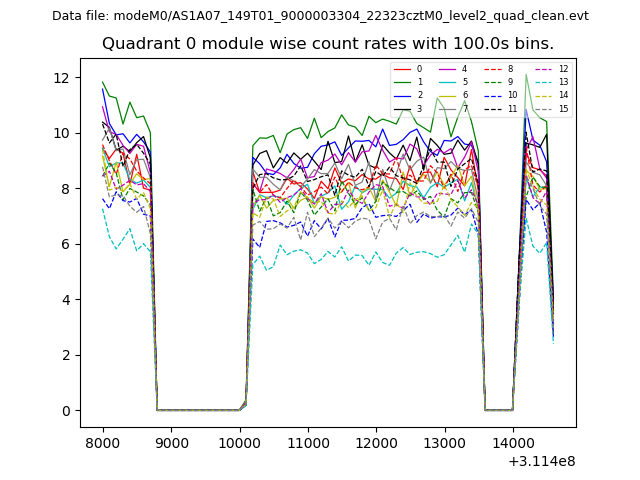 |
 |
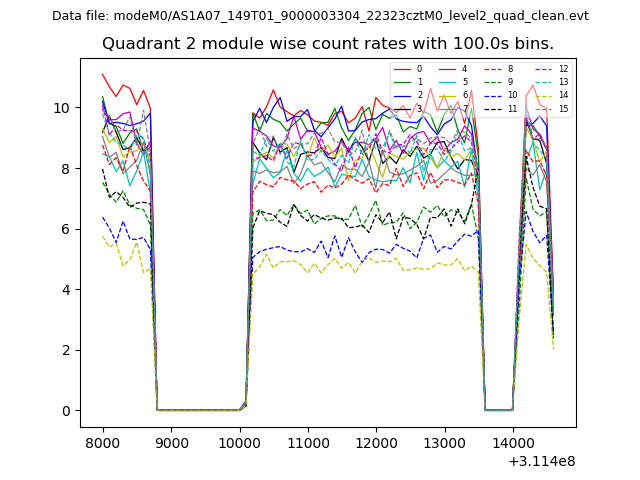
| Module-wise count rates for Quadrant B Data is divided into 100 sec bins |
 |
 |
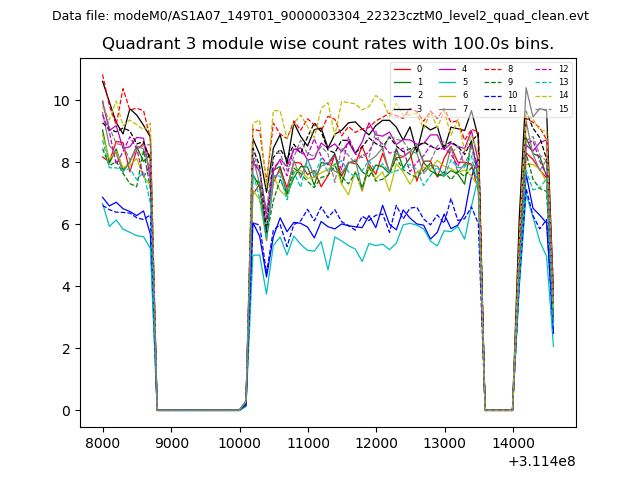
| Module-wise count rates for Quadrant C Data is divided into 100 sec bins |
 |
 |
| Module-wise count rates for Quadrant D Data is divided into 100 sec bins |
 |
 |
| Parameter | Plot |
|---|---|
| CZT HV Monitor | 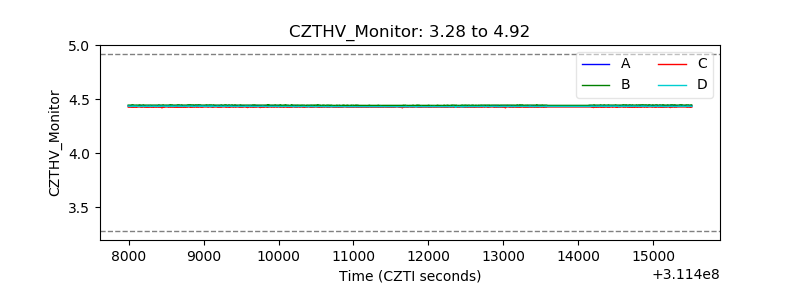 |
| D_VDD | 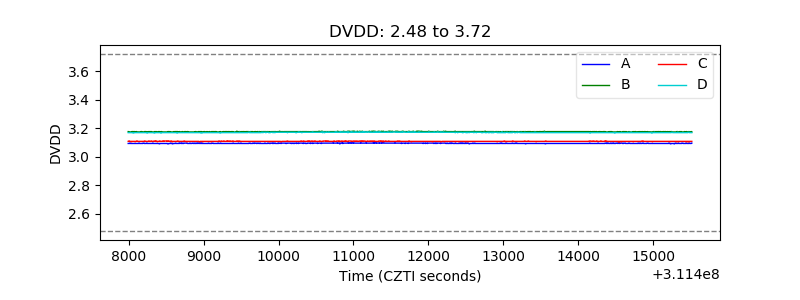 |
| Temperature 1 | 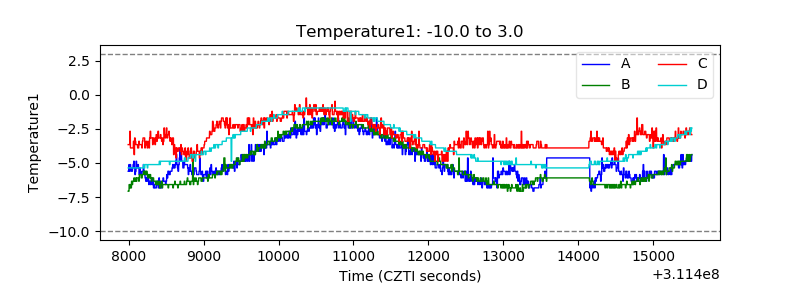 |
| Veto HV Monitor | 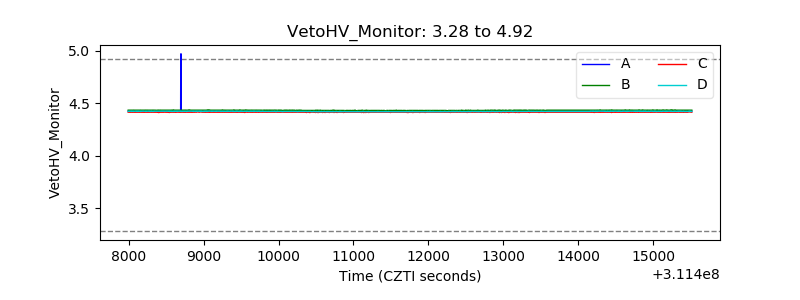 |
| Veto LLD | 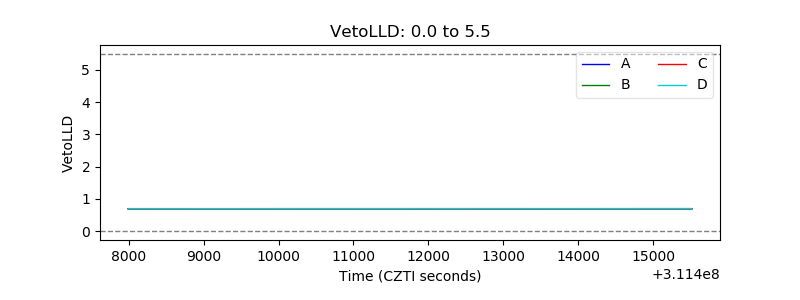 |
| Alpha Counter | 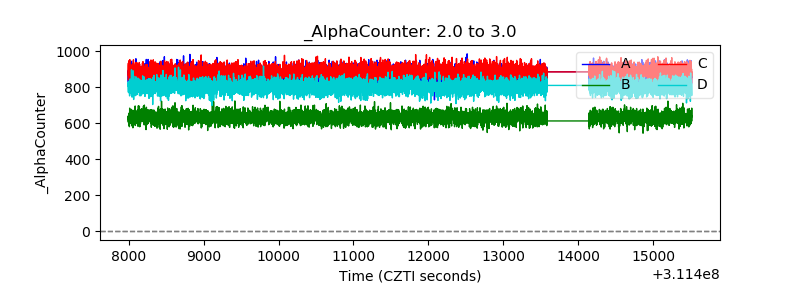 |
| _CPM_Rate | 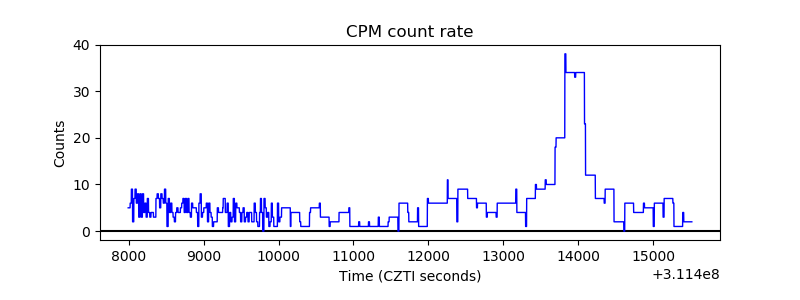 |
| CZT Counter | 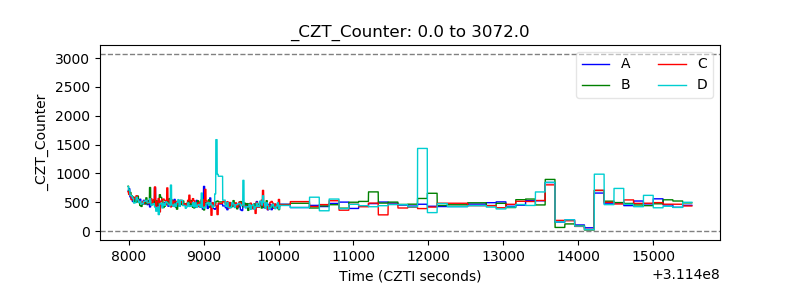 |
| +2.5 Volts monitor | 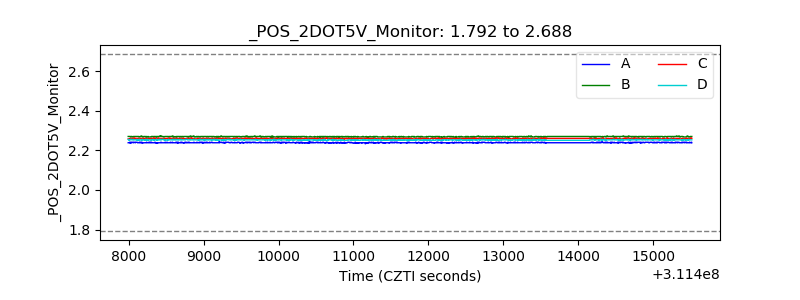 |
| +5 Volts monitor |  |
| _ROLL_ROT | 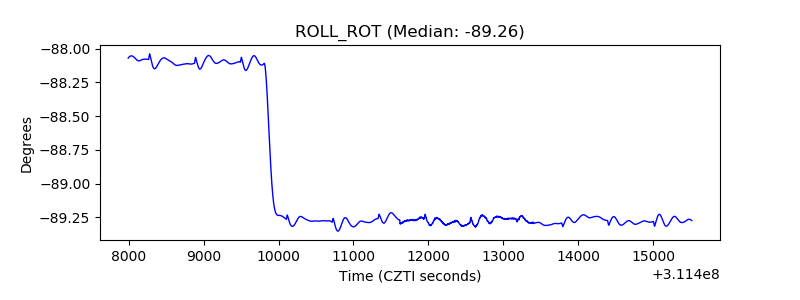 |
| _Roll_DEC | 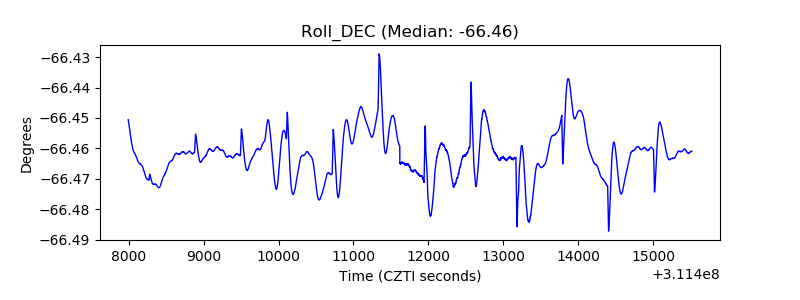 |
| _Roll_RA |  |
| Veto Counter | 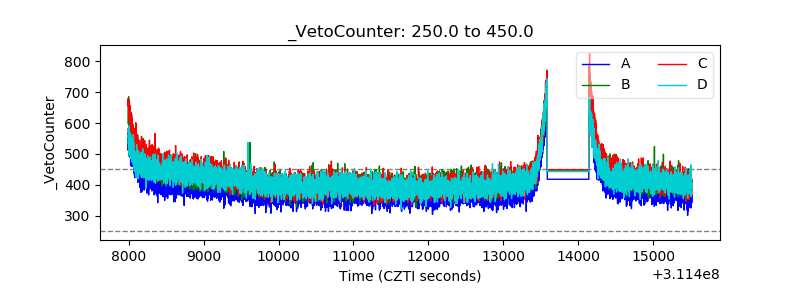 |