| Param | Original file | Final file |
|---|---|---|
| Filename | modeM0/AS1A07_149T01_9000003304_22324cztM0_level2.evt | modeM0/AS1A07_149T01_9000003304_22324cztM0_level2_quad_clean.evt |
| Size (bytes) | 523,800,000 | 99,956,160 |
| Size | 499.5 MB | 95.3 MB |
| Events in quadrant A | 3,664,187 | 627,585 |
| Events in quadrant B | 3,746,835 | 641,972 |
| Events in quadrant C | 3,759,195 | 615,055 |
| Events in quadrant D | 4,167,147 | 603,976 |
| Mode SS | |||
|---|---|---|---|
| Quadrant | BADHDUFLAG | Total packets | Discarded packets |
| A | 0 | 158 | 0 |
| B | 0 | 158 | 0 |
| C | 0 | 158 | 0 |
| D | 0 | 158 | 0 |
| Mode M0 | |||
|---|---|---|---|
| Quadrant | BADHDUFLAG | Total packets | Discarded packets |
| A | 0 | 16100 | 2 |
| B | 0 | 16168 | 3 |
| C | 0 | 16187 | 2 |
| D | 0 | 17775 | 2 |
| Mode M9 | |||
|---|---|---|---|
| Quadrant | BADHDUFLAG | Total packets | Discarded packets |
| A | 0 | 4 | 0 |
| B | 0 | 5 | 0 |
| C | 0 | 5 | 0 |
| D | 0 | 5 | 0 |
| Quadrant | Total seconds | Saturated seconds | Saturation percentage |
|---|---|---|---|
| A | 7731 | 294 | 3.802872% |
| B | 7730 | 327 | 4.230272% |
| C | 7730 | 327 | 4.230272% |
| D | 7730 | 341 | 4.411384% |
Noise dominated data is calculated using 1-second bins in cleaned event files. If a bin has >2000 counts, and if more than 50% of those come from <1% of pixels, then it is considered to be noise-dominated and hence unusable.
| Quadrant | # 1 sec bins | Bins with >0 counts | Bins with >2000 counts | High rate bins dominated by noise | Noise dominated (total time) | Noise dominated (detector-on time) | Marked lightcurve |
|---|---|---|---|---|---|---|---|
| A | 7786 | 7732 | 0 | 0 | 0.00% | 0.00% | 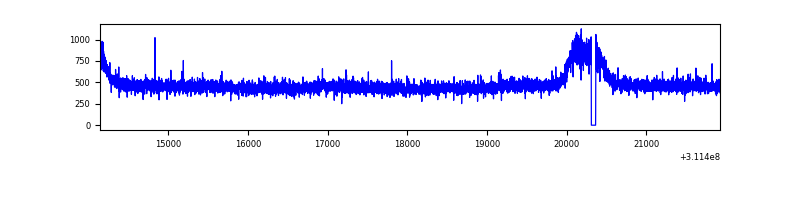 |
| B | 7785 | 7730 | 3 | 3 | 0.04% | 0.04% | 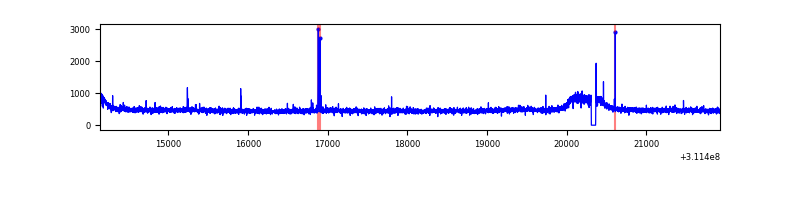 |
| C | 7785 | 7731 | 1 | 1 | 0.01% | 0.01% | 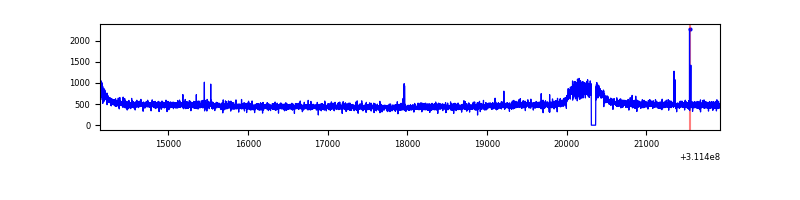 |
| D | 7785 | 7731 | 61 | 61 | 0.78% | 0.79% | 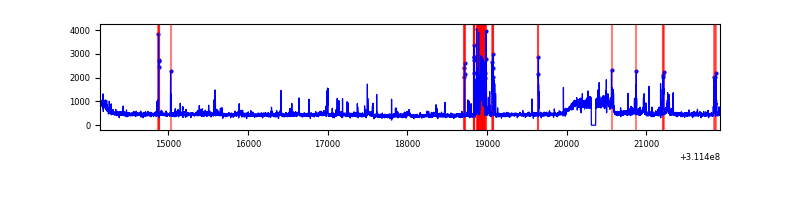 |
Top three noisy pixels from each quadrant. If the there are fewer than three noisy pixels in the level2.evt file, extra rows are filled as -1
| Pixel properties | Quadrant properties | ||||||
|---|---|---|---|---|---|---|---|
| Quadrant | DetID | PixID | Counts | Sigma | Mean | Median | Sigma |
| A | 13 | 254 | 9779 | 46.15 | 950 | 924 | 191.9 |
| A | 3 | 137 | 8446 | 39.2 | 950 | 924 | 191.9 |
| A | 0 | 226 | 8034 | 37.05 | 950 | 924 | 191.9 |
| B | 12 | 111 | 22314 | 116.8 | 948 | 919 | 183.2 |
| B | 11 | 111 | 19791 | 103.02 | 948 | 919 | 183.2 |
| B | 14 | 111 | 18107 | 93.83 | 948 | 919 | 183.2 |
| C | 14 | 238 | 144080 | 658.95 | 922 | 925 | 217.2 |
| C | 10 | 22 | 6825 | 27.16 | 922 | 925 | 217.2 |
| C | 3 | 9 | 6392 | 25.17 | 922 | 925 | 217.2 |
| D | 1 | 52 | 616469 | 2706.27 | 936 | 907 | 227.5 |
| D | 2 | 234 | 30041 | 128.09 | 936 | 907 | 227.5 |
| D | 13 | 104 | 14706 | 60.67 | 936 | 907 | 227.5 |
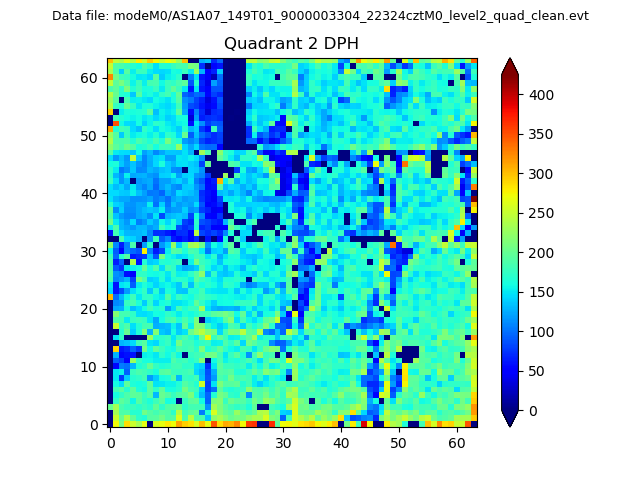
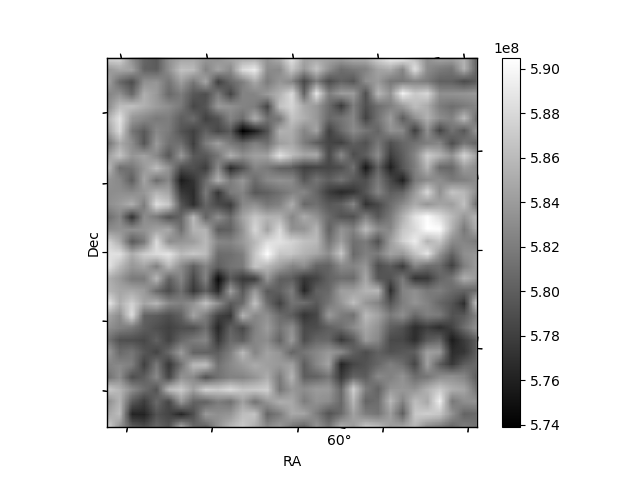
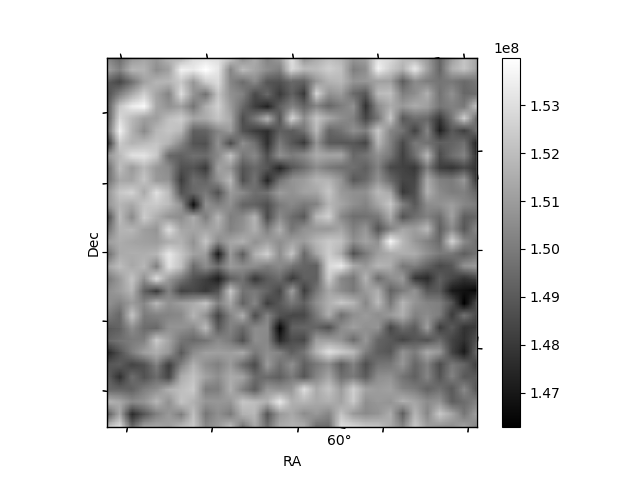
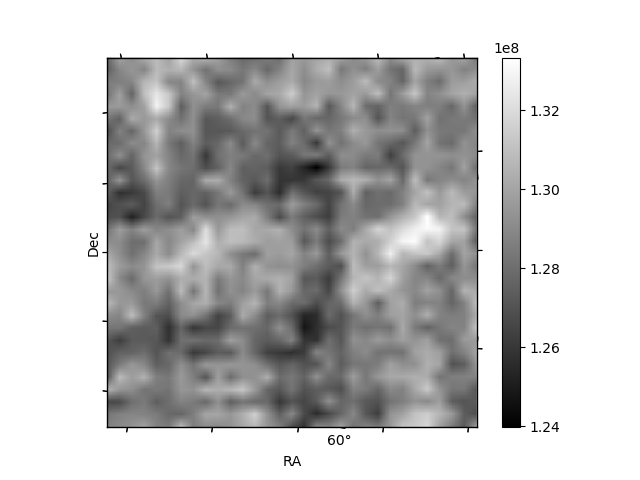
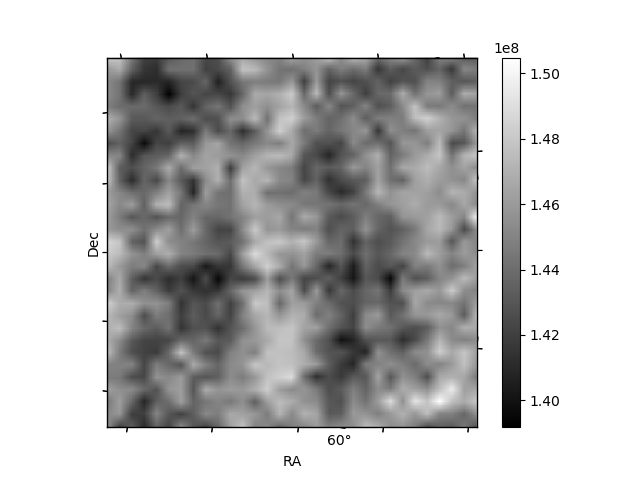
Histogram calculated using DETX and DETY for each event in the final _common_clean file
| Quadrant A | 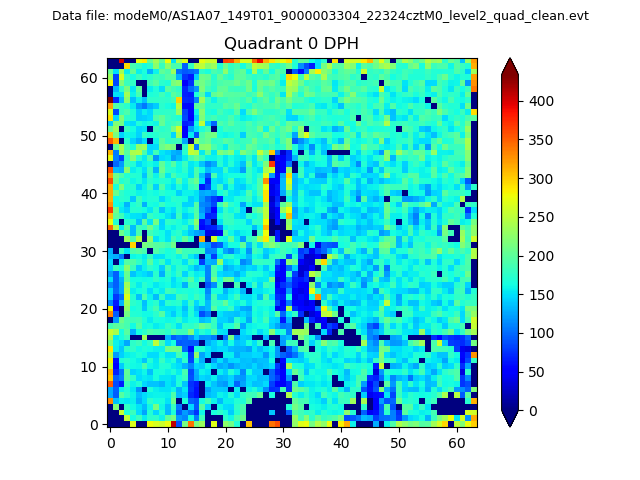 |
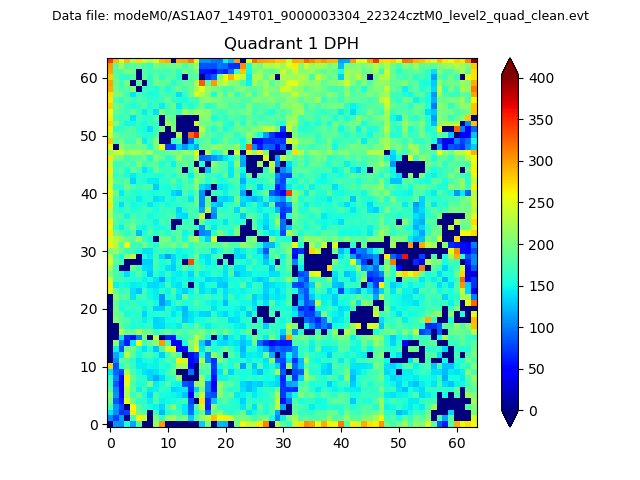 |
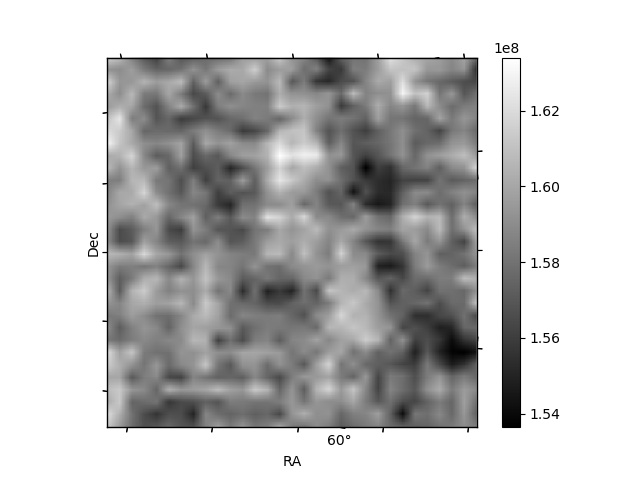
Quadrant B |
|---|---|---|---|
| Quadrant D | 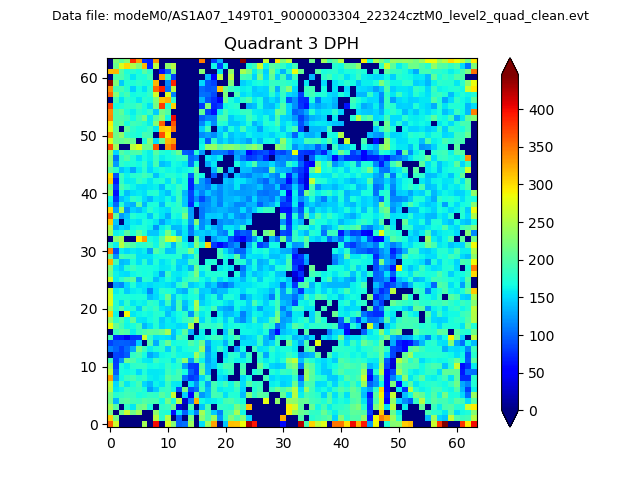 |
 |
Quadrant C |
| Plot type | Count rate plots | Images |
|---|---|---|
| Comparison with Poisson distribution Blue bars denote a histogram of data divided into 1 sec bins. Red curve is a Poisson curve with rate = median count rate of data. |
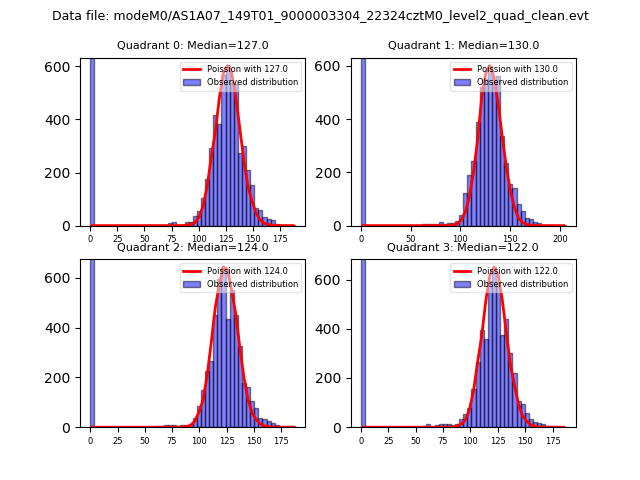 |
 |
| Quadrant-wise count rates Data is divided into 100 sec bins |
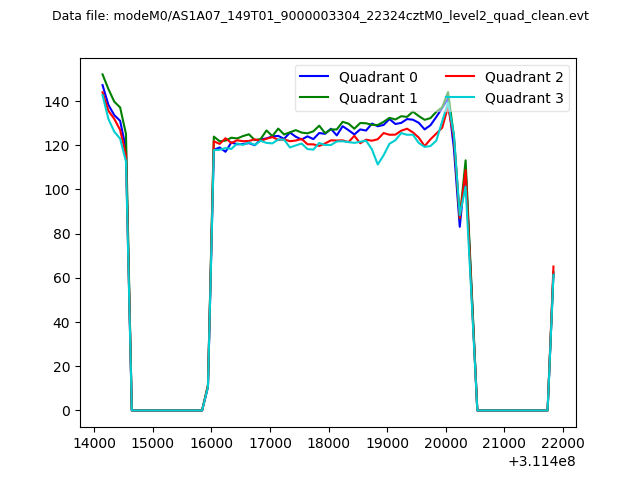 |
|
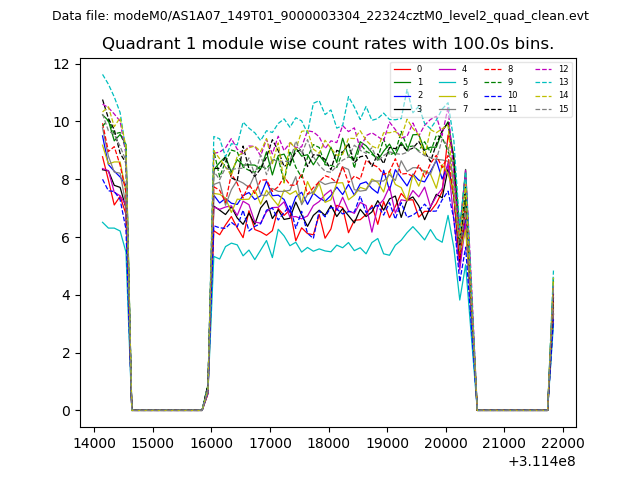
| Module-wise count rates for Quadrant A Data is divided into 100 sec bins |
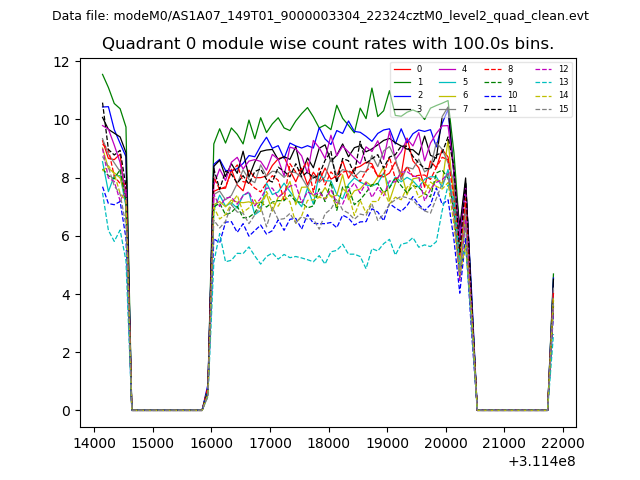 |
 |
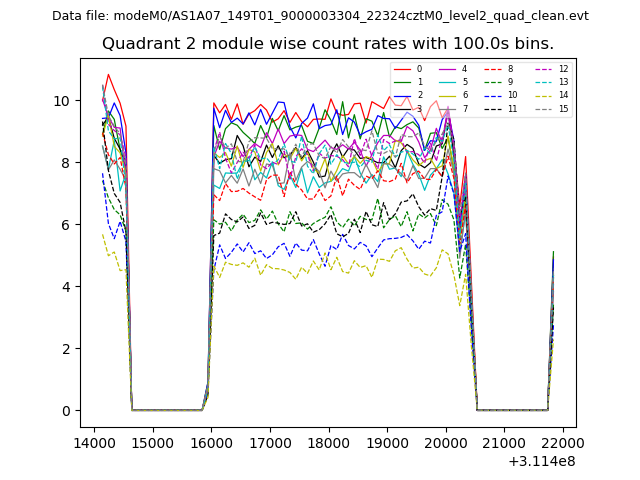
| Module-wise count rates for Quadrant B Data is divided into 100 sec bins |
 |
 |
| Module-wise count rates for Quadrant C Data is divided into 100 sec bins |
 |
 |
| Module-wise count rates for Quadrant D Data is divided into 100 sec bins |
 |
 |
| Parameter | Plot |
|---|---|
| CZT HV Monitor | 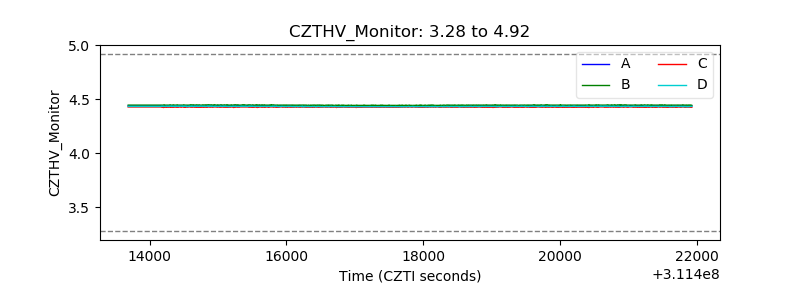 |
| D_VDD | 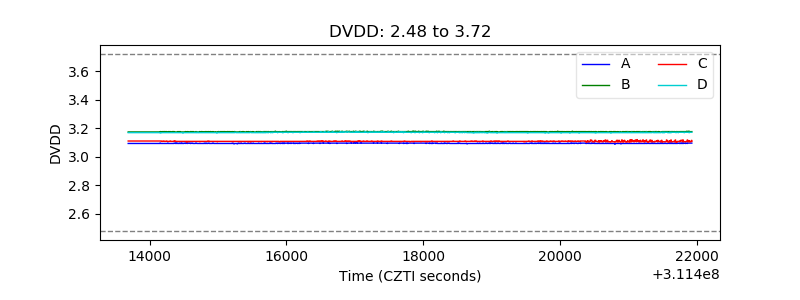 |
| Temperature 1 | 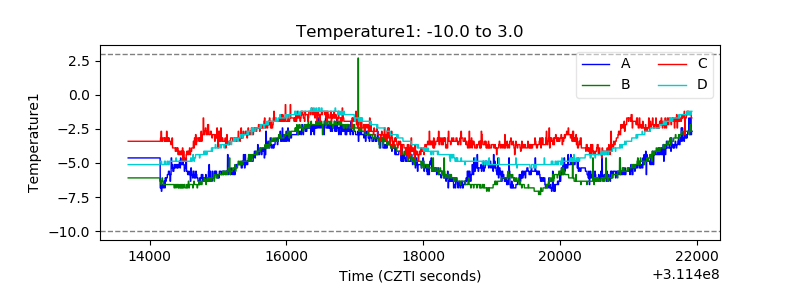 |
| Veto HV Monitor | 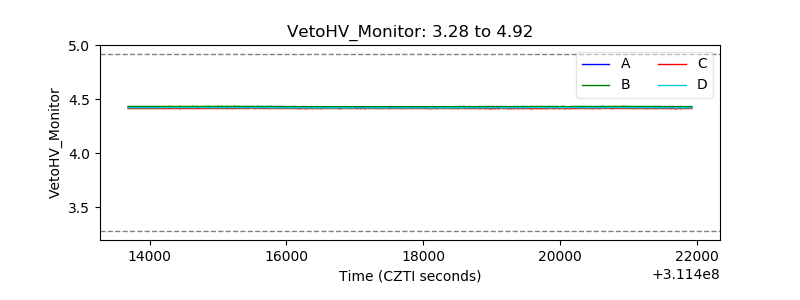 |
| Veto LLD | 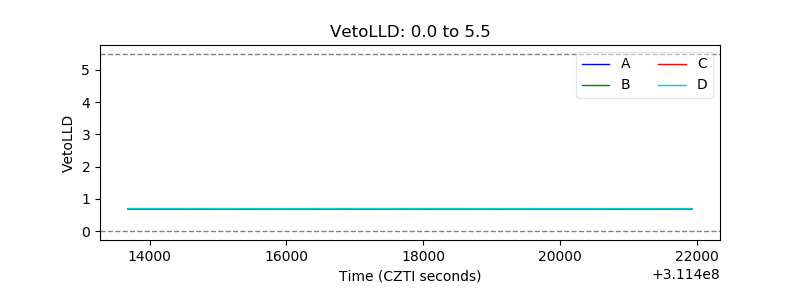 |
| Alpha Counter | 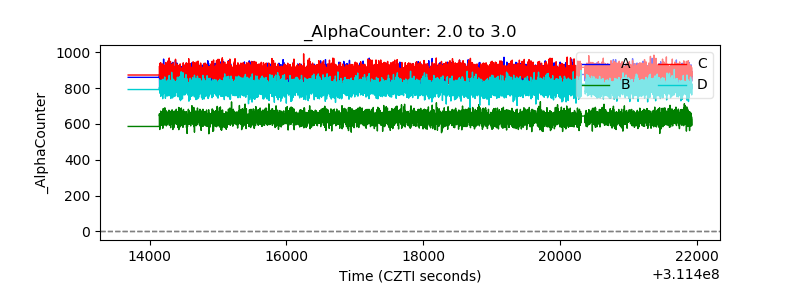 |
| _CPM_Rate | 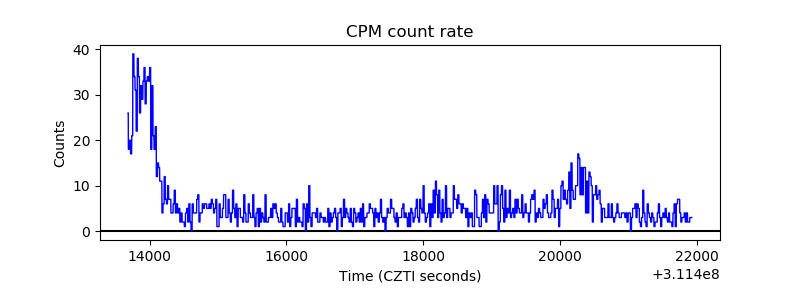 |
| CZT Counter | 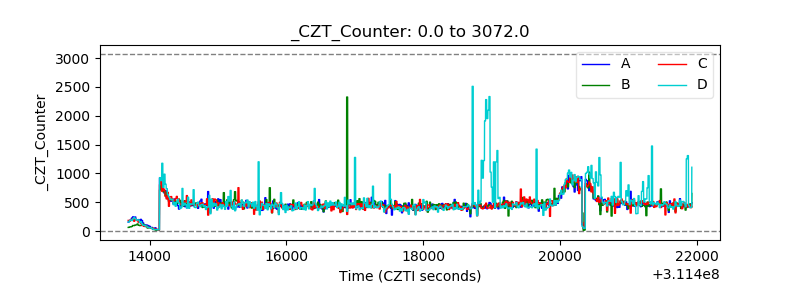 |
| +2.5 Volts monitor |  |
| +5 Volts monitor |  |
| _ROLL_ROT | 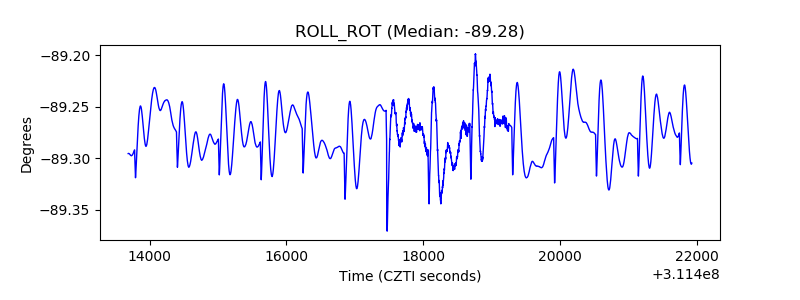 |
| _Roll_DEC | 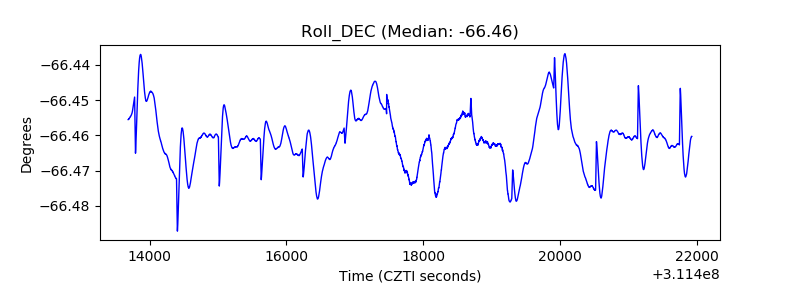 |
| _Roll_RA | 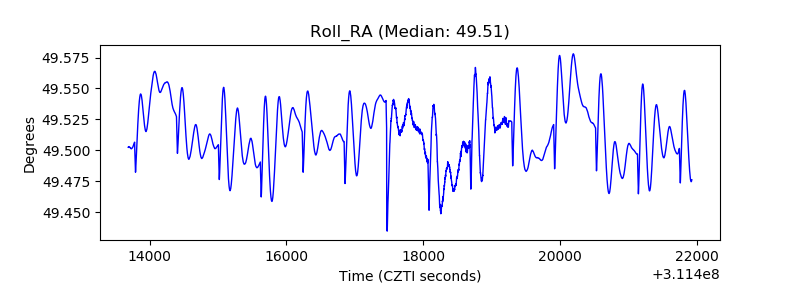 |
| Veto Counter |  |