| Param | Original file | Final file |
|---|---|---|
| Filename | modeM0/AS1A07_149T01_9000003304_22329cztM0_level2.evt | modeM0/AS1A07_149T01_9000003304_22329cztM0_level2_quad_clean.evt |
| Size (bytes) | 1,147,296,960 | 269,700,480 |
| Size | 1.1 GB | 257.2 MB |
| Events in quadrant A | 8,128,038 | 1,768,028 |
| Events in quadrant B | 8,402,454 | 1,800,753 |
| Events in quadrant C | 8,092,289 | 1,708,096 |
| Events in quadrant D | 8,933,659 | 1,680,666 |
| Mode SS | |||
|---|---|---|---|
| Quadrant | BADHDUFLAG | Total packets | Discarded packets |
| A | 0 | 358 | 0 |
| B | 0 | 358 | 0 |
| C | 0 | 358 | 0 |
| D | 0 | 358 | 0 |
| Mode M0 | |||
|---|---|---|---|
| Quadrant | BADHDUFLAG | Total packets | Discarded packets |
| A | 0 | 36087 | 3 |
| B | 0 | 36737 | 3 |
| C | 0 | 35777 | 3 |
| D | 0 | 38997 | 3 |
| Mode M9 | |||
|---|---|---|---|
| Quadrant | BADHDUFLAG | Total packets | Discarded packets |
| A | 0 | 24 | 0 |
| B | 0 | 24 | 0 |
| C | 0 | 24 | 0 |
| D | 0 | 24 | 0 |
| Quadrant | Total seconds | Saturated seconds | Saturation percentage |
|---|---|---|---|
| A | 17577 | 133 | 0.756671% |
| B | 17578 | 148 | 0.841962% |
| C | 17578 | 165 | 0.938673% |
| D | 17578 | 156 | 0.887473% |
Noise dominated data is calculated using 1-second bins in cleaned event files. If a bin has >2000 counts, and if more than 50% of those come from <1% of pixels, then it is considered to be noise-dominated and hence unusable.
| Quadrant | # 1 sec bins | Bins with >0 counts | Bins with >2000 counts | High rate bins dominated by noise | Noise dominated (total time) | Noise dominated (detector-on time) | Marked lightcurve |
|---|---|---|---|---|---|---|---|
| A | 19977 | 17578 | 36 | 36 | 0.18% | 0.20% | 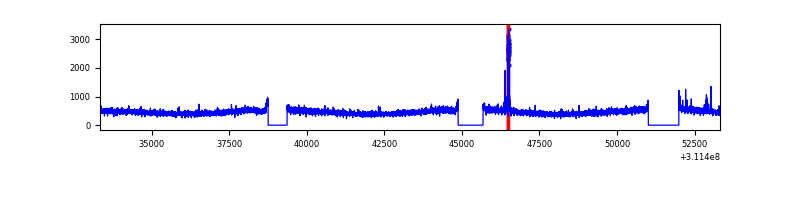 |
| B | 19978 | 17579 | 14 | 14 | 0.07% | 0.08% | 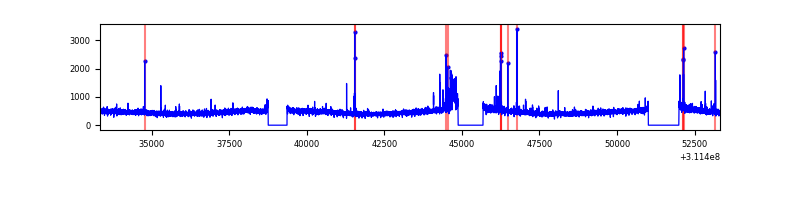 |
| C | 19978 | 17580 | 0 | 0 | 0.00% | 0.00% | 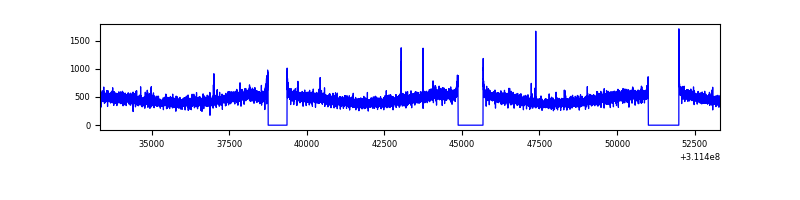 |
| D | 19978 | 17581 | 110 | 110 | 0.55% | 0.63% | 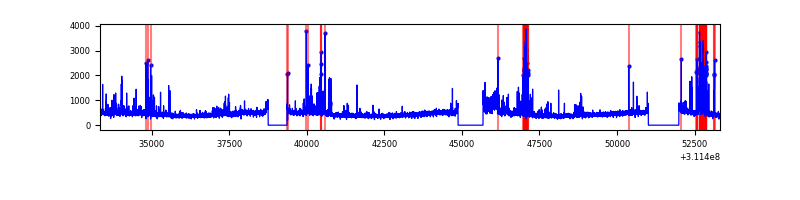 |
Top three noisy pixels from each quadrant. If the there are fewer than three noisy pixels in the level2.evt file, extra rows are filled as -1
| Pixel properties | Quadrant properties | ||||||
|---|---|---|---|---|---|---|---|
| Quadrant | DetID | PixID | Counts | Sigma | Mean | Median | Sigma |
| A | 4 | 2 | 144356 | 344.05 | 2065 | 2022 | 413.7 |
| A | 13 | 254 | 23408 | 51.69 | 2065 | 2022 | 413.7 |
| A | 3 | 1 | 18552 | 39.96 | 2065 | 2022 | 413.7 |
| B | 6 | 36 | 198323 | 506.25 | 2065 | 2012 | 387.8 |
| B | 12 | 111 | 47834 | 118.17 | 2065 | 2012 | 387.8 |
| B | 11 | 111 | 42790 | 105.16 | 2065 | 2012 | 387.8 |
| C | 14 | 238 | 311061 | 671.26 | 1981 | 1992 | 460.4 |
| C | 0 | 10 | 18293 | 35.4 | 1981 | 1992 | 460.4 |
| C | 8 | 128 | 14449 | 27.05 | 1981 | 1992 | 460.4 |
| D | 1 | 52 | 992848 | 2048.33 | 2001 | 1943 | 483.8 |
| D | 13 | 174 | 215907 | 442.29 | 2001 | 1943 | 483.8 |
| D | 2 | 234 | 69780 | 140.23 | 2001 | 1943 | 483.8 |
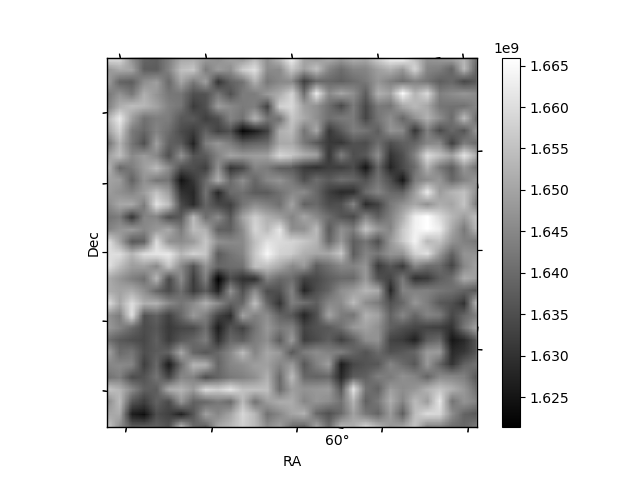
Histogram calculated using DETX and DETY for each event in the final _common_clean file
| Quadrant A | 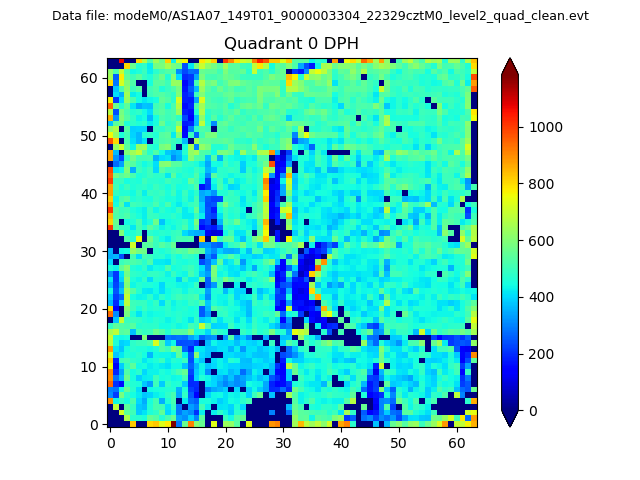 |
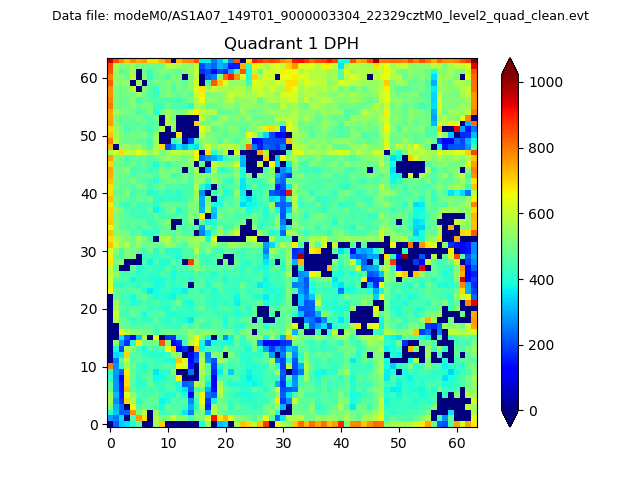 |
Quadrant B |
|---|---|---|---|
| Quadrant D |  |
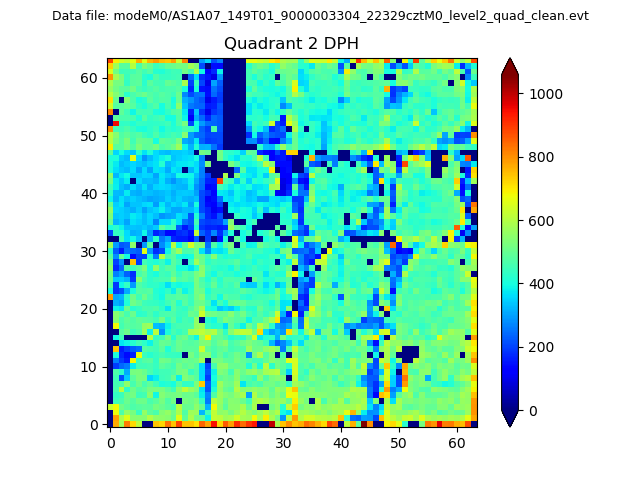 |
Quadrant C |
| Plot type | Count rate plots | Images |
|---|---|---|
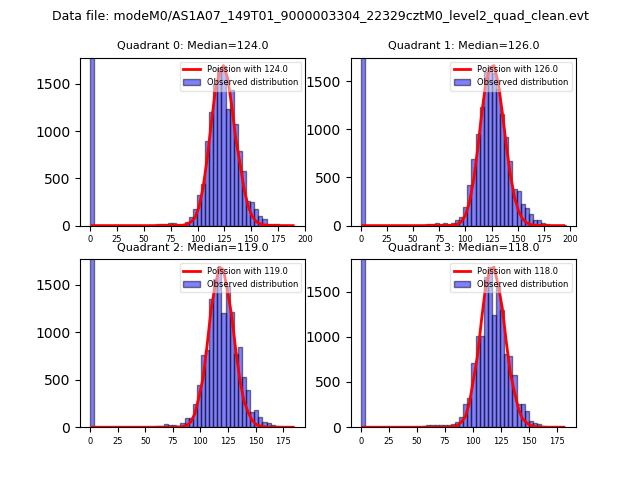
| Comparison with Poisson distribution Blue bars denote a histogram of data divided into 1 sec bins. Red curve is a Poisson curve with rate = median count rate of data. |
 |
 |
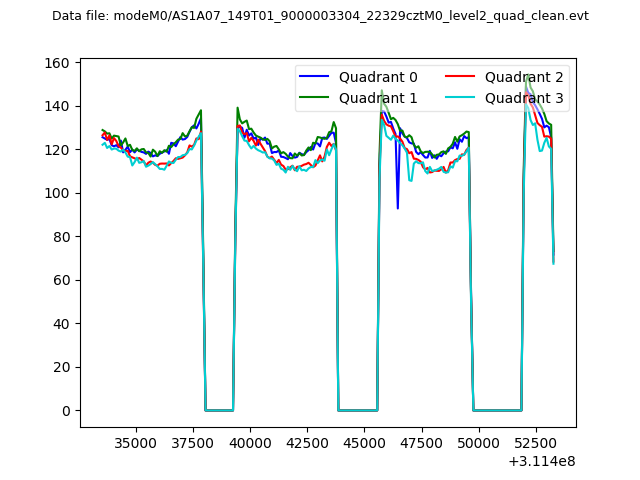
| Quadrant-wise count rates Data is divided into 100 sec bins |
 |
|
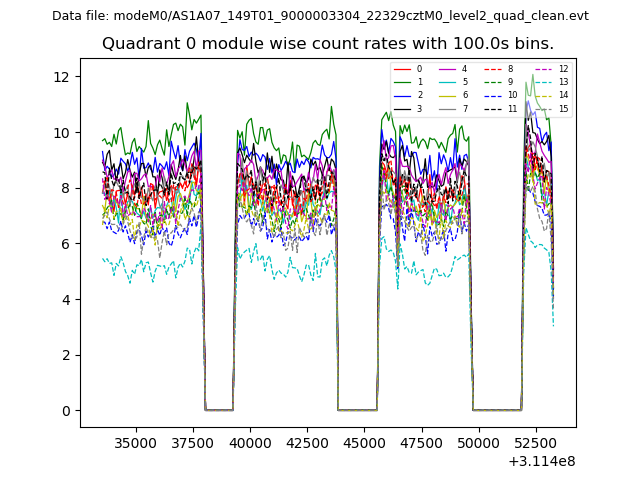
| Module-wise count rates for Quadrant A Data is divided into 100 sec bins |
 |
 |
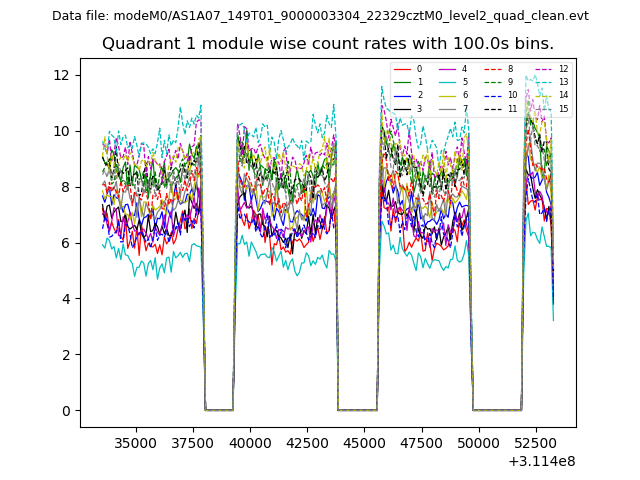
| Module-wise count rates for Quadrant B Data is divided into 100 sec bins |
 |
 |
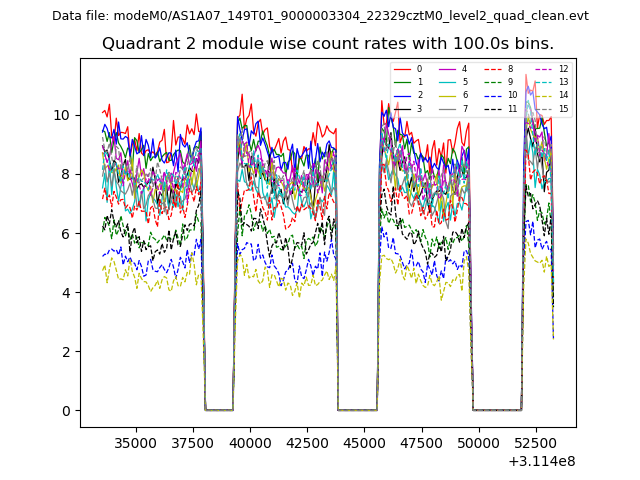
| Module-wise count rates for Quadrant C Data is divided into 100 sec bins |
 |
 |
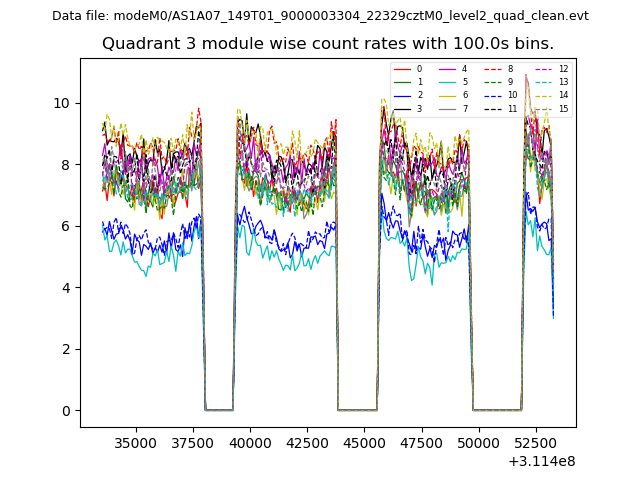
| Module-wise count rates for Quadrant D Data is divided into 100 sec bins |
 |
 |
| Parameter | Plot |
|---|---|
| CZT HV Monitor | 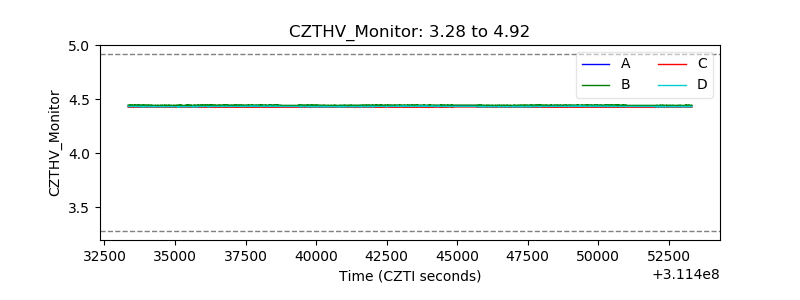 |
| D_VDD | 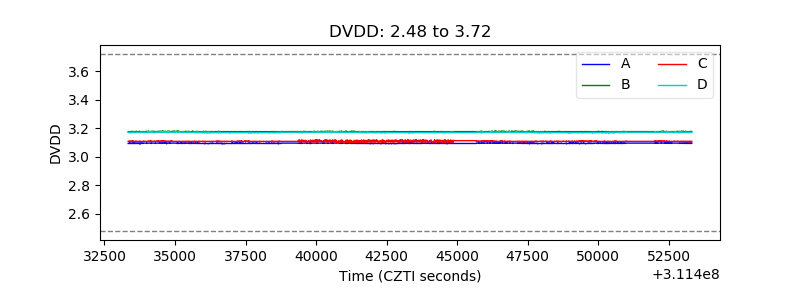 |
| Temperature 1 | 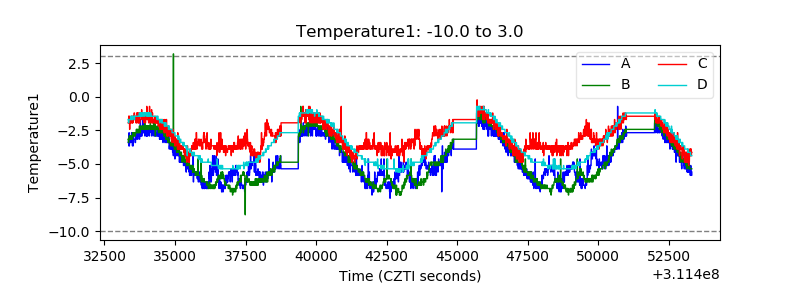 |
| Veto HV Monitor | 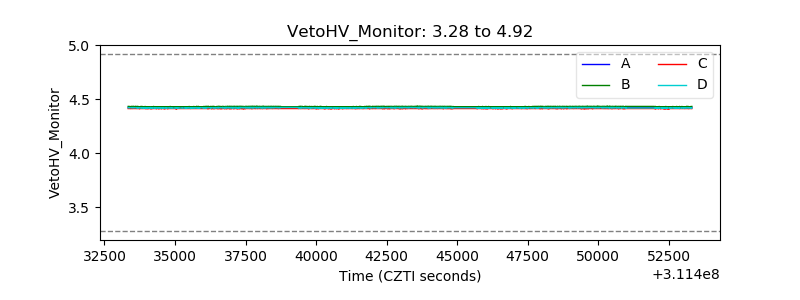 |
| Veto LLD | 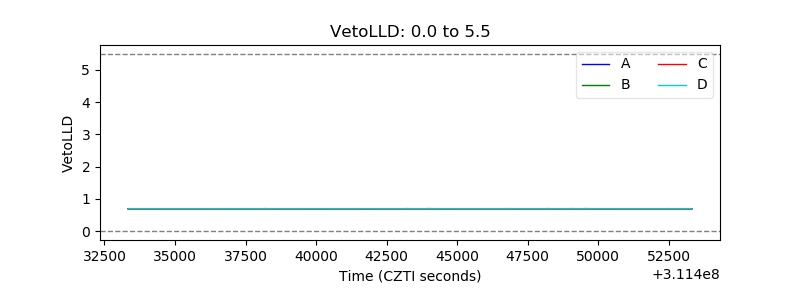 |
| Alpha Counter | 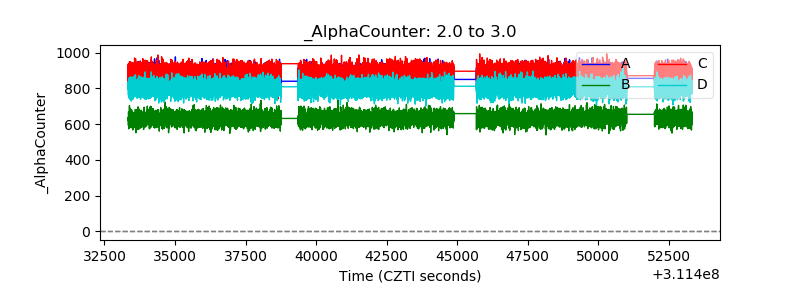 |
| _CPM_Rate | 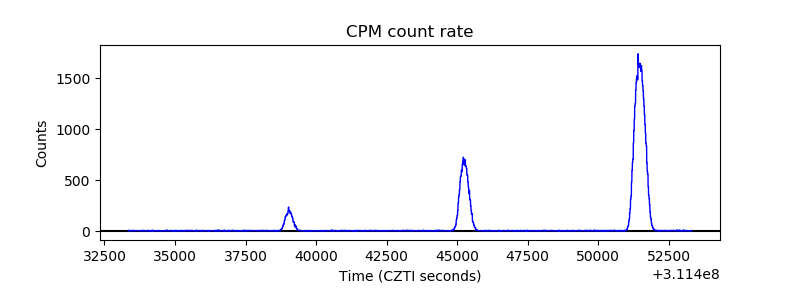 |
| CZT Counter | 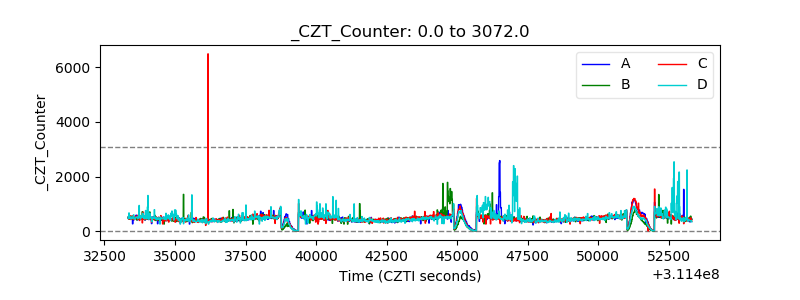 |
| +2.5 Volts monitor |  |
| +5 Volts monitor |  |
| _ROLL_ROT | 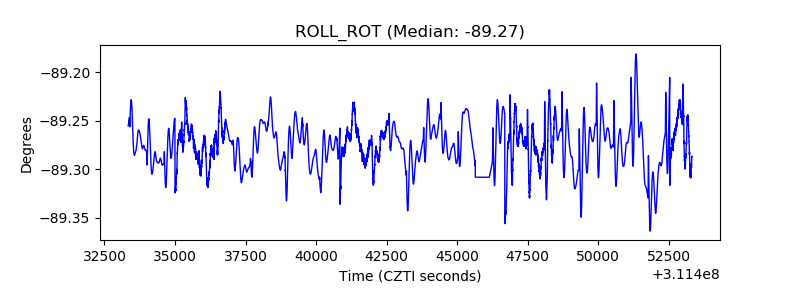 |
| _Roll_DEC | 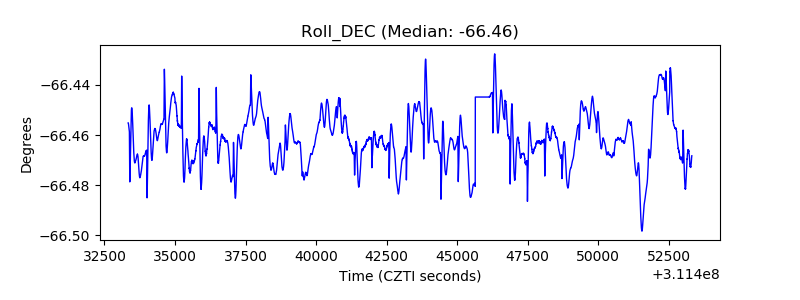 |
| _Roll_RA | 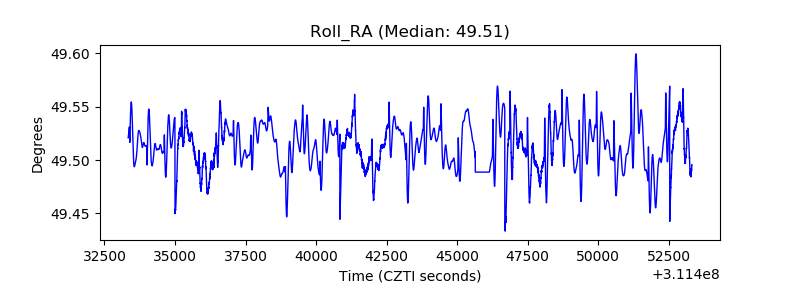 |
| Veto Counter | 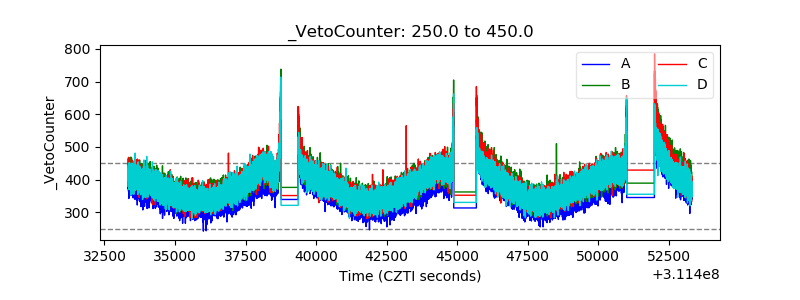 |