| Param | Original file | Final file |
|---|---|---|
| Filename | modeM0/AS1A07_149T01_9000003304_22332cztM0_level2.evt | modeM0/AS1A07_149T01_9000003304_22332cztM0_level2_quad_clean.evt |
| Size (bytes) | 452,813,760 | 112,374,720 |
| Size | 431.8 MB | 107.2 MB |
| Events in quadrant A | 3,146,618 | 745,357 |
| Events in quadrant B | 3,251,361 | 776,151 |
| Events in quadrant C | 3,247,298 | 725,833 |
| Events in quadrant D | 3,621,128 | 697,318 |
| Mode SS | |||
|---|---|---|---|
| Quadrant | BADHDUFLAG | Total packets | Discarded packets |
| A | 0 | 136 | 0 |
| B | 0 | 136 | 0 |
| C | 0 | 136 | 0 |
| D | 0 | 136 | 0 |
| Mode M0 | |||
|---|---|---|---|
| Quadrant | BADHDUFLAG | Total packets | Discarded packets |
| A | 0 | 13678 | 2 |
| B | 0 | 13859 | 2 |
| C | 0 | 13774 | 2 |
| D | 0 | 15376 | 2 |
| Mode M9 | |||
|---|---|---|---|
| Quadrant | BADHDUFLAG | Total packets | Discarded packets |
| A | 0 | 14 | 0 |
| B | 0 | 15 | 0 |
| C | 0 | 15 | 0 |
| D | 0 | 15 | 0 |
| Quadrant | Total seconds | Saturated seconds | Saturation percentage |
|---|---|---|---|
| A | 6572 | 15 | 0.228241% |
| B | 6572 | 22 | 0.334753% |
| C | 6572 | 51 | 0.776019% |
| D | 6571 | 31 | 0.471770% |
Noise dominated data is calculated using 1-second bins in cleaned event files. If a bin has >2000 counts, and if more than 50% of those come from <1% of pixels, then it is considered to be noise-dominated and hence unusable.
| Quadrant | # 1 sec bins | Bins with >0 counts | Bins with >2000 counts | High rate bins dominated by noise | Noise dominated (total time) | Noise dominated (detector-on time) | Marked lightcurve |
|---|---|---|---|---|---|---|---|
| A | 7812 | 6573 | 1 | 1 | 0.01% | 0.02% | 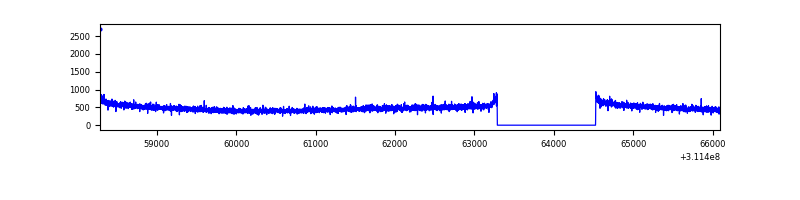 |
| B | 7812 | 6573 | 2 | 2 | 0.03% | 0.03% | 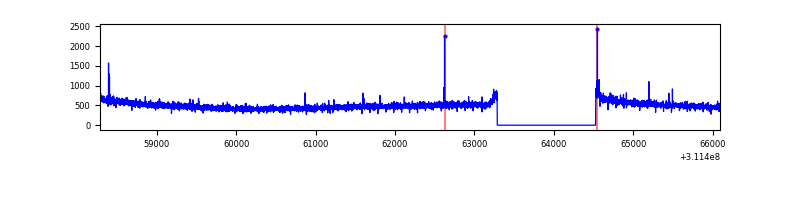 |
| C | 7812 | 6573 | 2 | 2 | 0.03% | 0.03% | 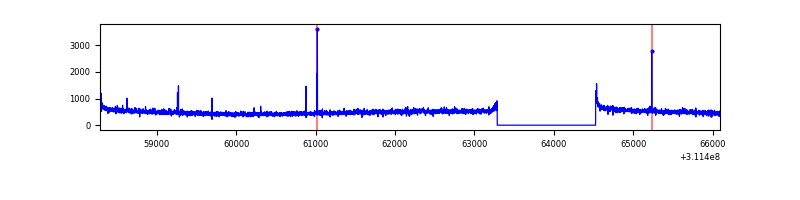 |
| D | 7811 | 6572 | 22 | 22 | 0.28% | 0.33% | 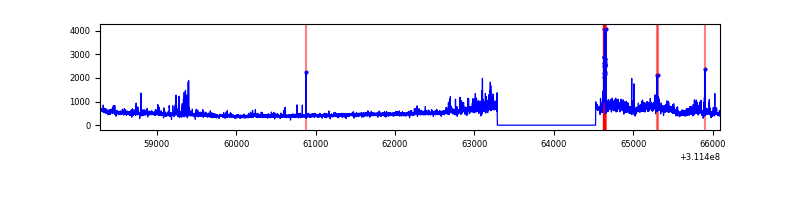 |
Top three noisy pixels from each quadrant. If the there are fewer than three noisy pixels in the level2.evt file, extra rows are filled as -1
| Pixel properties | Quadrant properties | ||||||
|---|---|---|---|---|---|---|---|
| Quadrant | DetID | PixID | Counts | Sigma | Mean | Median | Sigma |
| A | 13 | 254 | 8780 | 48.96 | 813 | 800 | 163.0 |
| A | 4 | 2 | 7151 | 38.96 | 813 | 800 | 163.0 |
| A | 0 | 226 | 7101 | 38.66 | 813 | 800 | 163.0 |
| B | 12 | 111 | 18274 | 113.91 | 825 | 806 | 153.3 |
| B | 11 | 111 | 15755 | 97.49 | 825 | 806 | 153.3 |
| B | 14 | 111 | 14222 | 87.49 | 825 | 806 | 153.3 |
| C | 14 | 238 | 127513 | 692.04 | 790 | 794 | 183.1 |
| C | 0 | 10 | 19382 | 101.51 | 790 | 794 | 183.1 |
| C | 3 | 9 | 11810 | 60.16 | 790 | 794 | 183.1 |
| D | 13 | 174 | 326756 | 1706.75 | 784 | 760 | 191.0 |
| D | 1 | 52 | 193774 | 1010.52 | 784 | 760 | 191.0 |
| D | 7 | 223 | 67697 | 350.45 | 784 | 760 | 191.0 |
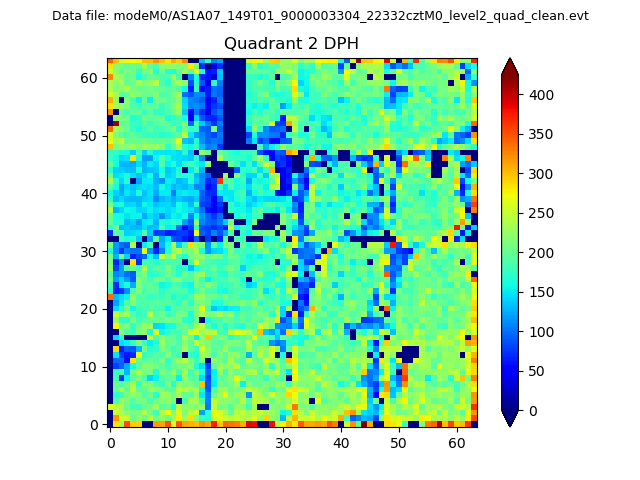
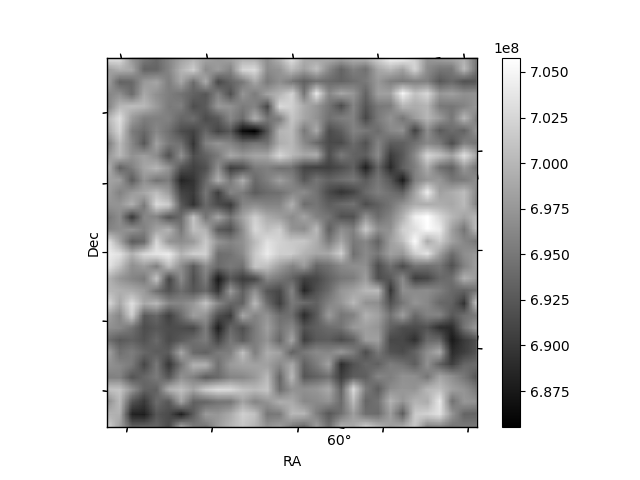
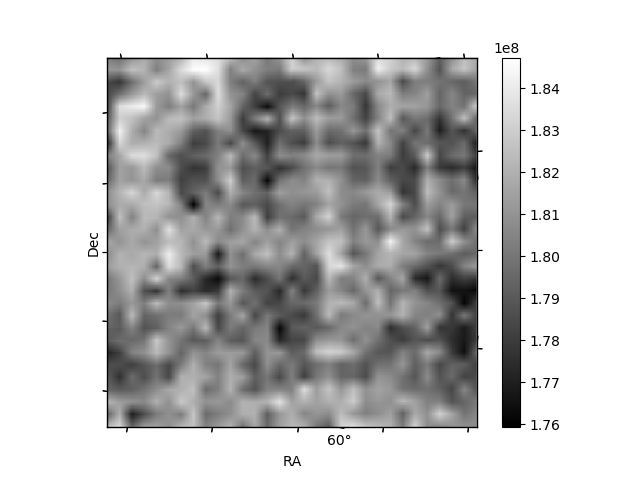
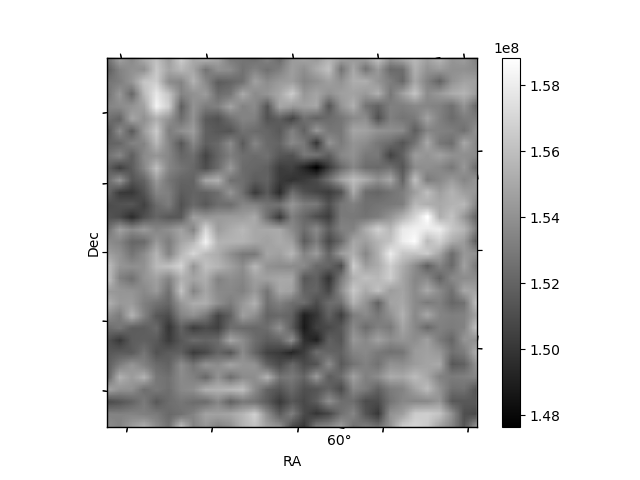
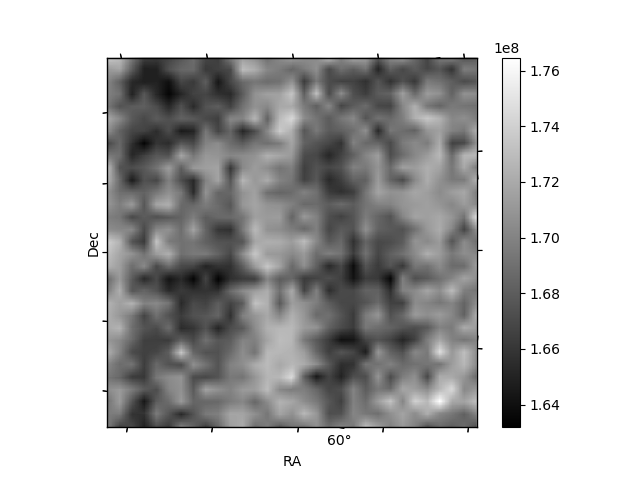
Histogram calculated using DETX and DETY for each event in the final _common_clean file
| Quadrant A | 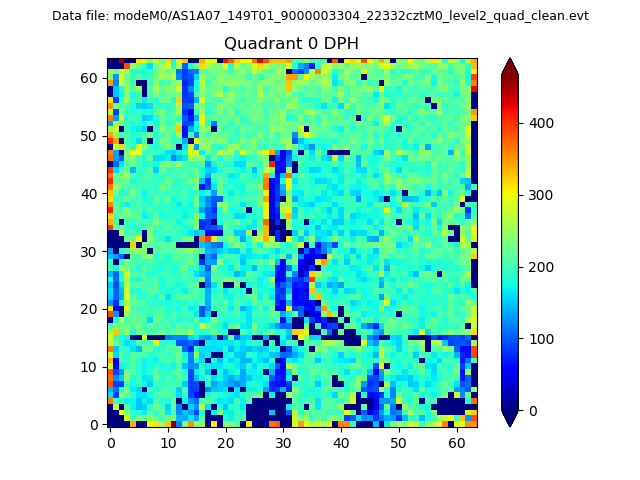 |
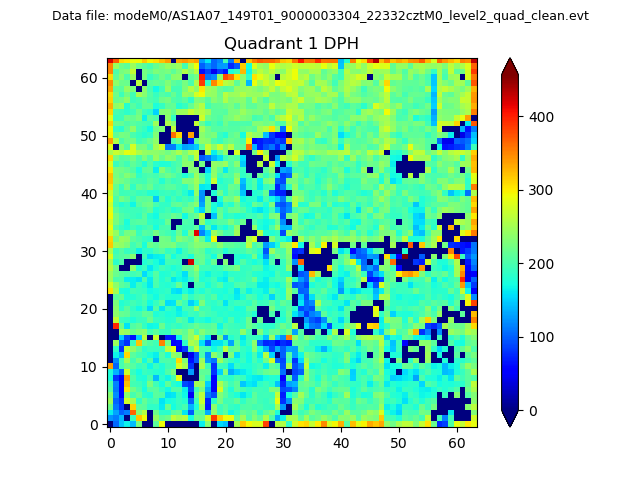 |
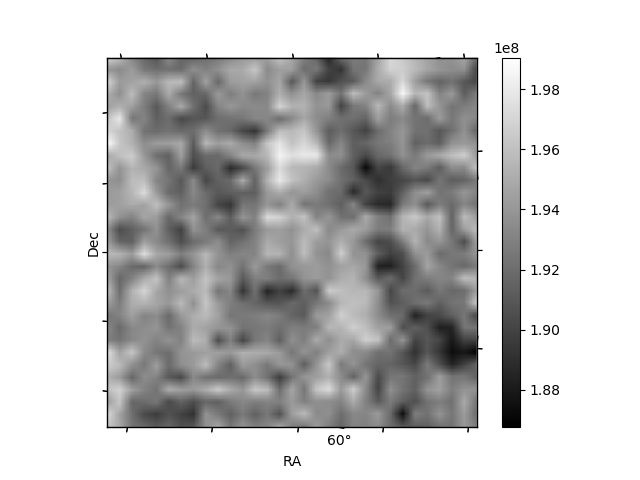
Quadrant B |
|---|---|---|---|
| Quadrant D | 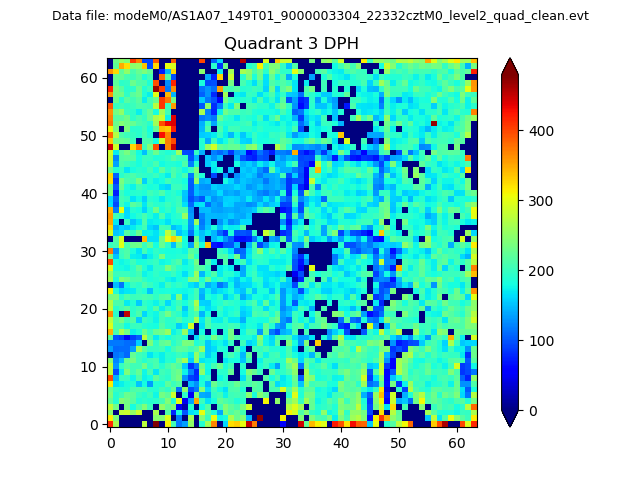 |
 |
Quadrant C |
| Plot type | Count rate plots | Images |
|---|---|---|
| Comparison with Poisson distribution Blue bars denote a histogram of data divided into 1 sec bins. Red curve is a Poisson curve with rate = median count rate of data. |
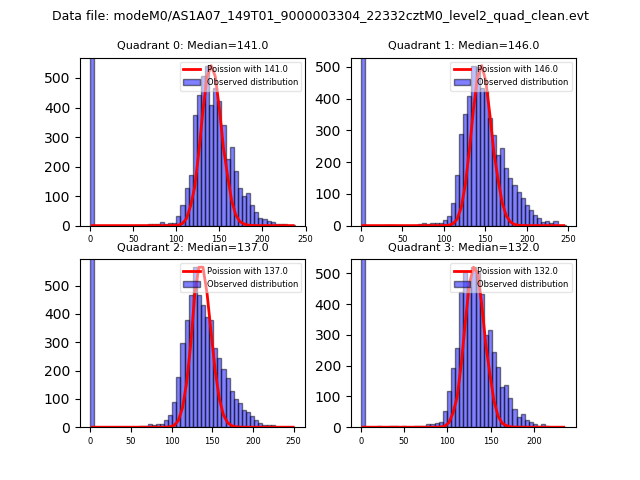 |
 |
| Quadrant-wise count rates Data is divided into 100 sec bins |
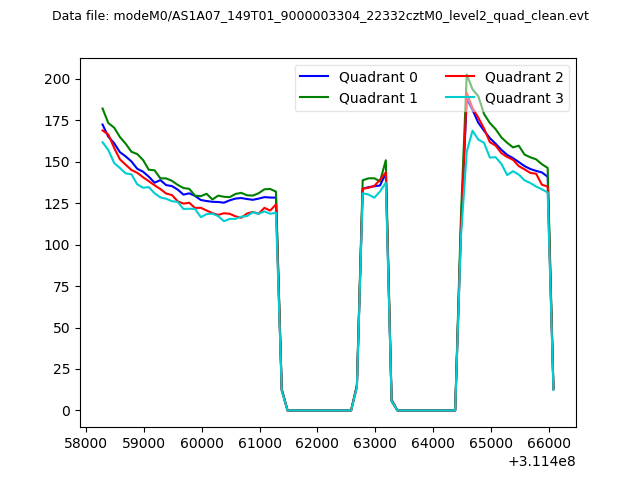 |
|
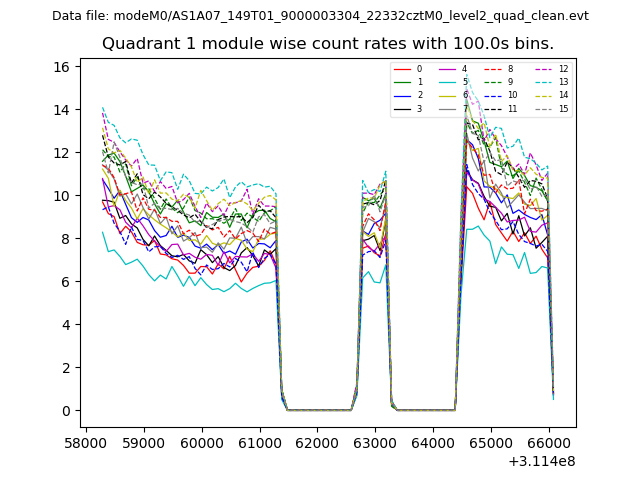
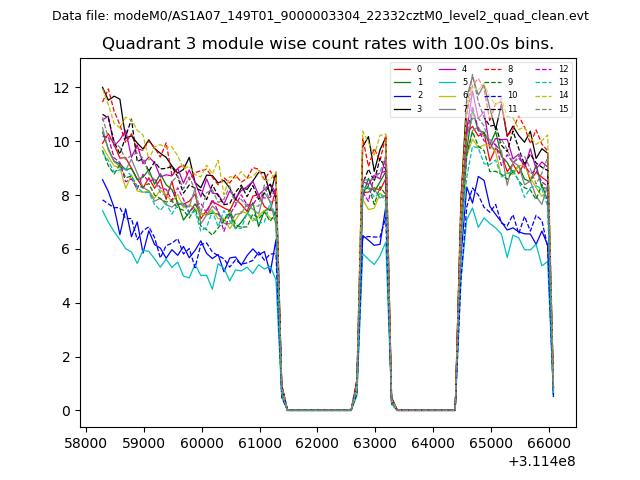
| Module-wise count rates for Quadrant A Data is divided into 100 sec bins |
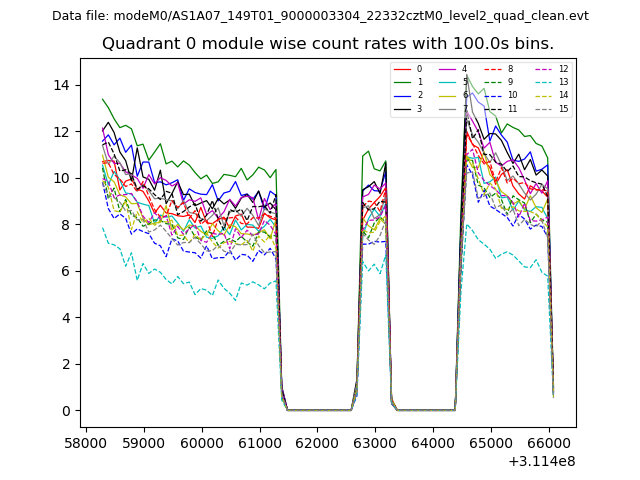 |
 |
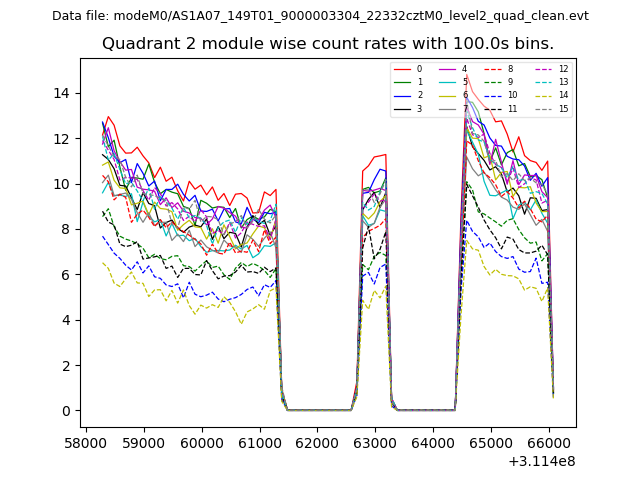
| Module-wise count rates for Quadrant B Data is divided into 100 sec bins |
 |
 |
| Module-wise count rates for Quadrant C Data is divided into 100 sec bins |
 |
 |
| Module-wise count rates for Quadrant D Data is divided into 100 sec bins |
 |
 |
| Parameter | Plot |
|---|---|
| CZT HV Monitor | 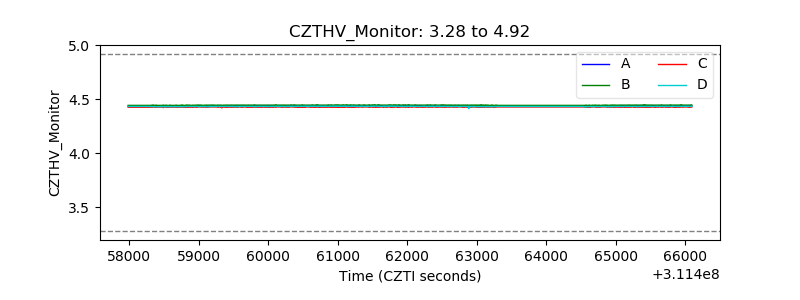 |
| D_VDD | 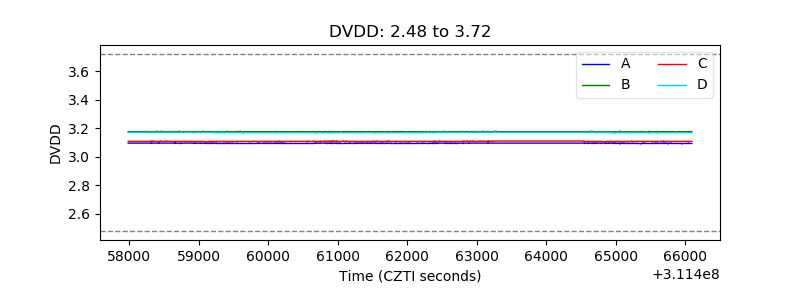 |
| Temperature 1 | 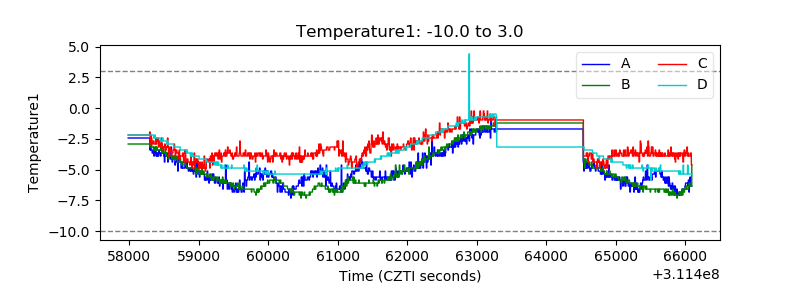 |
| Veto HV Monitor | 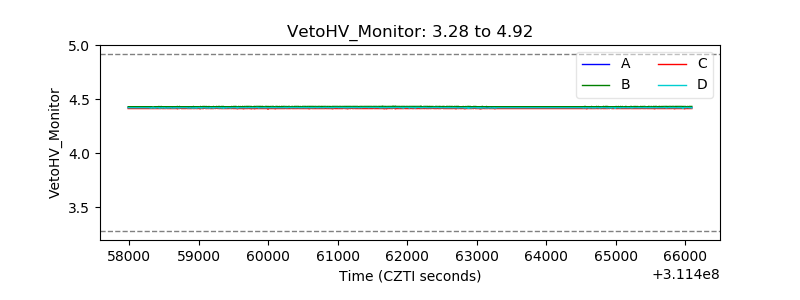 |
| Veto LLD | 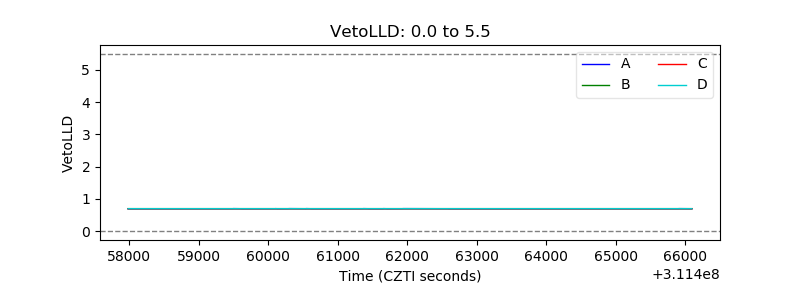 |
| Alpha Counter | 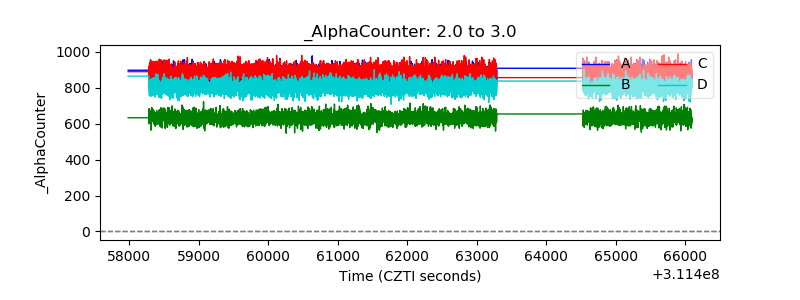 |
| _CPM_Rate | 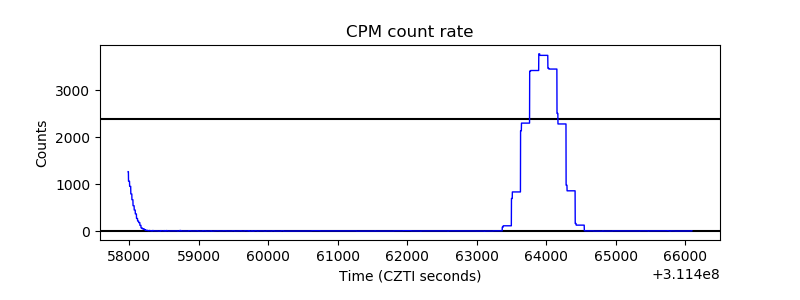 |
| CZT Counter | 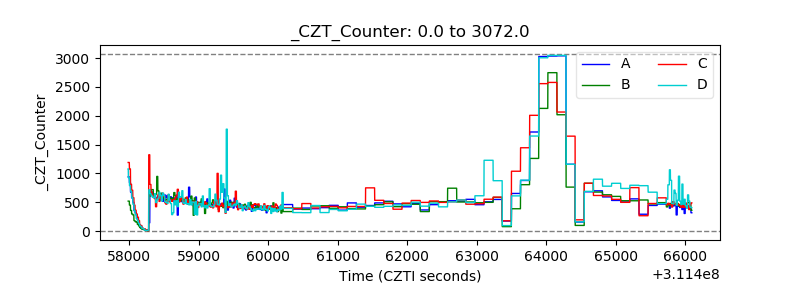 |
| +2.5 Volts monitor | 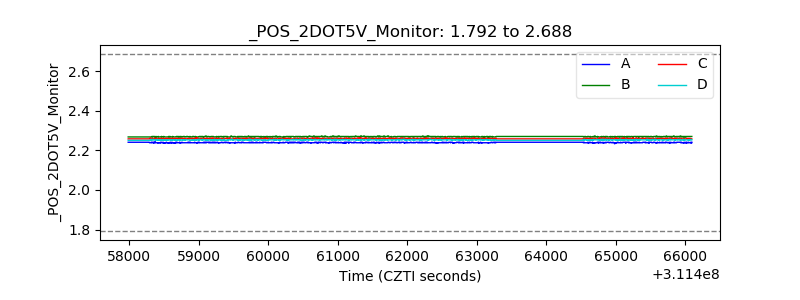 |
| +5 Volts monitor | 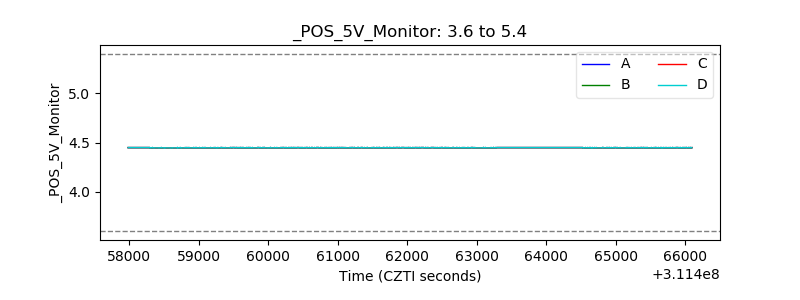 |
| _ROLL_ROT | 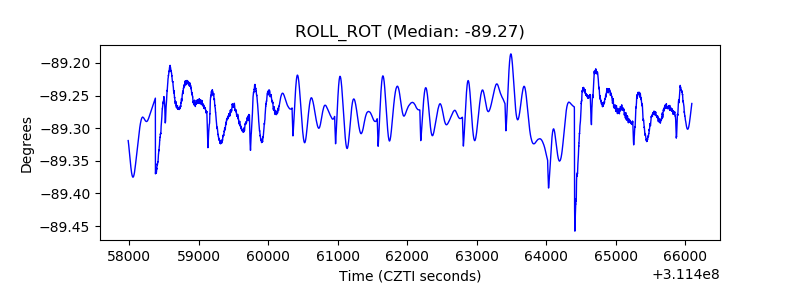 |
| _Roll_DEC | 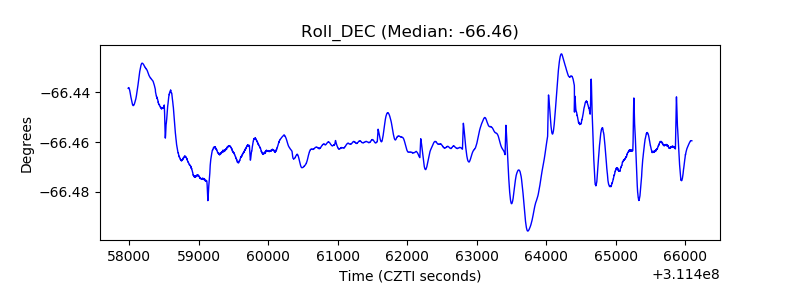 |
| _Roll_RA | 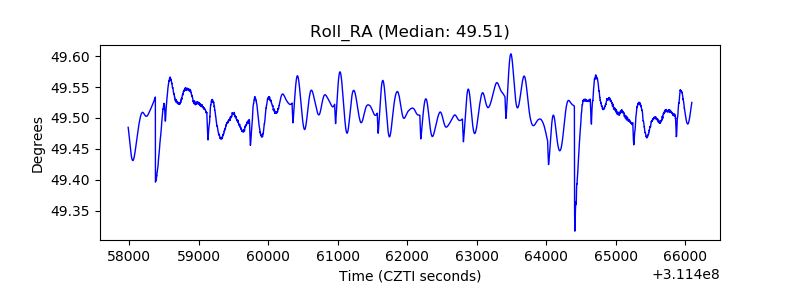 |
| Veto Counter | 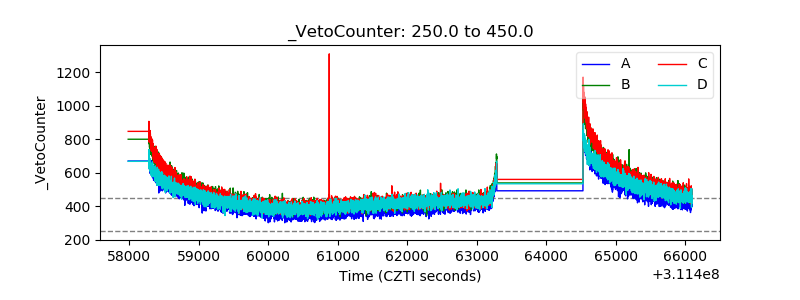 |