| Param | Original file | Final file |
|---|---|---|
| Filename | modeM0/AS1T03_147T01_9000003306cztM0_level2.fits | modeM0/AS1T03_147T01_9000003306cztM0_level2_quad_clean.evt |
| Size (bytes) | 749,364,480 | 655,061,760 |
| Size | 714.6 MB | 624.7 MB |
| Events in quadrant A | 4,594,006 | 3,831,462 |
| Events in quadrant B | 4,454,452 | 3,868,957 |
| Events in quadrant C | 4,537,396 | 3,630,653 |
| Events in quadrant D | 3,961,382 | 3,358,819 |
| Mode M9 | |||
|---|---|---|---|
| Quadrant | BADHDUFLAG | Total packets | Discarded packets |
| A | 0 | 123 | 0 |
| B | 0 | 123 | 0 |
| C | 0 | 123 | 0 |
| D | 0 | 123 | 0 |
| Mode SS | |||
|---|---|---|---|
| Quadrant | BADHDUFLAG | Total packets | Discarded packets |
| A | 0 | 1534 | 0 |
| B | 0 | 1534 | 0 |
| C | 0 | 1534 | 0 |
| D | 0 | 1534 | 0 |
| Mode M0 | |||
|---|---|---|---|
| Quadrant | BADHDUFLAG | Total packets | Discarded packets |
| A | 0 | 154964 | 0 |
| B | 0 | 156641 | 0 |
| C | 0 | 156269 | 0 |
| D | 0 | 166391 | 0 |
| Quadrant | Total seconds | Saturated seconds | Saturation percentage |
|---|---|---|---|
| A | 75065 | 817 | 1.088390% |
| B | 75065 | 1011 | 1.346833% |
| C | 75065 | 1218 | 1.622594% |
| D | 75065 | 1115 | 1.485379% |
Noise dominated data is calculated using 1-second bins in cleaned event files. If a bin has >2000 counts, and if more than 50% of those come from <1% of pixels, then it is considered to be noise-dominated and hence unusable.
| Quadrant | # 1 sec bins | Bins with >0 counts | Bins with >2000 counts | High rate bins dominated by noise | Noise dominated (total time) | Noise dominated (detector-on time) | Marked lightcurve |
|---|---|---|---|---|---|---|---|
| A | 87521 | 75061 | 0 | 0 | 0.00% | 0.00% |  |
| B | 87521 | 75060 | 0 | 0 | 0.00% | 0.00% | 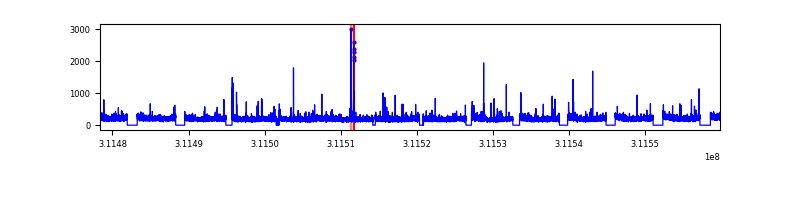 |
| C | 87521 | 75060 | 0 | 0 | 0.00% | 0.00% | 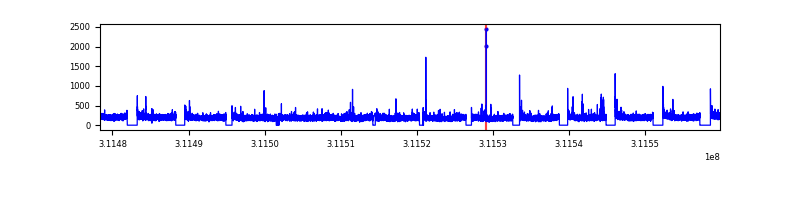 |
| D | 87521 | 75061 | 0 | 0 | 0.00% | 0.00% | 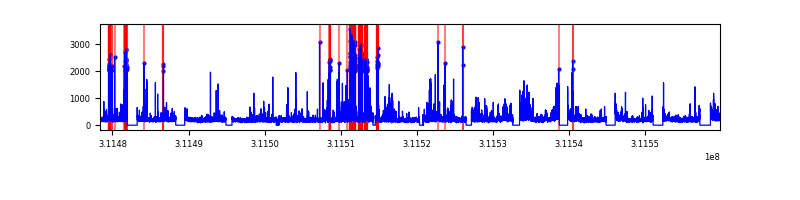 |
Top three noisy pixels from each quadrant. If the there are fewer than three noisy pixels in the level2.evt file, extra rows are filled as -1
| Pixel properties | Quadrant properties | ||||||
|---|---|---|---|---|---|---|---|
| Quadrant | DetID | PixID | Counts | Sigma | Mean | Median | Sigma |
| A | 0 | 29 | 4327 | 10.88 | 1194 | 1120 | 294.6 |
| A | 7 | 110 | 3809 | 9.13 | 1194 | 1120 | 294.6 |
| A | 9 | 19 | 3440 | 7.87 | 1194 | 1120 | 294.6 |
| B | 2 | 9 | 3587 | 10.67 | 1175 | 1121 | 231.1 |
| B | 2 | 8 | 3008 | 8.17 | 1175 | 1121 | 231.1 |
| B | 3 | 17 | 2991 | 8.09 | 1175 | 1121 | 231.1 |
| C | 12 | 241 | 3251 | 6.94 | 1198 | 1123 | 306.5 |
| C | 3 | 234 | 3237 | 6.9 | 1198 | 1123 | 306.5 |
| C | 9 | 209 | 3152 | 6.62 | 1198 | 1123 | 306.5 |
| D | 15 | 46 | 2942 | 6.38 | 1129 | 1032 | 299.4 |
| D | 3 | 14 | 2804 | 5.92 | 1129 | 1032 | 299.4 |
| D | 10 | 189 | 2794 | 5.89 | 1129 | 1032 | 299.4 |
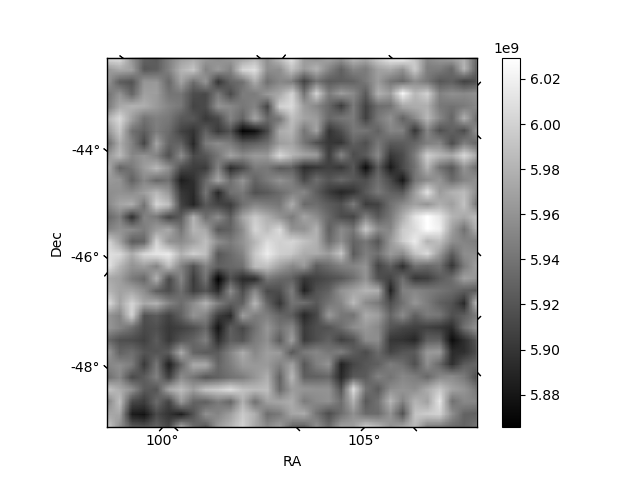
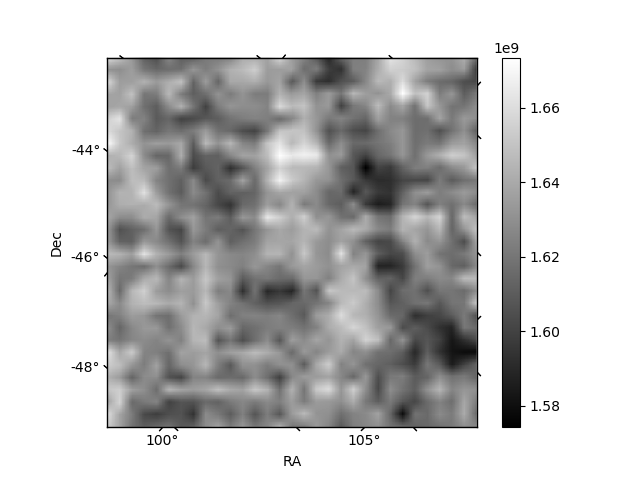
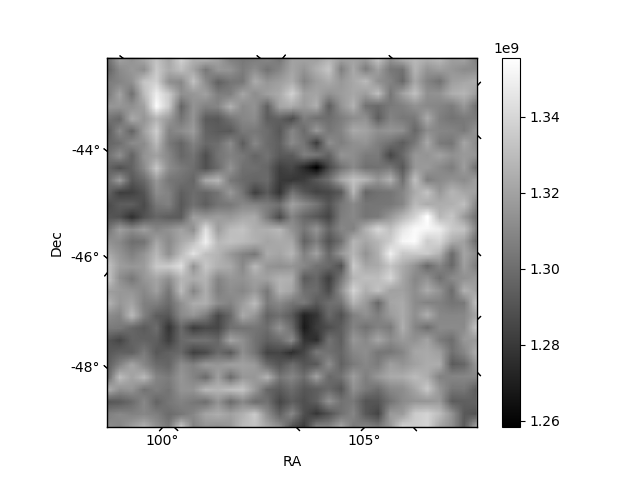
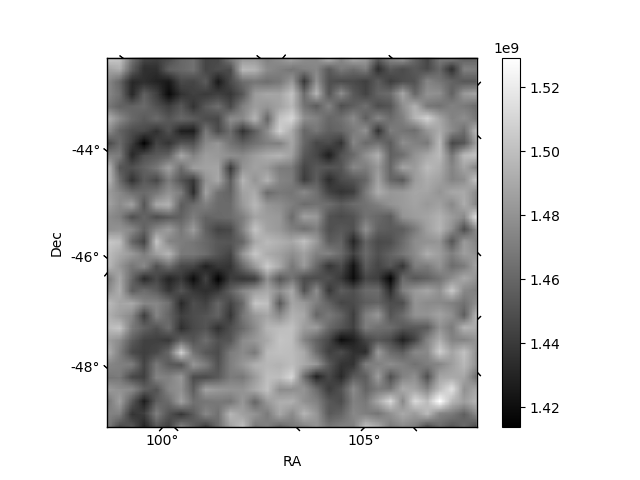
Histogram calculated using DETX and DETY for each event in the final _common_clean file
| Quadrant A | 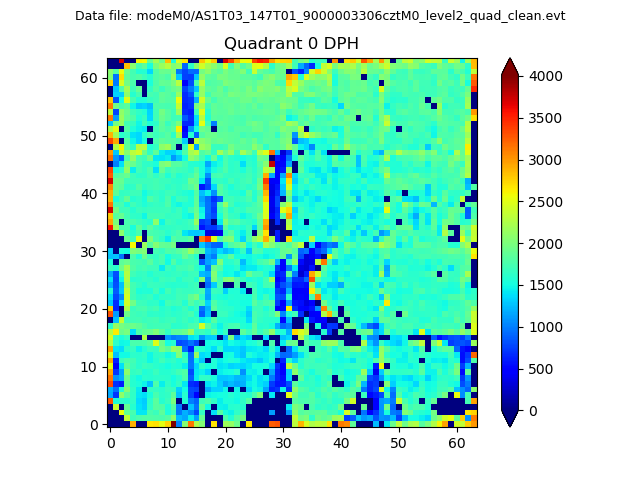 |
 |
Quadrant B |
|---|---|---|---|
| Quadrant D |  |
 |
Quadrant C |
| Plot type | Count rate plots | Images |
|---|---|---|
| Comparison with Poisson distribution Blue bars denote a histogram of data divided into 1 sec bins. Red curve is a Poisson curve with rate = median count rate of data. |
 |
 |
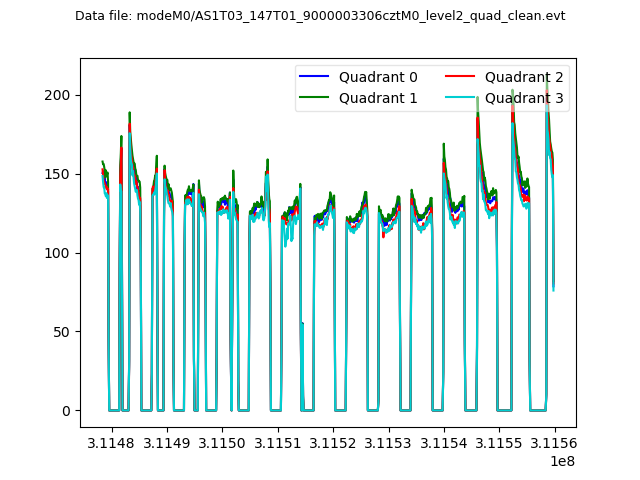
| Quadrant-wise count rates Data is divided into 100 sec bins |
 |
|
| Module-wise count rates for Quadrant A Data is divided into 100 sec bins |
 |
 |
| Module-wise count rates for Quadrant B Data is divided into 100 sec bins |
 |
 |
| Module-wise count rates for Quadrant C Data is divided into 100 sec bins |
 |
 |
| Module-wise count rates for Quadrant D Data is divided into 100 sec bins |
 |
 |
| Parameter | Plot |
|---|---|
| CZT HV Monitor |  |
| D_VDD |  |
| Temperature 1 | 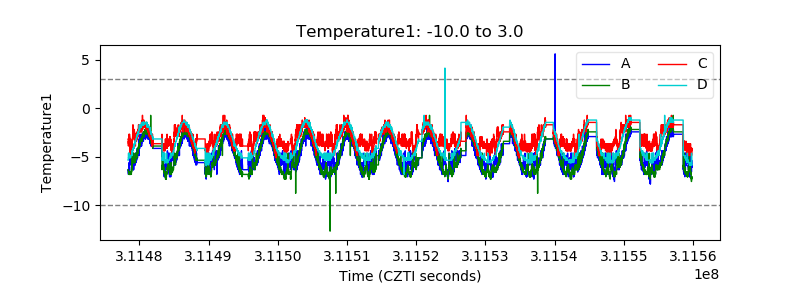 |
| Veto HV Monitor |  |
| Veto LLD | 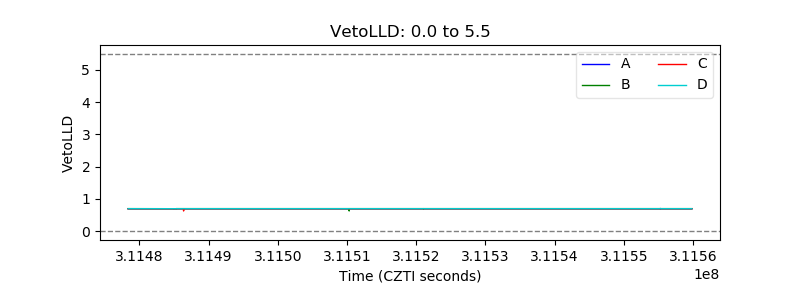 |
| Alpha Counter |  |
| _CPM_Rate |  |
| CZT Counter |  |
| +2.5 Volts monitor |  |
| +5 Volts monitor |  |
| _ROLL_ROT |  |
| _Roll_DEC | 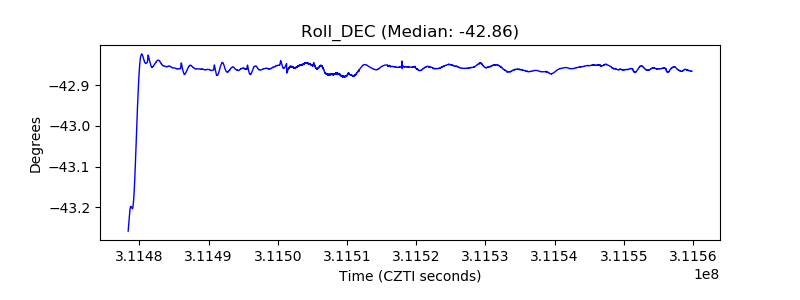 |
| _Roll_RA | 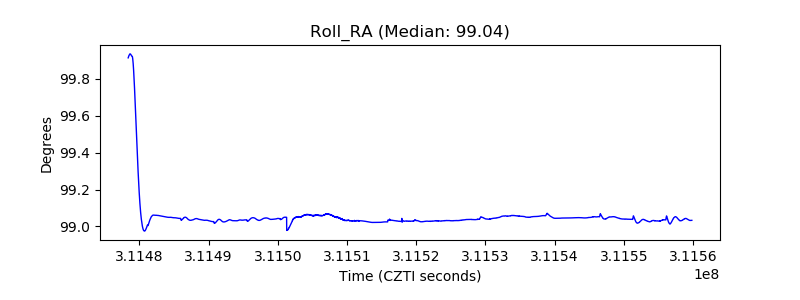 |
| Veto Counter |  |