| Param | Original file | Final file |
|---|---|---|
| Filename | modeM0/AS1T03_147T01_9000003306_22337cztM0_level2.evt | modeM0/AS1T03_147T01_9000003306_22337cztM0_level2_quad_clean.evt |
| Size (bytes) | 443,508,480 | 100,327,680 |
| Size | 423.0 MB | 95.7 MB |
| Events in quadrant A | 3,211,536 | 645,848 |
| Events in quadrant B | 3,288,619 | 662,245 |
| Events in quadrant C | 3,330,837 | 633,142 |
| Events in quadrant D | 3,137,775 | 622,762 |
| Mode M9 | |||
|---|---|---|---|
| Quadrant | BADHDUFLAG | Total packets | Discarded packets |
| A | 0 | 15 | 0 |
| B | 0 | 16 | 0 |
| C | 0 | 16 | 0 |
| D | 0 | 16 | 0 |
| Mode SS | |||
|---|---|---|---|
| Quadrant | BADHDUFLAG | Total packets | Discarded packets |
| A | 0 | 138 | 0 |
| B | 0 | 138 | 0 |
| C | 0 | 138 | 0 |
| D | 0 | 138 | 0 |
| Mode M0 | |||
|---|---|---|---|
| Quadrant | BADHDUFLAG | Total packets | Discarded packets |
| A | 0 | 13854 | 2 |
| B | 0 | 13985 | 2 |
| C | 0 | 13975 | 3 |
| D | 0 | 13889 | 2 |
| Quadrant | Total seconds | Saturated seconds | Saturation percentage |
|---|---|---|---|
| A | 6809 | 27 | 0.396534% |
| B | 6809 | 51 | 0.749009% |
| C | 6808 | 87 | 1.277908% |
| D | 6808 | 20 | 0.293772% |
Noise dominated data is calculated using 1-second bins in cleaned event files. If a bin has >2000 counts, and if more than 50% of those come from <1% of pixels, then it is considered to be noise-dominated and hence unusable.
| Quadrant | # 1 sec bins | Bins with >0 counts | Bins with >2000 counts | High rate bins dominated by noise | Noise dominated (total time) | Noise dominated (detector-on time) | Marked lightcurve |
|---|---|---|---|---|---|---|---|
| A | 7624 | 6810 | 0 | 0 | 0.00% | 0.00% | 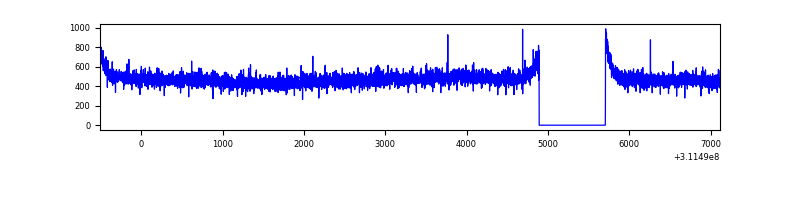 |
| B | 7624 | 6810 | 4 | 4 | 0.05% | 0.06% | 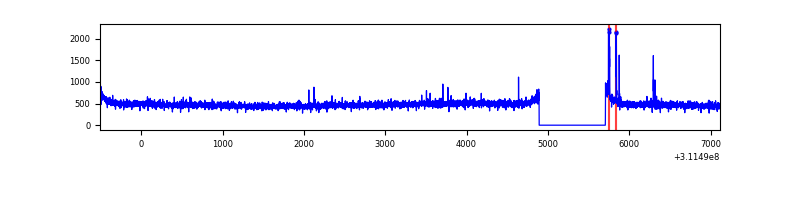 |
| C | 7623 | 6809 | 0 | 0 | 0.00% | 0.00% | 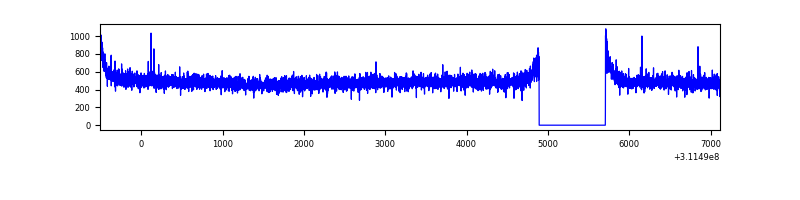 |
| D | 7623 | 6809 | 1 | 1 | 0.01% | 0.01% | 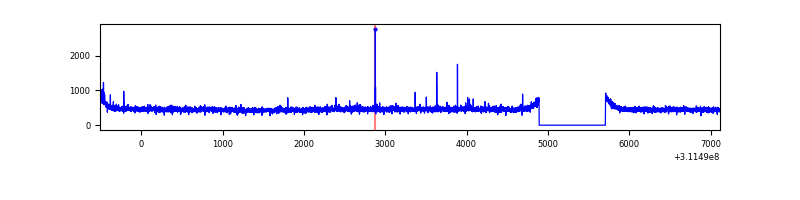 |
Top three noisy pixels from each quadrant. If the there are fewer than three noisy pixels in the level2.evt file, extra rows are filled as -1
| Pixel properties | Quadrant properties | ||||||
|---|---|---|---|---|---|---|---|
| Quadrant | DetID | PixID | Counts | Sigma | Mean | Median | Sigma |
| A | 13 | 254 | 9265 | 51.05 | 832 | 815 | 165.5 |
| A | 0 | 226 | 7154 | 38.3 | 832 | 815 | 165.5 |
| A | 3 | 137 | 7070 | 37.79 | 832 | 815 | 165.5 |
| B | 4 | 173 | 31001 | 190.95 | 833 | 812 | 158.1 |
| B | 12 | 111 | 19376 | 117.42 | 833 | 812 | 158.1 |
| B | 11 | 111 | 16973 | 102.22 | 833 | 812 | 158.1 |
| C | 14 | 238 | 129738 | 674.31 | 816 | 820 | 191.2 |
| C | 0 | 10 | 9774 | 46.83 | 816 | 820 | 191.2 |
| C | 9 | 54 | 7346 | 34.13 | 816 | 820 | 191.2 |
| D | 2 | 234 | 26813 | 130.18 | 823 | 798 | 199.8 |
| D | 13 | 174 | 9497 | 43.53 | 823 | 798 | 199.8 |
| D | 14 | 226 | 8181 | 36.95 | 823 | 798 | 199.8 |
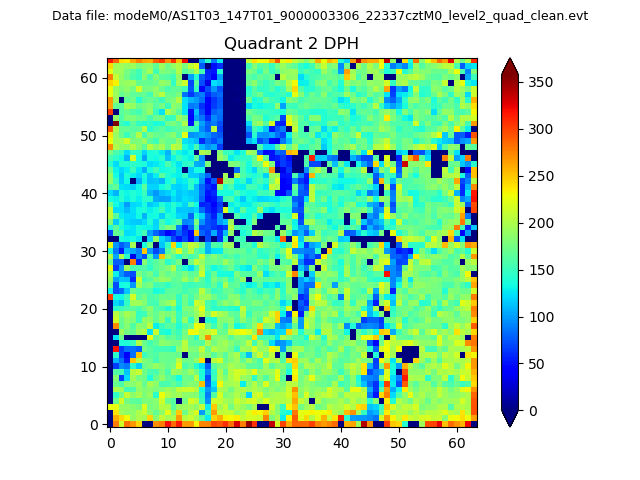
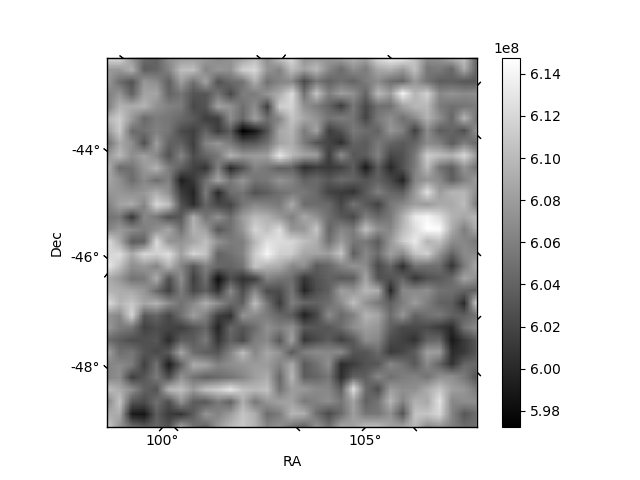
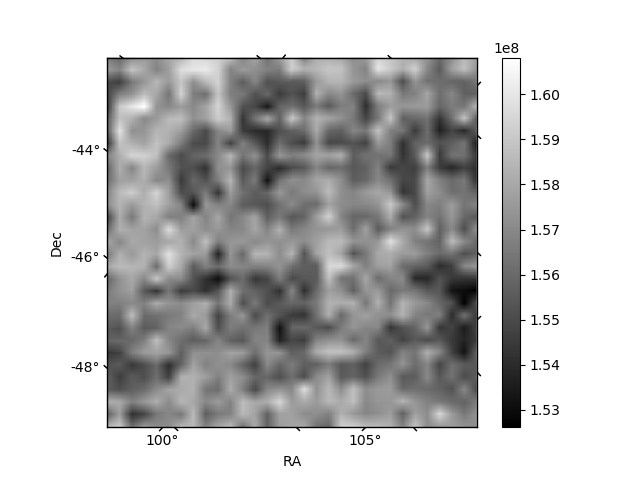
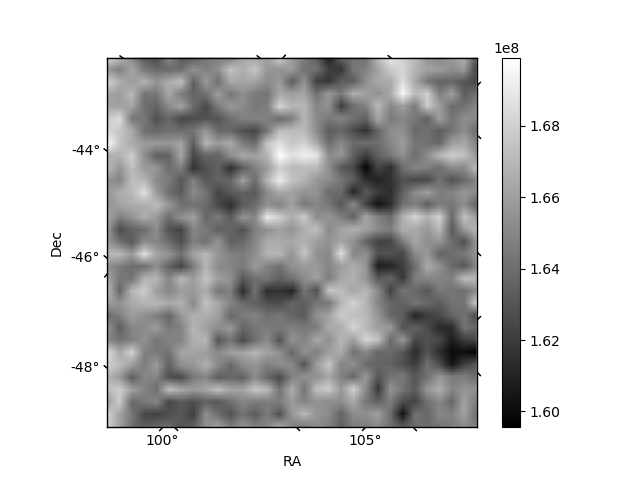
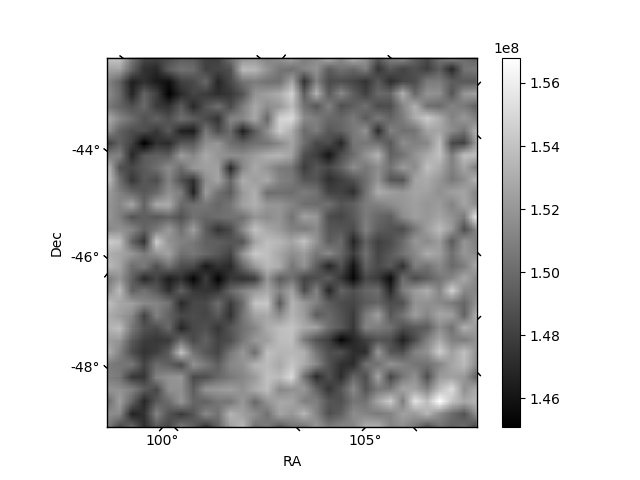
Histogram calculated using DETX and DETY for each event in the final _common_clean file
| Quadrant A | 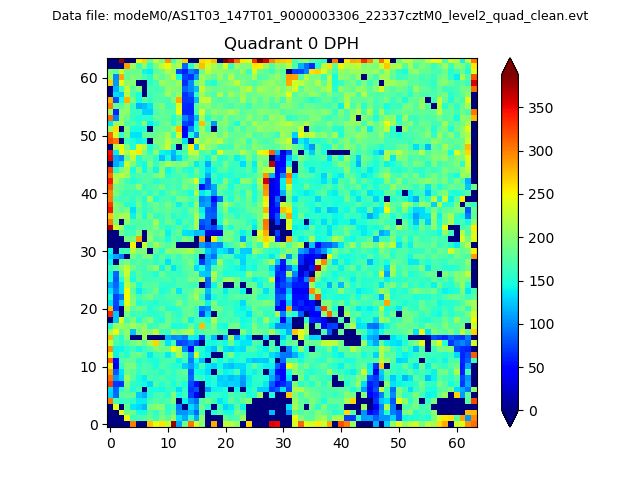 |
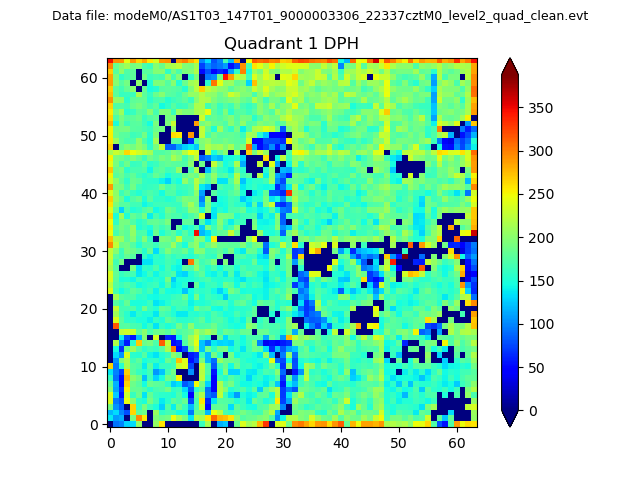 |
Quadrant B |
|---|---|---|---|
| Quadrant D | 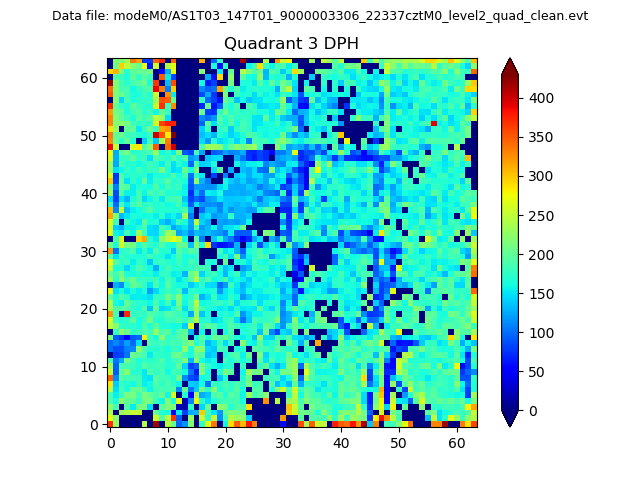 |
 |
Quadrant C |
| Plot type | Count rate plots | Images |
|---|---|---|
| Comparison with Poisson distribution Blue bars denote a histogram of data divided into 1 sec bins. Red curve is a Poisson curve with rate = median count rate of data. |
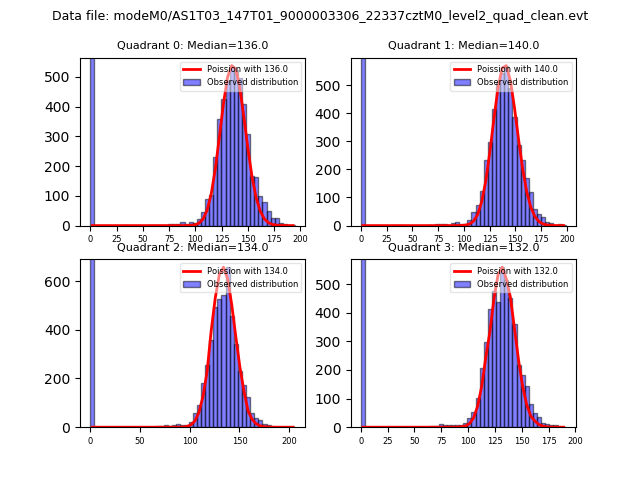 |
 |
| Quadrant-wise count rates Data is divided into 100 sec bins |
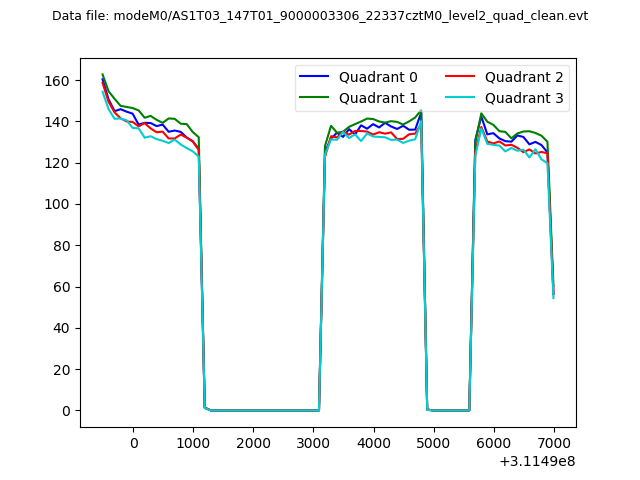 |
|
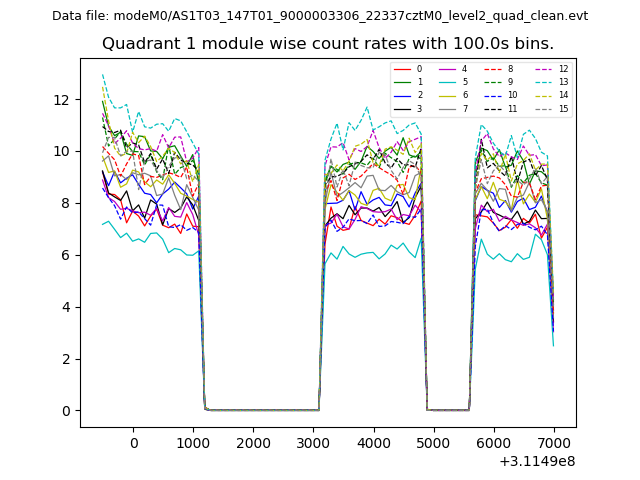
| Module-wise count rates for Quadrant A Data is divided into 100 sec bins |
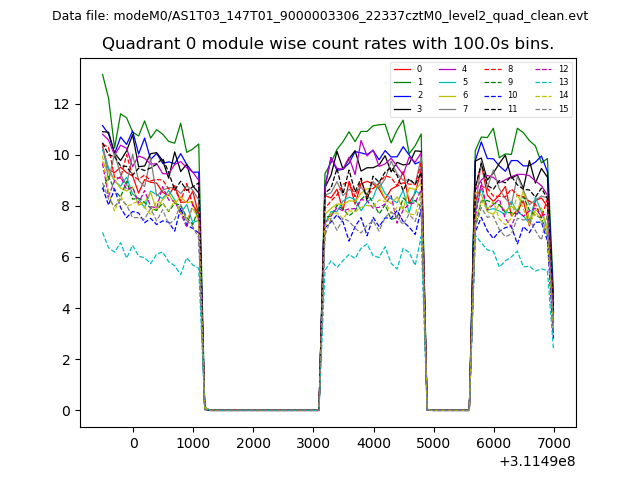 |
 |
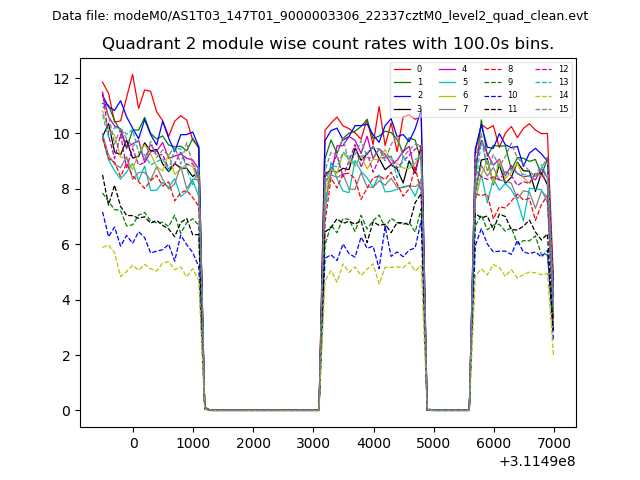
| Module-wise count rates for Quadrant B Data is divided into 100 sec bins |
 |
 |
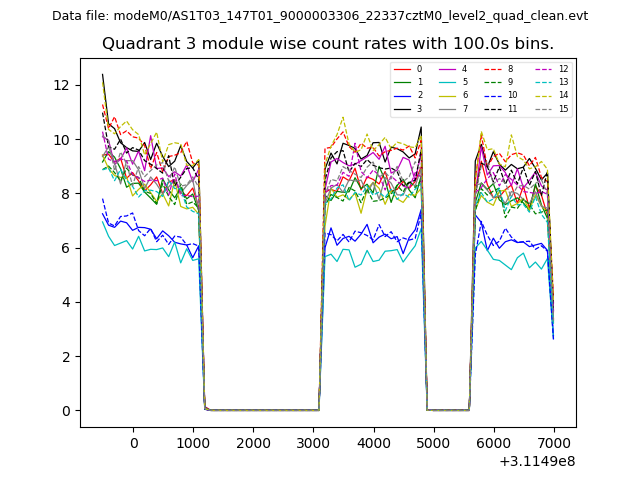
| Module-wise count rates for Quadrant C Data is divided into 100 sec bins |
 |
 |
| Module-wise count rates for Quadrant D Data is divided into 100 sec bins |
 |
 |
| Parameter | Plot |
|---|---|
| CZT HV Monitor | 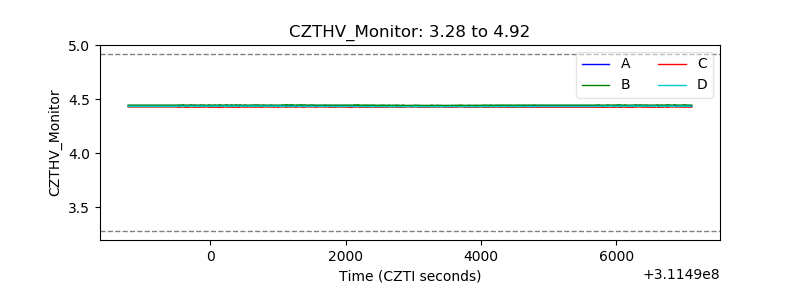 |
| D_VDD | 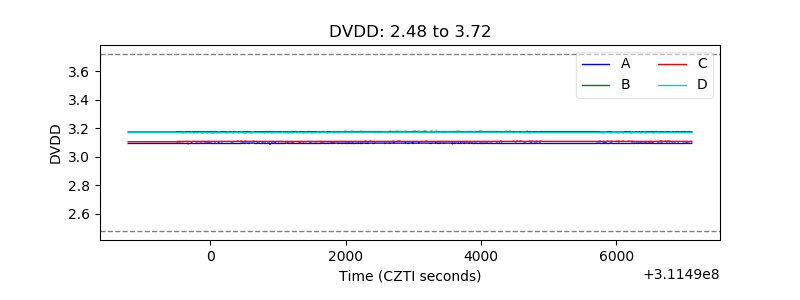 |
| Temperature 1 | 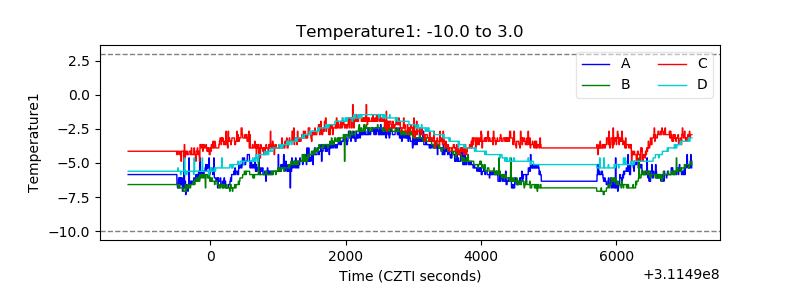 |
| Veto HV Monitor | 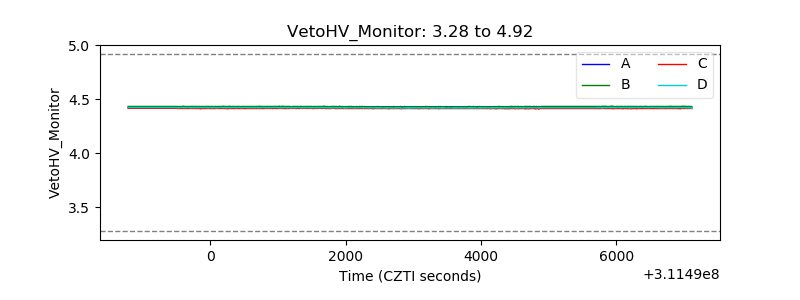 |
| Veto LLD | 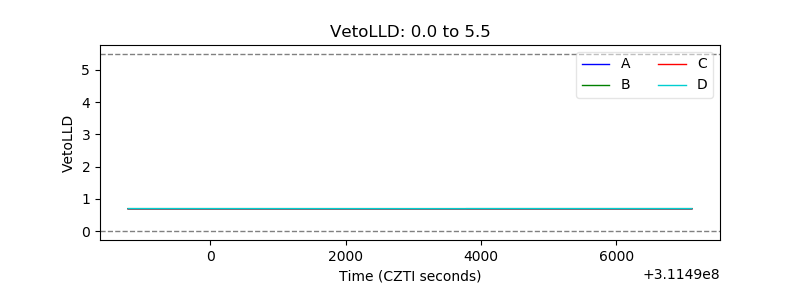 |
| Alpha Counter | 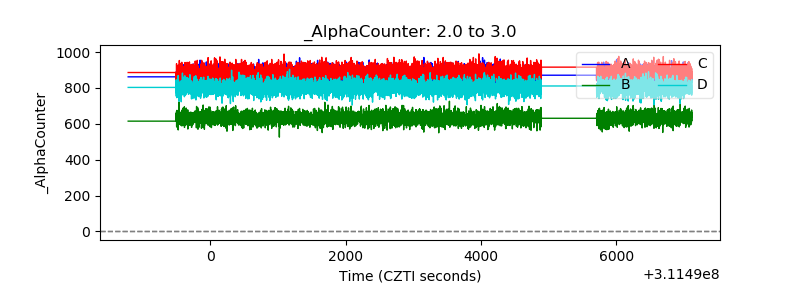 |
| _CPM_Rate | 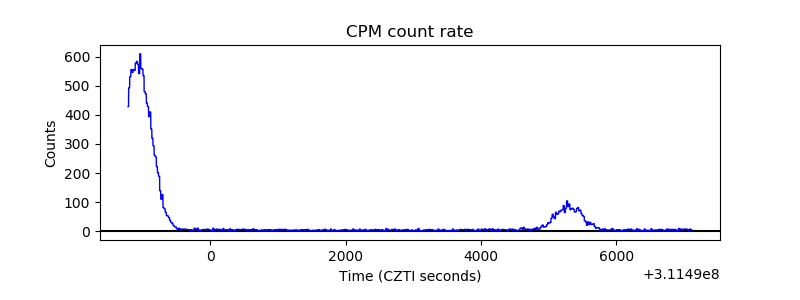 |
| CZT Counter | 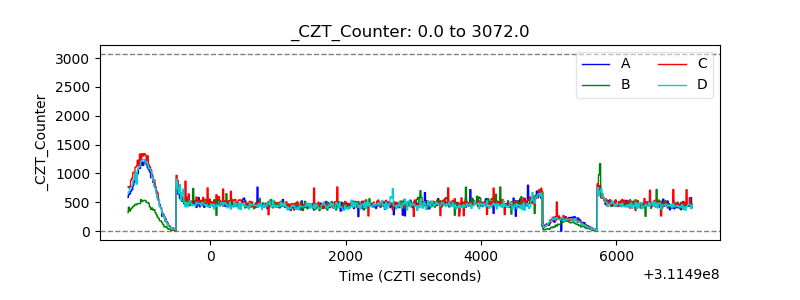 |
| +2.5 Volts monitor |  |
| +5 Volts monitor |  |
| _ROLL_ROT | 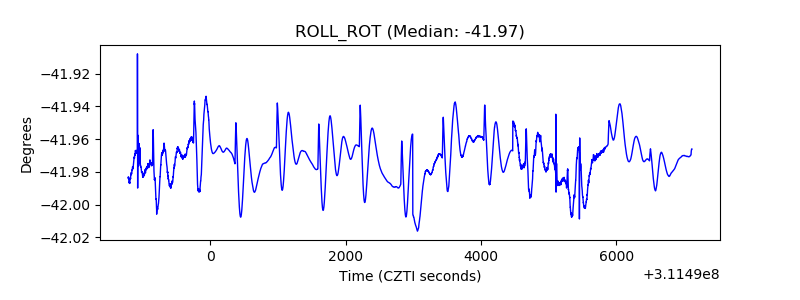 |
| _Roll_DEC | 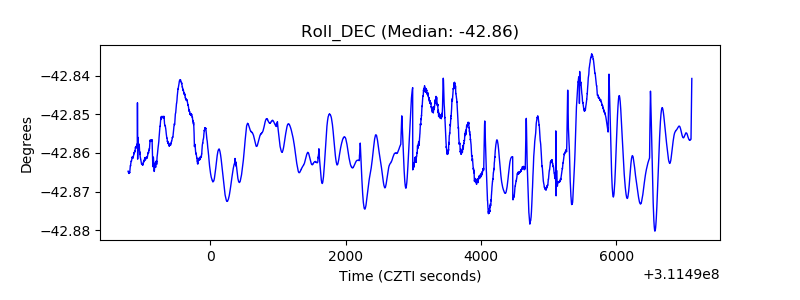 |
| _Roll_RA | 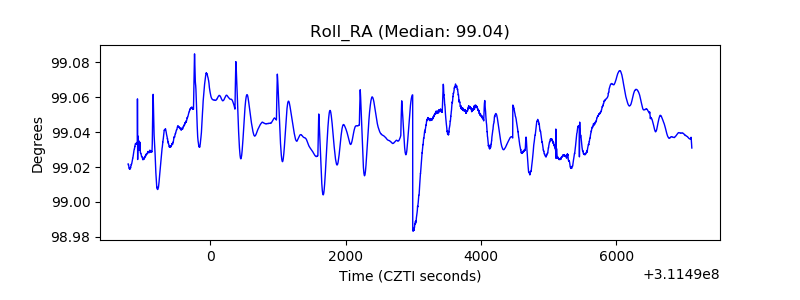 |
| Veto Counter | 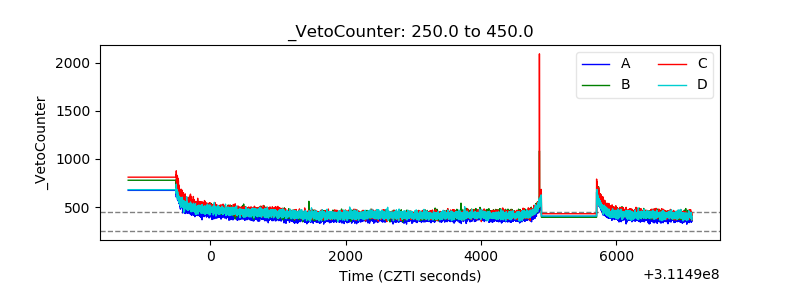 |