| Param | Original file | Final file |
|---|---|---|
| Filename | modeM0/AS1T03_147T01_9000003306_22339cztM0_level2.evt | modeM0/AS1T03_147T01_9000003306_22339cztM0_level2_quad_clean.evt |
| Size (bytes) | 525,539,520 | 99,144,000 |
| Size | 501.2 MB | 94.6 MB |
| Events in quadrant A | 3,774,261 | 619,131 |
| Events in quadrant B | 3,853,064 | 634,100 |
| Events in quadrant C | 3,856,777 | 604,794 |
| Events in quadrant D | 3,897,924 | 597,814 |
| Mode SS | |||
|---|---|---|---|
| Quadrant | BADHDUFLAG | Total packets | Discarded packets |
| A | 0 | 158 | 0 |
| B | 0 | 158 | 0 |
| C | 0 | 158 | 0 |
| D | 0 | 158 | 0 |
| Mode M0 | |||
|---|---|---|---|
| Quadrant | BADHDUFLAG | Total packets | Discarded packets |
| A | 0 | 16486 | 1 |
| B | 0 | 16541 | 1 |
| C | 0 | 16480 | 1 |
| D | 0 | 17124 | 1 |
| Quadrant | Total seconds | Saturated seconds | Saturation percentage |
|---|---|---|---|
| A | 7855 | 275 | 3.500955% |
| B | 7856 | 281 | 3.576884% |
| C | 7856 | 301 | 3.831466% |
| D | 7856 | 248 | 3.156823% |
Noise dominated data is calculated using 1-second bins in cleaned event files. If a bin has >2000 counts, and if more than 50% of those come from <1% of pixels, then it is considered to be noise-dominated and hence unusable.
| Quadrant | # 1 sec bins | Bins with >0 counts | Bins with >2000 counts | High rate bins dominated by noise | Noise dominated (total time) | Noise dominated (detector-on time) | Marked lightcurve |
|---|---|---|---|---|---|---|---|
| A | 7855 | 7855 | 0 | 0 | 0.00% | 0.00% | 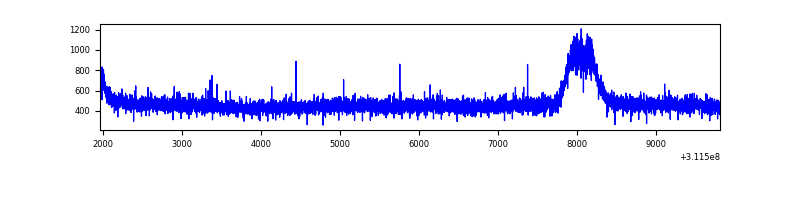 |
| B | 7856 | 7856 | 1 | 1 | 0.01% | 0.01% | 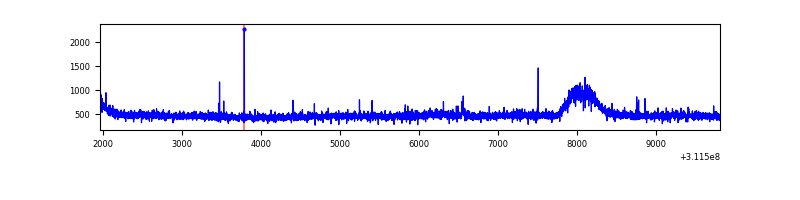 |
| C | 7856 | 7856 | 0 | 0 | 0.00% | 0.00% |  |
| D | 7856 | 7856 | 26 | 26 | 0.33% | 0.33% | 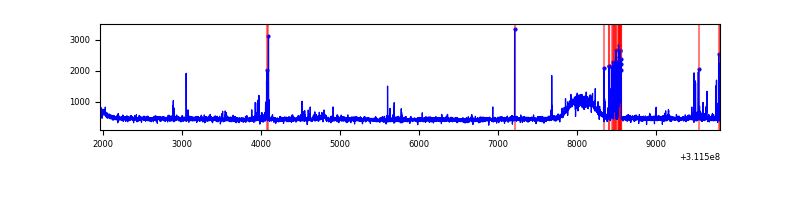 |
Top three noisy pixels from each quadrant. If the there are fewer than three noisy pixels in the level2.evt file, extra rows are filled as -1
| Pixel properties | Quadrant properties | ||||||
|---|---|---|---|---|---|---|---|
| Quadrant | DetID | PixID | Counts | Sigma | Mean | Median | Sigma |
| A | 13 | 254 | 10235 | 46.45 | 979 | 954 | 199.8 |
| A | 3 | 137 | 8852 | 39.53 | 979 | 954 | 199.8 |
| A | 0 | 226 | 8278 | 36.65 | 979 | 954 | 199.8 |
| B | 12 | 111 | 23649 | 119.4 | 975 | 947 | 190.1 |
| B | 11 | 111 | 21240 | 106.73 | 975 | 947 | 190.1 |
| B | 3 | 64 | 19148 | 95.73 | 975 | 947 | 190.1 |
| C | 14 | 238 | 147445 | 647.95 | 951 | 957 | 226.1 |
| C | 13 | 61 | 6640 | 25.14 | 951 | 957 | 226.1 |
| C | 7 | 247 | 2945 | 8.79 | 951 | 957 | 226.1 |
| D | 1 | 52 | 196016 | 822.68 | 968 | 939 | 237.1 |
| D | 2 | 234 | 34868 | 143.09 | 968 | 939 | 237.1 |
| D | 13 | 172 | 28880 | 117.83 | 968 | 939 | 237.1 |
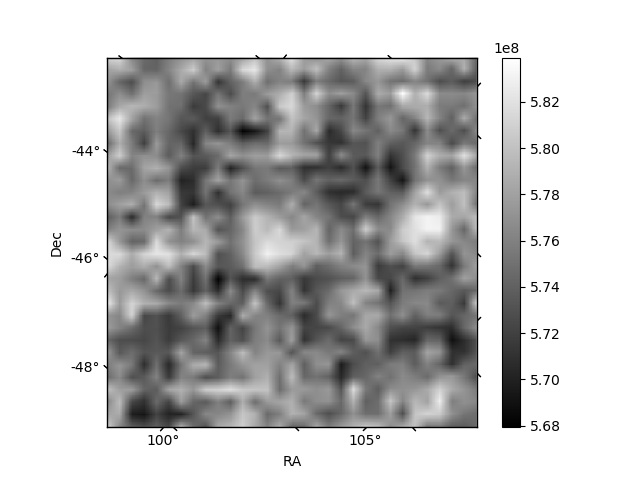
Histogram calculated using DETX and DETY for each event in the final _common_clean file
| Quadrant A | 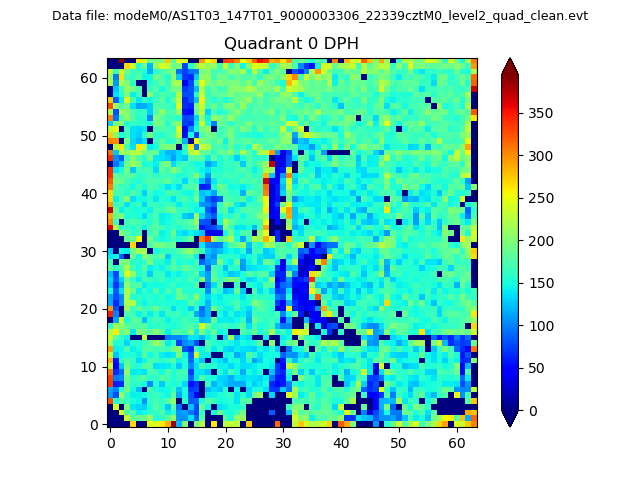 |
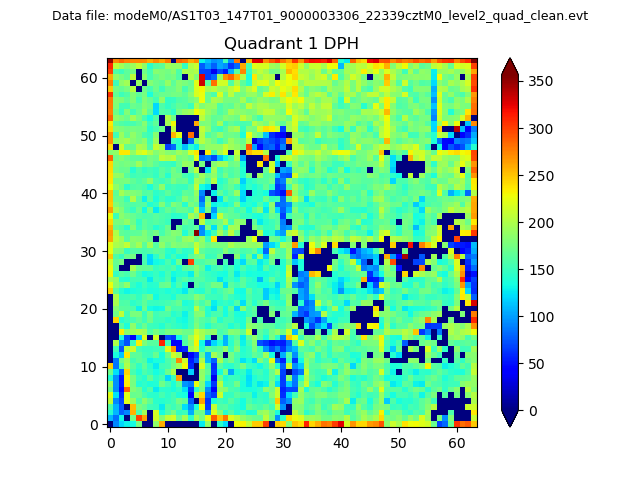 |
Quadrant B |
|---|---|---|---|
| Quadrant D | 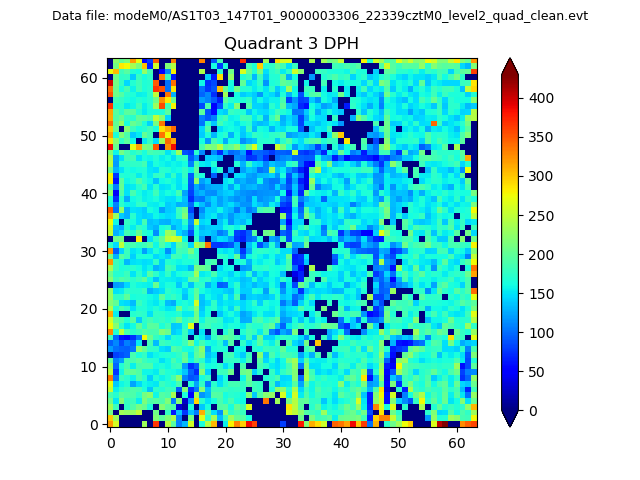 |
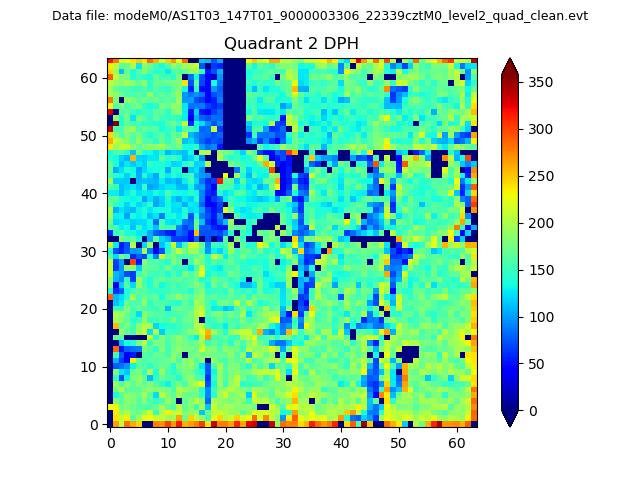 |
Quadrant C |
| Plot type | Count rate plots | Images |
|---|---|---|
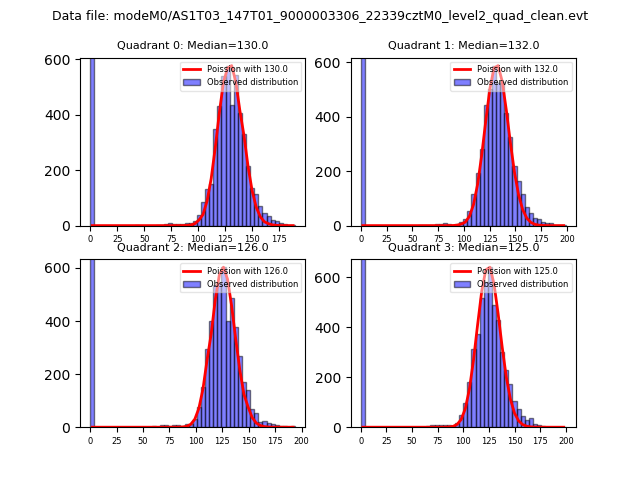
| Comparison with Poisson distribution Blue bars denote a histogram of data divided into 1 sec bins. Red curve is a Poisson curve with rate = median count rate of data. |
 |
 |
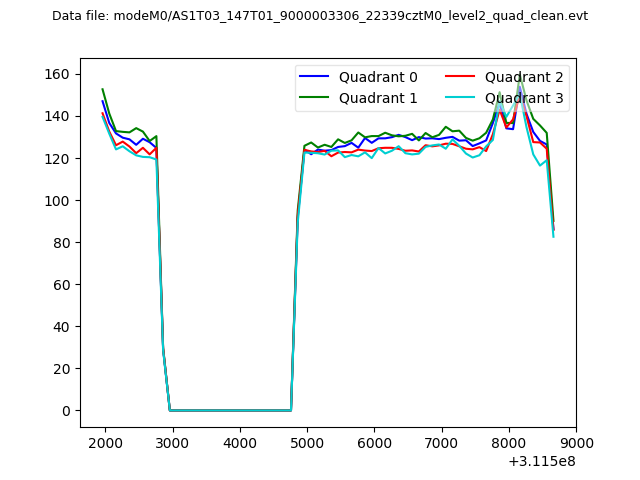
| Quadrant-wise count rates Data is divided into 100 sec bins |
 |
|
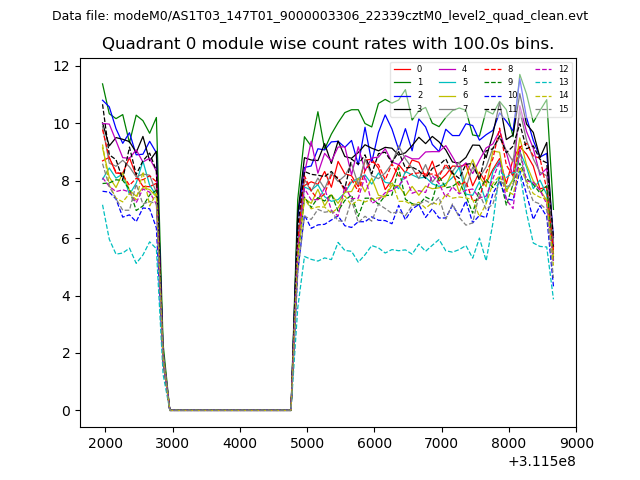
| Module-wise count rates for Quadrant A Data is divided into 100 sec bins |
 |
 |
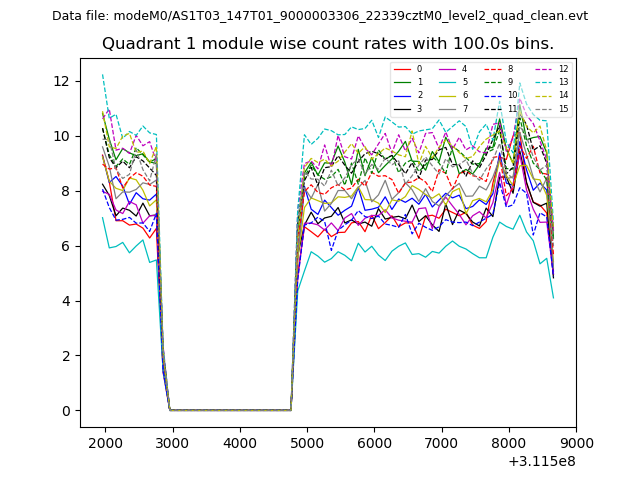
| Module-wise count rates for Quadrant B Data is divided into 100 sec bins |
 |
 |
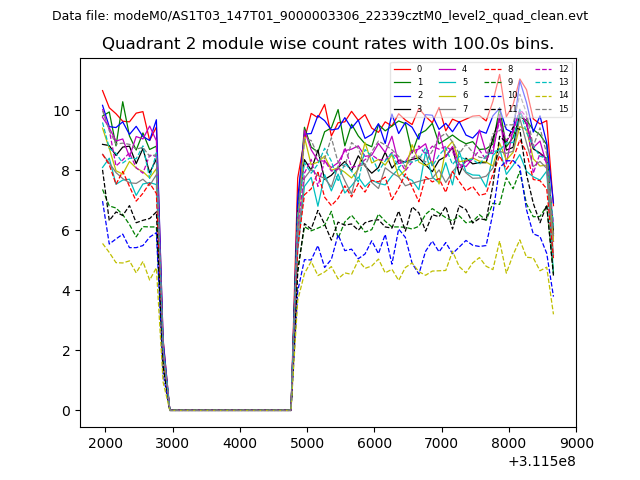
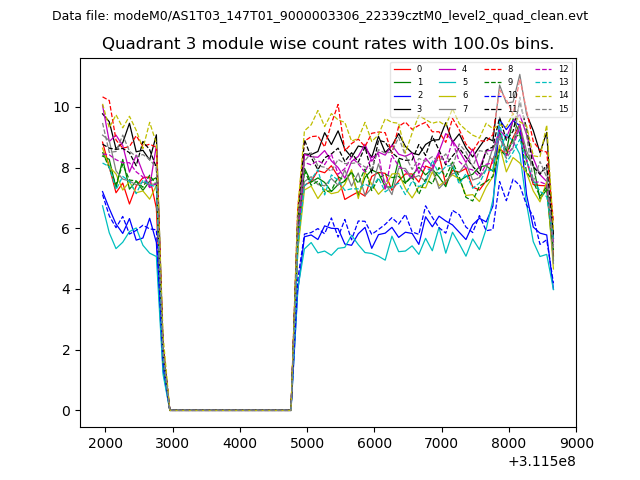
| Module-wise count rates for Quadrant C Data is divided into 100 sec bins |
 |
 |
| Module-wise count rates for Quadrant D Data is divided into 100 sec bins |
 |
 |
| Parameter | Plot |
|---|---|
| CZT HV Monitor | 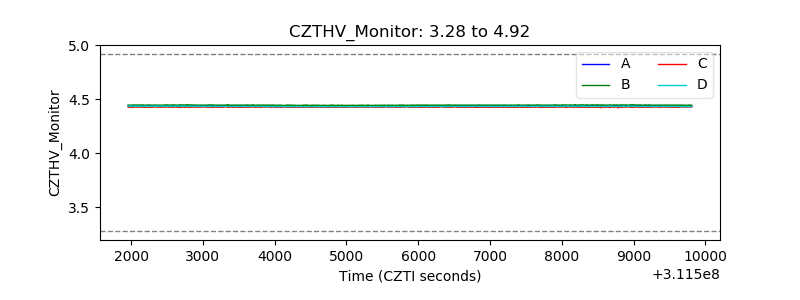 |
| D_VDD | 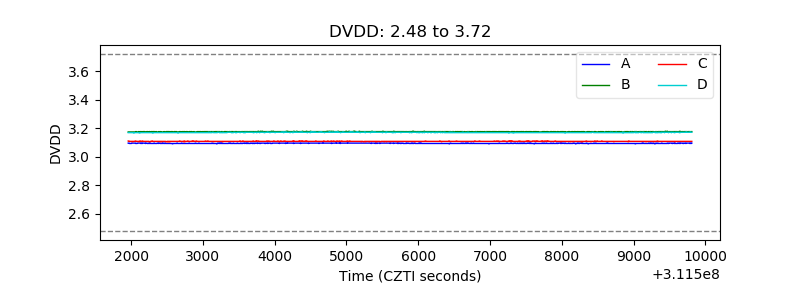 |
| Temperature 1 | 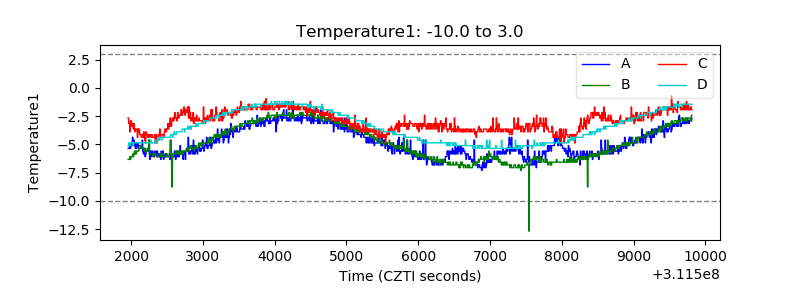 |
| Veto HV Monitor |  |
| Veto LLD | 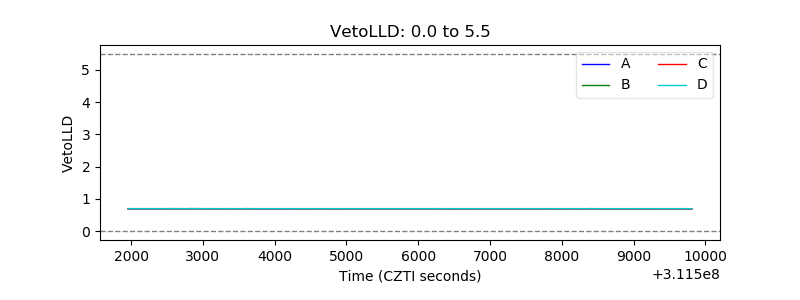 |
| Alpha Counter | 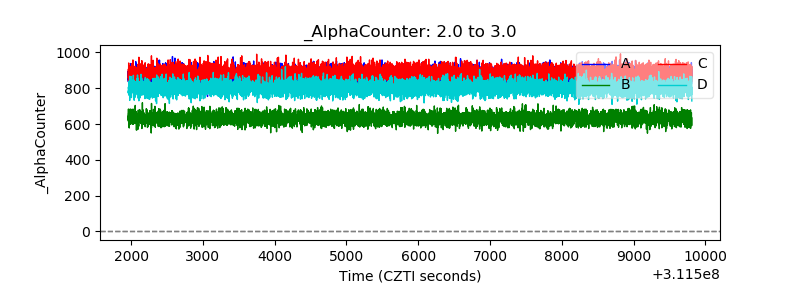 |
| _CPM_Rate | 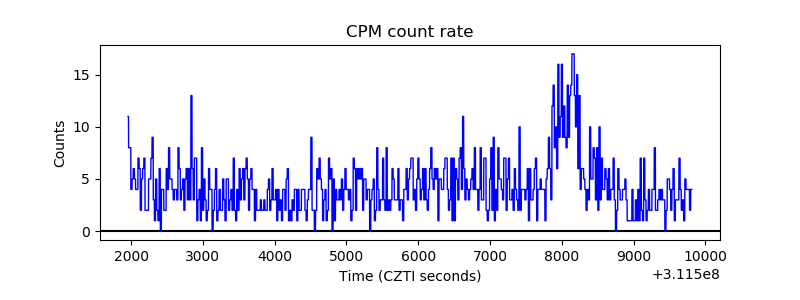 |
| CZT Counter | 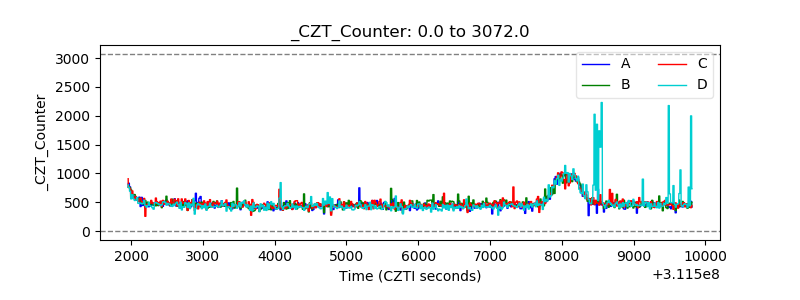 |
| +2.5 Volts monitor |  |
| +5 Volts monitor |  |
| _ROLL_ROT | 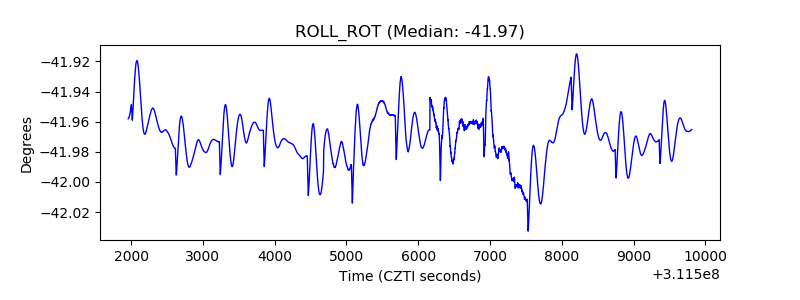 |
| _Roll_DEC | 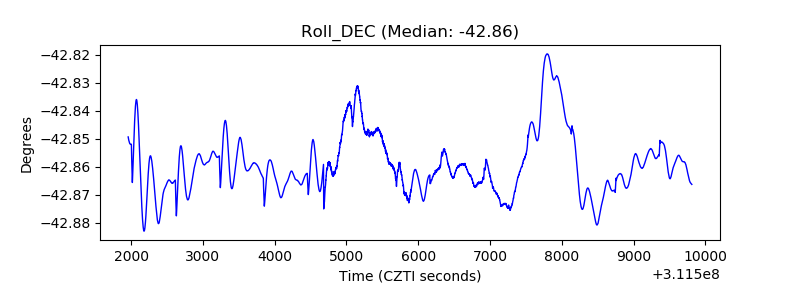 |
| _Roll_RA | 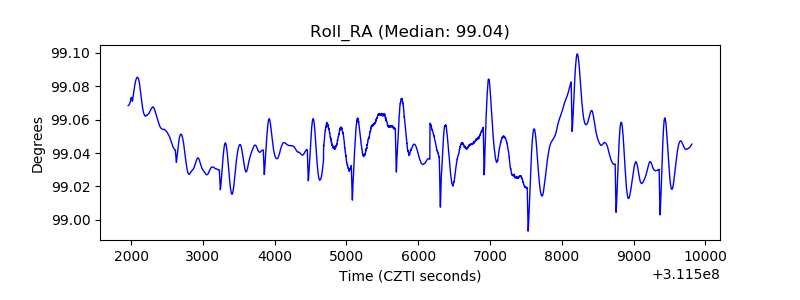 |
| Veto Counter | 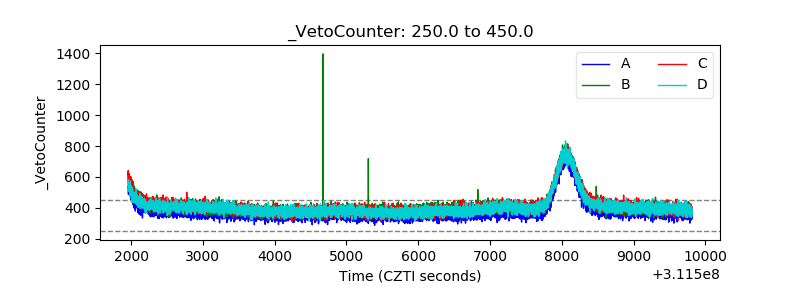 |