| Param | Original file | Final file |
|---|---|---|
| Filename | modeM0/AS1T03_147T01_9000003306_22344cztM0_level2.evt | modeM0/AS1T03_147T01_9000003306_22344cztM0_level2_quad_clean.evt |
| Size (bytes) | 1,693,889,280 | 337,129,920 |
| Size | 1.6 GB | 321.5 MB |
| Events in quadrant A | 11,660,447 | 2,158,132 |
| Events in quadrant B | 11,986,234 | 2,191,915 |
| Events in quadrant C | 11,897,121 | 2,084,282 |
| Events in quadrant D | 14,057,352 | 2,048,383 |
| Mode M9 | |||
|---|---|---|---|
| Quadrant | BADHDUFLAG | Total packets | Discarded packets |
| A | 0 | 23 | 0 |
| B | 0 | 23 | 0 |
| C | 0 | 23 | 0 |
| D | 0 | 23 | 0 |
| Mode SS | |||
|---|---|---|---|
| Quadrant | BADHDUFLAG | Total packets | Discarded packets |
| A | 0 | 512 | 0 |
| B | 0 | 512 | 0 |
| C | 0 | 512 | 0 |
| D | 0 | 512 | 0 |
| Mode M0 | |||
|---|---|---|---|
| Quadrant | BADHDUFLAG | Total packets | Discarded packets |
| A | 0 | 51587 | 4 |
| B | 0 | 52001 | 4 |
| C | 0 | 51735 | 4 |
| D | 0 | 59268 | 4 |
| Quadrant | Total seconds | Saturated seconds | Saturation percentage |
|---|---|---|---|
| A | 25120 | 344 | 1.369427% |
| B | 25120 | 419 | 1.667994% |
| C | 25120 | 430 | 1.711783% |
| D | 25120 | 592 | 2.356688% |
Noise dominated data is calculated using 1-second bins in cleaned event files. If a bin has >2000 counts, and if more than 50% of those come from <1% of pixels, then it is considered to be noise-dominated and hence unusable.
| Quadrant | # 1 sec bins | Bins with >0 counts | Bins with >2000 counts | High rate bins dominated by noise | Noise dominated (total time) | Noise dominated (detector-on time) | Marked lightcurve |
|---|---|---|---|---|---|---|---|
| A | 27556 | 25122 | 0 | 0 | 0.00% | 0.00% | 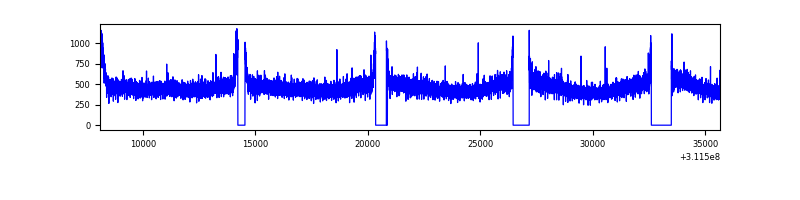 |
| B | 27556 | 25121 | 11 | 11 | 0.04% | 0.04% | 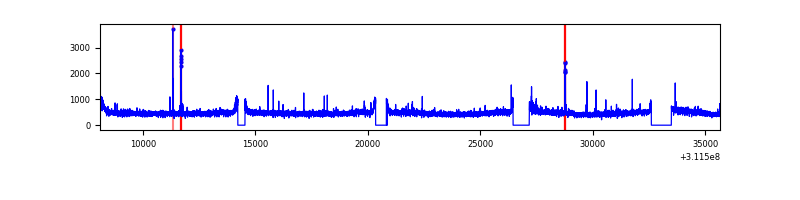 |
| C | 27556 | 25122 | 9 | 9 | 0.03% | 0.04% |  |
| D | 27556 | 25123 | 380 | 380 | 1.38% | 1.51% | 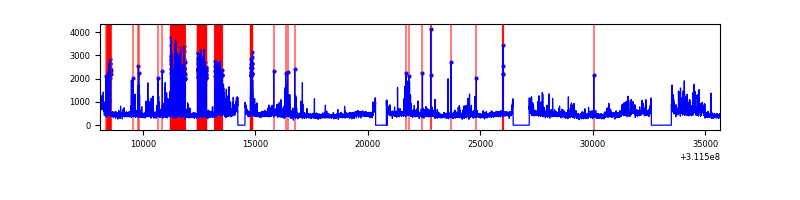 |
Top three noisy pixels from each quadrant. If the there are fewer than three noisy pixels in the level2.evt file, extra rows are filled as -1
| Pixel properties | Quadrant properties | ||||||
|---|---|---|---|---|---|---|---|
| Quadrant | DetID | PixID | Counts | Sigma | Mean | Median | Sigma |
| A | 13 | 254 | 32575 | 48.92 | 3019 | 2951 | 605.6 |
| A | 3 | 1 | 32226 | 48.34 | 3019 | 2951 | 605.6 |
| A | 3 | 137 | 27308 | 40.22 | 3019 | 2951 | 605.6 |
| B | 12 | 111 | 71918 | 119.8 | 3018 | 2937 | 575.8 |
| B | 11 | 111 | 64450 | 106.83 | 3018 | 2937 | 575.8 |
| B | 4 | 171 | 60032 | 99.16 | 3018 | 2937 | 575.8 |
| C | 14 | 238 | 456161 | 666.59 | 2911 | 2930 | 679.9 |
| C | 10 | 22 | 58614 | 81.9 | 2911 | 2930 | 679.9 |
| C | 10 | 1 | 21953 | 27.98 | 2911 | 2930 | 679.9 |
| D | 1 | 52 | 2012383 | 2803.71 | 2941 | 2855 | 716.7 |
| D | 12 | 227 | 620556 | 861.82 | 2941 | 2855 | 716.7 |
| D | 13 | 174 | 230464 | 317.56 | 2941 | 2855 | 716.7 |
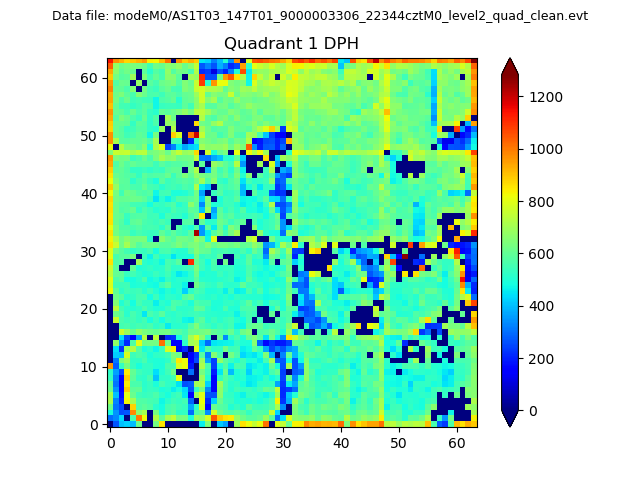
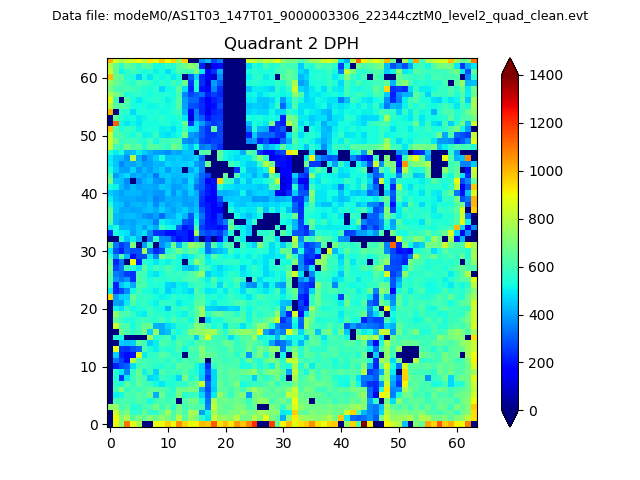
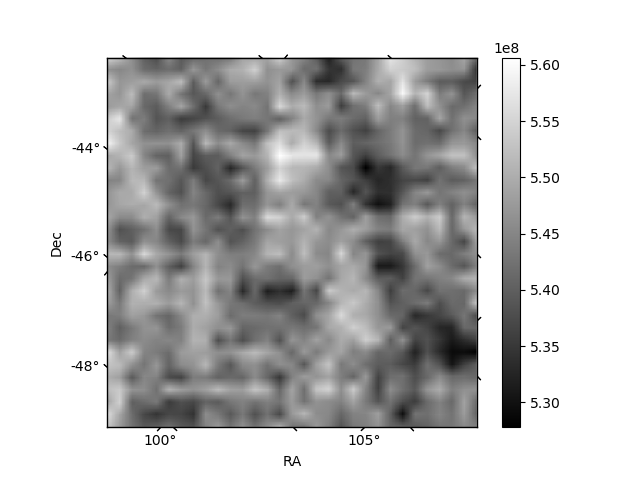
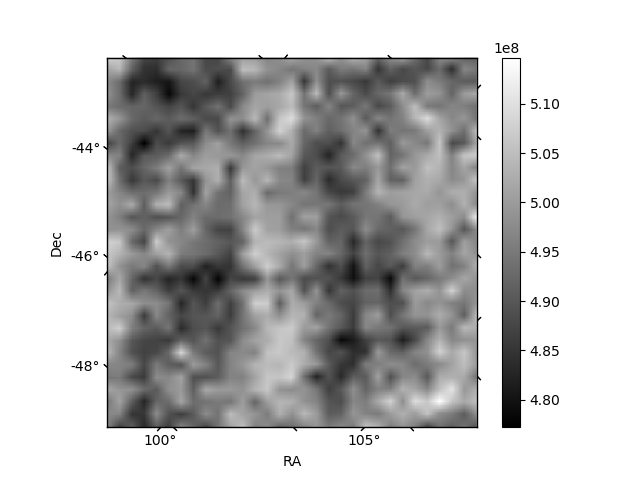
Histogram calculated using DETX and DETY for each event in the final _common_clean file
| Quadrant A | 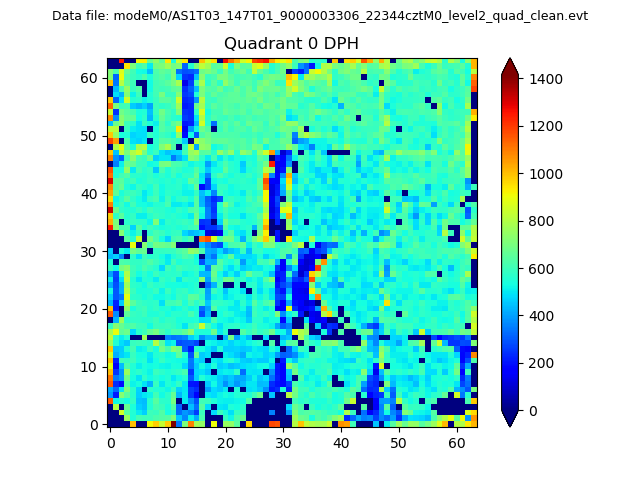 |
 |
Quadrant B |
|---|---|---|---|
| Quadrant D | 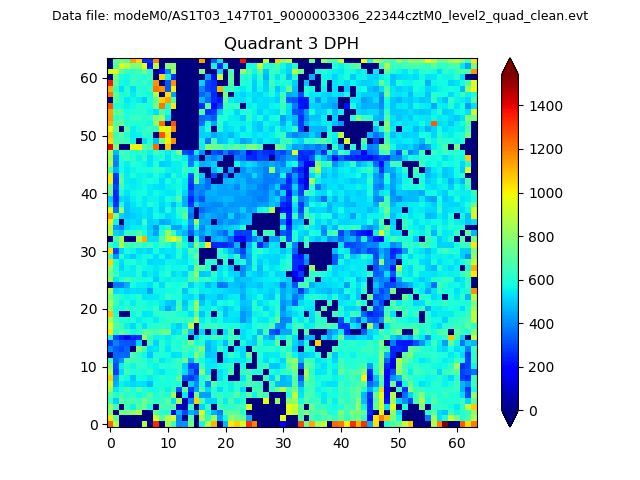 |
 |
Quadrant C |
| Plot type | Count rate plots | Images |
|---|---|---|
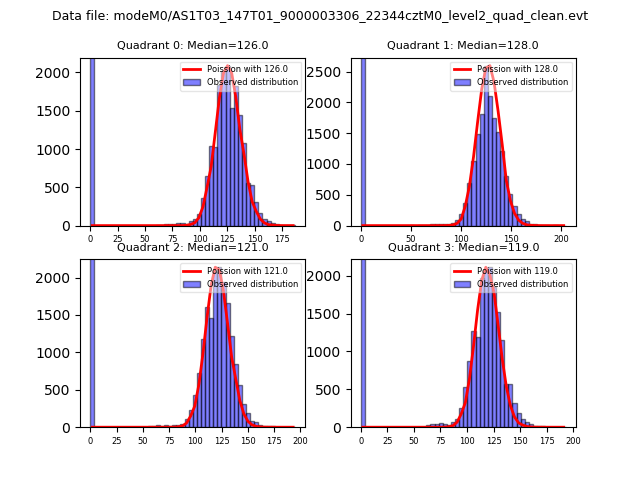
| Comparison with Poisson distribution Blue bars denote a histogram of data divided into 1 sec bins. Red curve is a Poisson curve with rate = median count rate of data. |
 |
 |
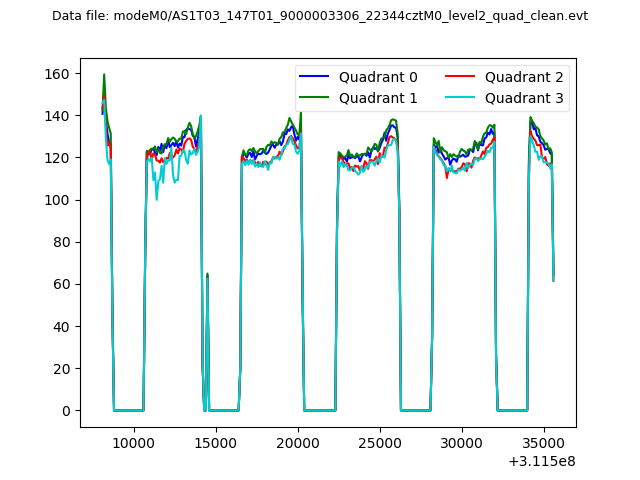
| Quadrant-wise count rates Data is divided into 100 sec bins |
 |
|
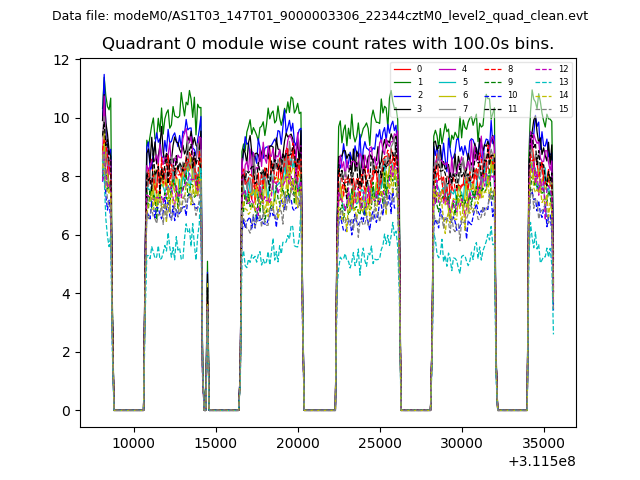
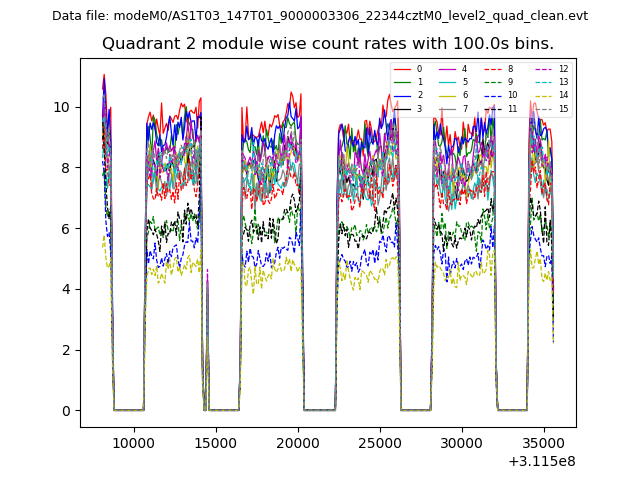
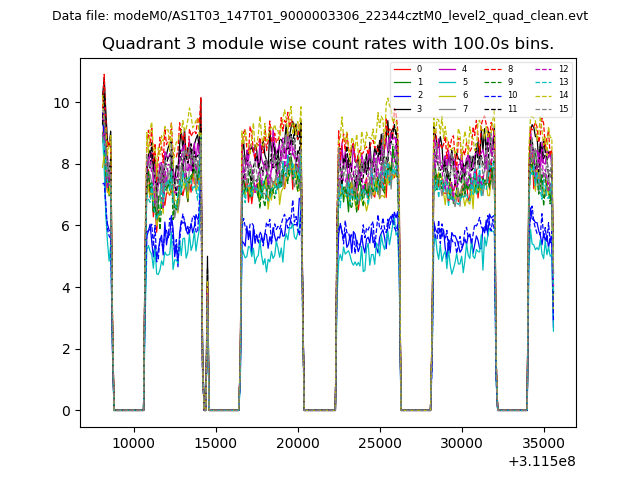
| Module-wise count rates for Quadrant A Data is divided into 100 sec bins |
 |
 |
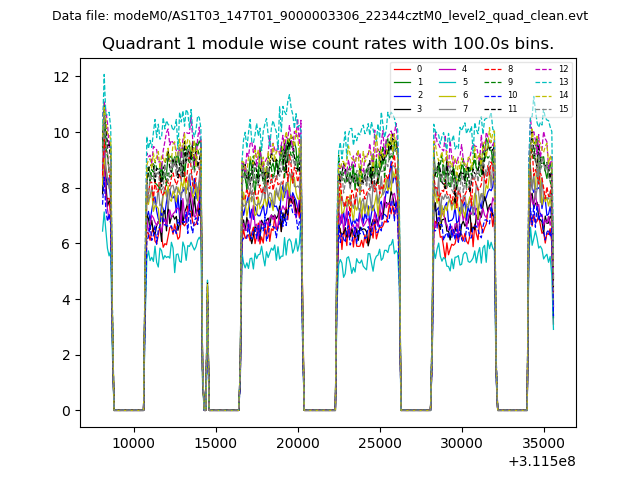
| Module-wise count rates for Quadrant B Data is divided into 100 sec bins |
 |
 |
| Module-wise count rates for Quadrant C Data is divided into 100 sec bins |
 |
 |
| Module-wise count rates for Quadrant D Data is divided into 100 sec bins |
 |
 |
| Parameter | Plot |
|---|---|
| CZT HV Monitor | 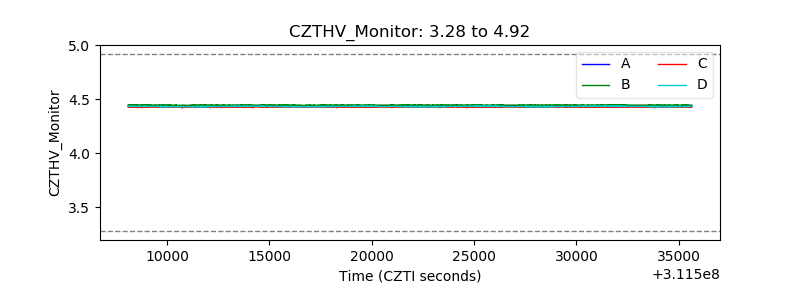 |
| D_VDD | 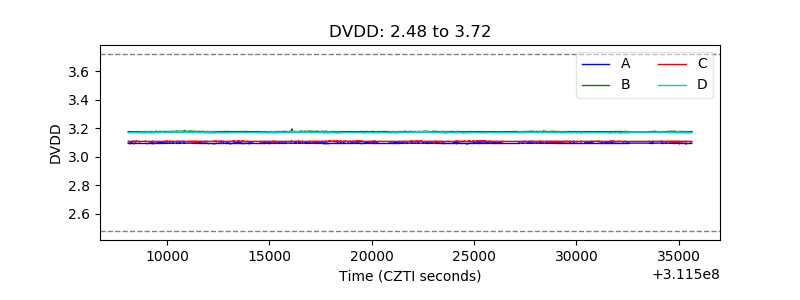 |
| Temperature 1 | 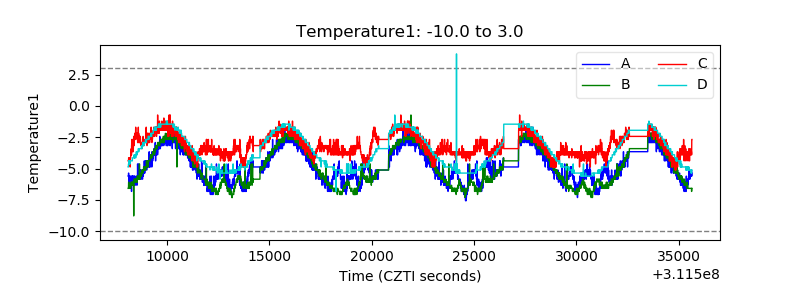 |
| Veto HV Monitor | 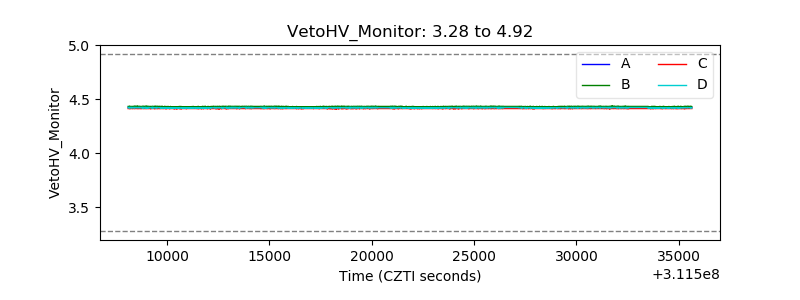 |
| Veto LLD | 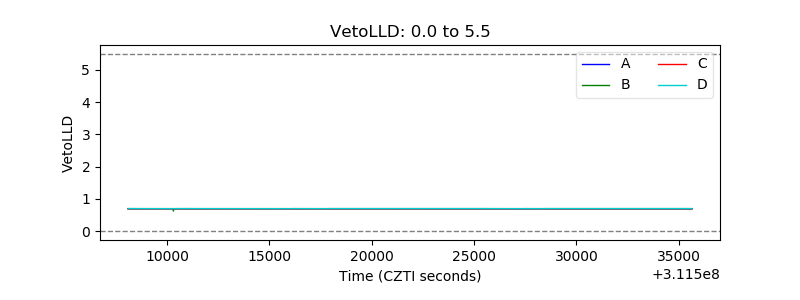 |
| Alpha Counter | 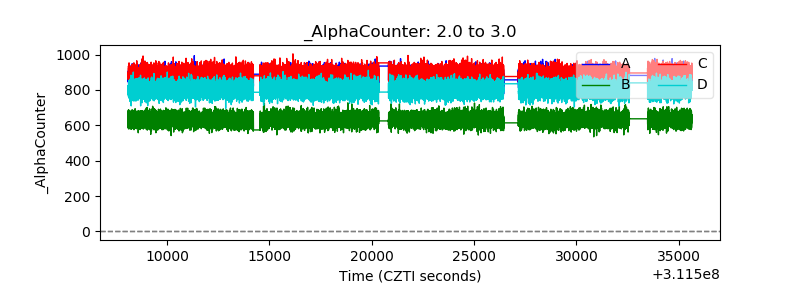 |
| _CPM_Rate | 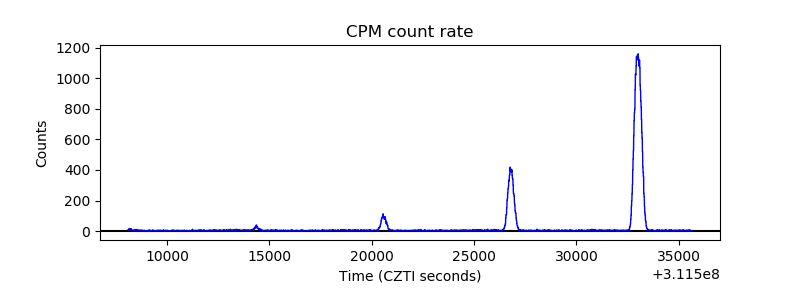 |
| CZT Counter | 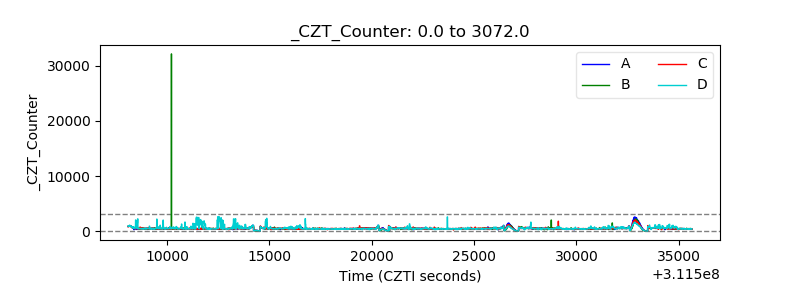 |
| +2.5 Volts monitor |  |
| +5 Volts monitor |  |
| _ROLL_ROT | 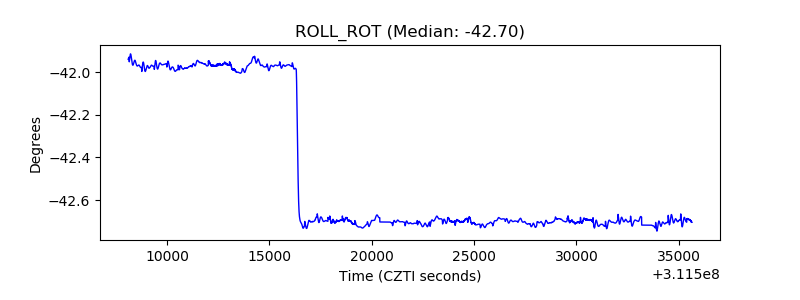 |
| _Roll_DEC | 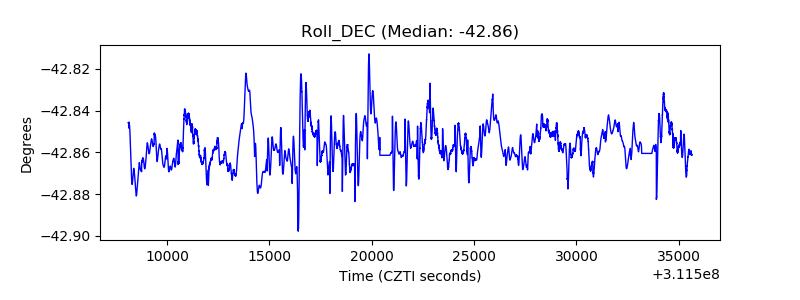 |
| _Roll_RA | 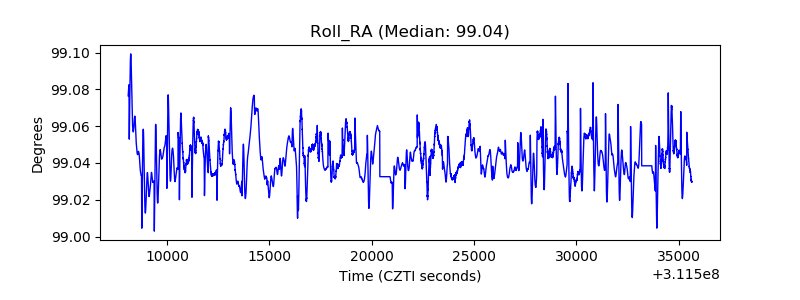 |
| Veto Counter | 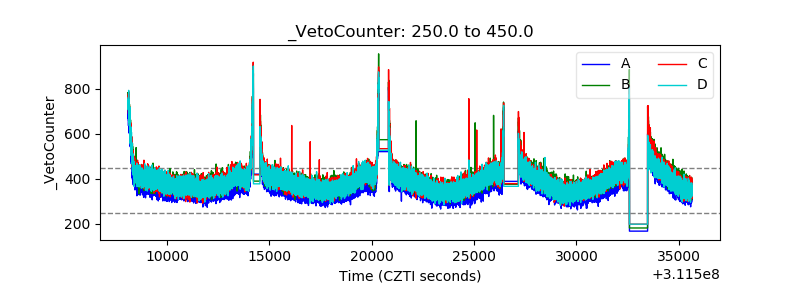 |