| Param | Original file | Final file |
|---|---|---|
| Filename | modeM0/AS1T03_147T01_9000003306_22346cztM0_level2.evt | modeM0/AS1T03_147T01_9000003306_22346cztM0_level2_quad_clean.evt |
| Size (bytes) | 636,082,560 | 153,838,080 |
| Size | 606.6 MB | 146.7 MB |
| Events in quadrant A | 4,458,102 | 1,018,006 |
| Events in quadrant B | 4,607,380 | 1,047,897 |
| Events in quadrant C | 4,665,540 | 978,619 |
| Events in quadrant D | 4,891,062 | 958,733 |
| Mode M9 | |||
|---|---|---|---|
| Quadrant | BADHDUFLAG | Total packets | Discarded packets |
| A | 0 | 23 | 0 |
| B | 0 | 23 | 0 |
| C | 0 | 23 | 0 |
| D | 0 | 23 | 0 |
| Mode SS | |||
|---|---|---|---|
| Quadrant | BADHDUFLAG | Total packets | Discarded packets |
| A | 0 | 192 | 0 |
| B | 0 | 192 | 0 |
| C | 0 | 192 | 0 |
| D | 0 | 192 | 0 |
| Mode M0 | |||
|---|---|---|---|
| Quadrant | BADHDUFLAG | Total packets | Discarded packets |
| A | 0 | 19616 | 3 |
| B | 0 | 19900 | 2 |
| C | 0 | 19976 | 2 |
| D | 0 | 21083 | 2 |
| Quadrant | Total seconds | Saturated seconds | Saturation percentage |
|---|---|---|---|
| A | 9469 | 30 | 0.316823% |
| B | 9469 | 56 | 0.591404% |
| C | 9469 | 83 | 0.876545% |
| D | 9469 | 47 | 0.496357% |
Noise dominated data is calculated using 1-second bins in cleaned event files. If a bin has >2000 counts, and if more than 50% of those come from <1% of pixels, then it is considered to be noise-dominated and hence unusable.
| Quadrant | # 1 sec bins | Bins with >0 counts | Bins with >2000 counts | High rate bins dominated by noise | Noise dominated (total time) | Noise dominated (detector-on time) | Marked lightcurve |
|---|---|---|---|---|---|---|---|
| A | 11759 | 9471 | 0 | 0 | 0.00% | 0.00% | 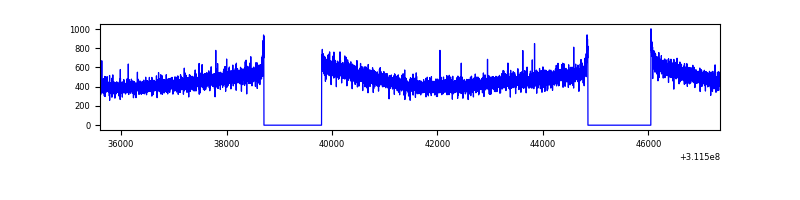 |
| B | 11759 | 9471 | 2 | 2 | 0.02% | 0.02% | 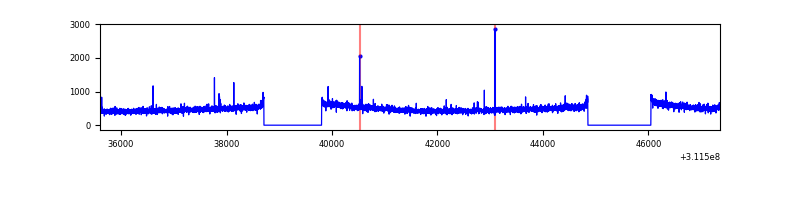 |
| C | 11759 | 9471 | 1 | 1 | 0.01% | 0.01% | 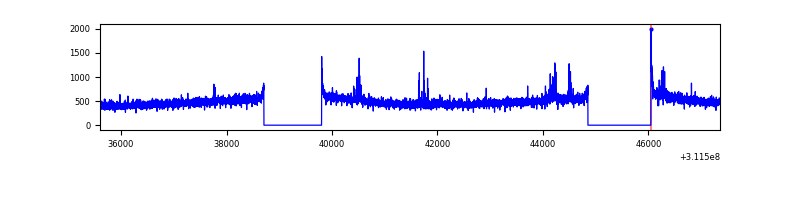 |
| D | 11759 | 9471 | 8 | 8 | 0.07% | 0.08% | 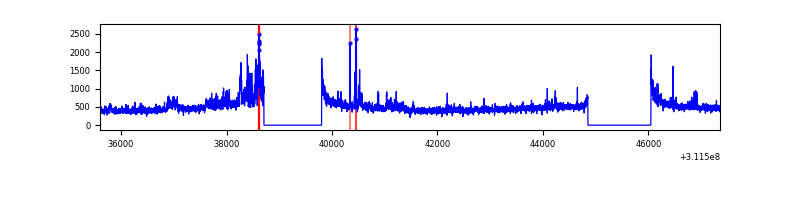 |
Top three noisy pixels from each quadrant. If the there are fewer than three noisy pixels in the level2.evt file, extra rows are filled as -1
| Pixel properties | Quadrant properties | ||||||
|---|---|---|---|---|---|---|---|
| Quadrant | DetID | PixID | Counts | Sigma | Mean | Median | Sigma |
| A | 13 | 254 | 12601 | 49.68 | 1155 | 1131 | 230.9 |
| A | 3 | 137 | 9900 | 37.98 | 1155 | 1131 | 230.9 |
| A | 0 | 226 | 9876 | 37.88 | 1155 | 1131 | 230.9 |
| B | 12 | 111 | 26904 | 117.66 | 1166 | 1137 | 219.0 |
| B | 11 | 111 | 23707 | 103.06 | 1166 | 1137 | 219.0 |
| B | 14 | 111 | 21681 | 93.81 | 1166 | 1137 | 219.0 |
| C | 14 | 238 | 178233 | 677.1 | 1119 | 1128 | 261.6 |
| C | 10 | 22 | 68201 | 256.43 | 1119 | 1128 | 261.6 |
| C | 0 | 10 | 25378 | 92.71 | 1119 | 1128 | 261.6 |
| D | 12 | 227 | 582457 | 2150.71 | 1122 | 1092 | 270.3 |
| D | 1 | 52 | 64745 | 235.48 | 1122 | 1092 | 270.3 |
| D | 2 | 234 | 34915 | 125.13 | 1122 | 1092 | 270.3 |
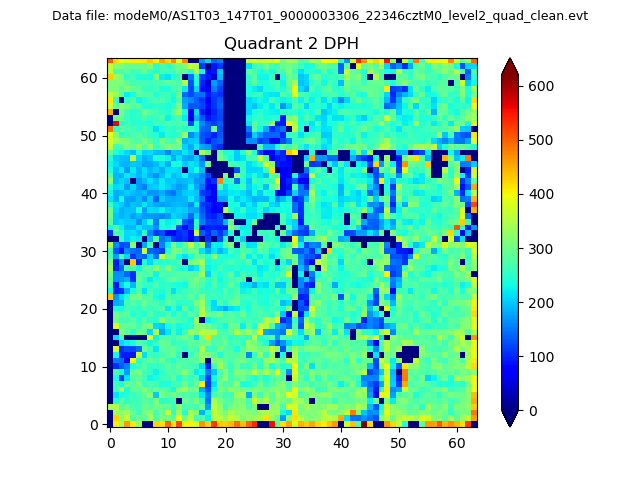
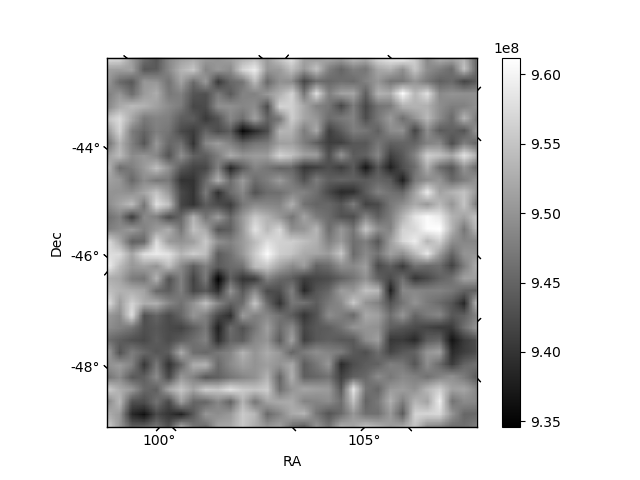
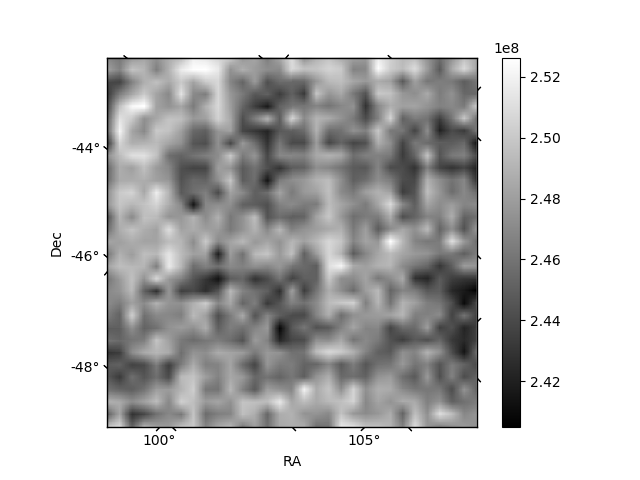
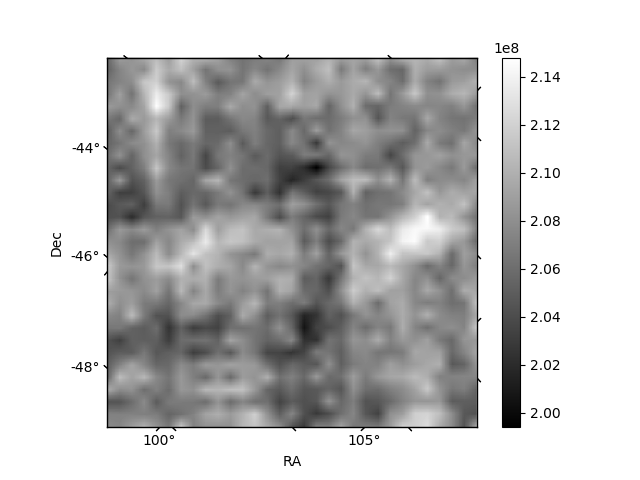
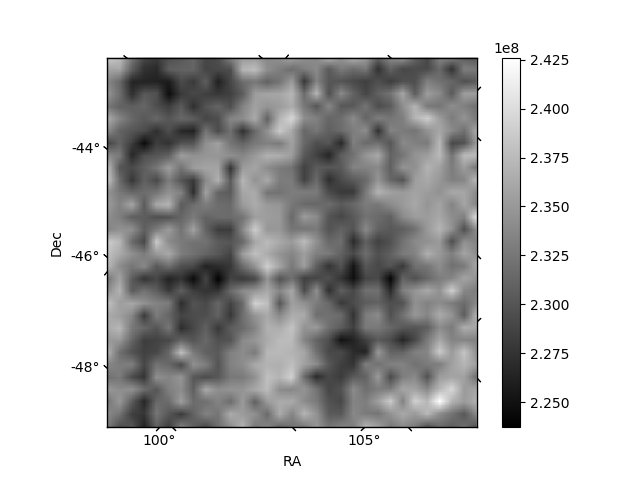
Histogram calculated using DETX and DETY for each event in the final _common_clean file
| Quadrant A | 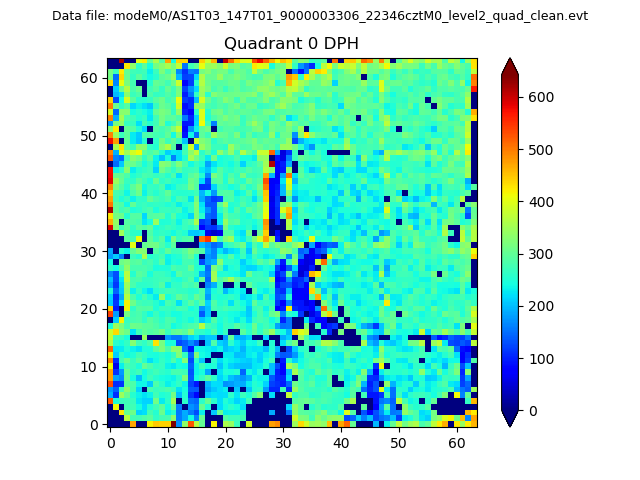 |
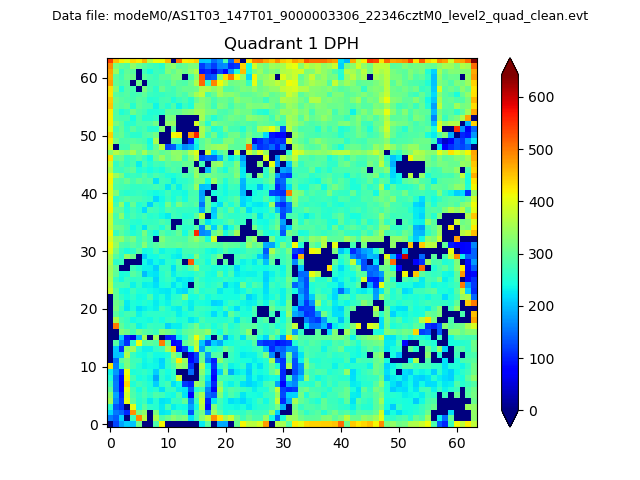 |
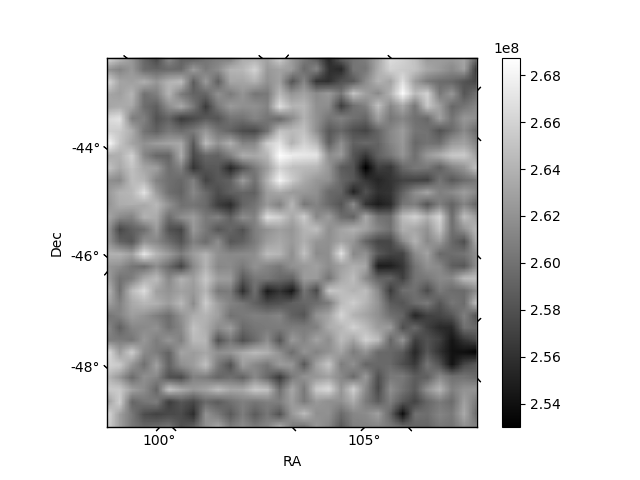
Quadrant B |
|---|---|---|---|
| Quadrant D | 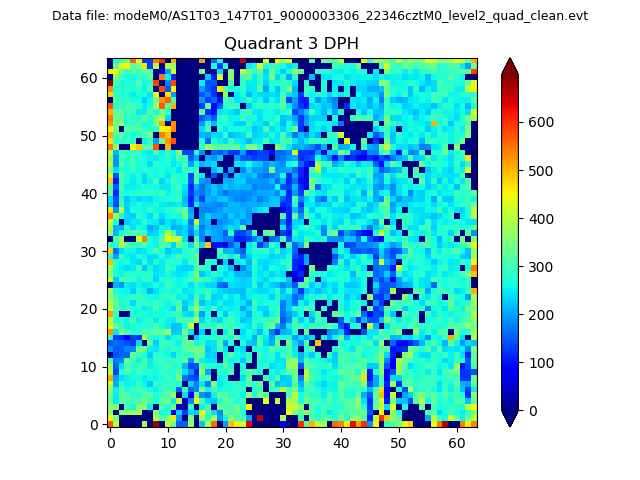 |
 |
Quadrant C |
| Plot type | Count rate plots | Images |
|---|---|---|
| Comparison with Poisson distribution Blue bars denote a histogram of data divided into 1 sec bins. Red curve is a Poisson curve with rate = median count rate of data. |
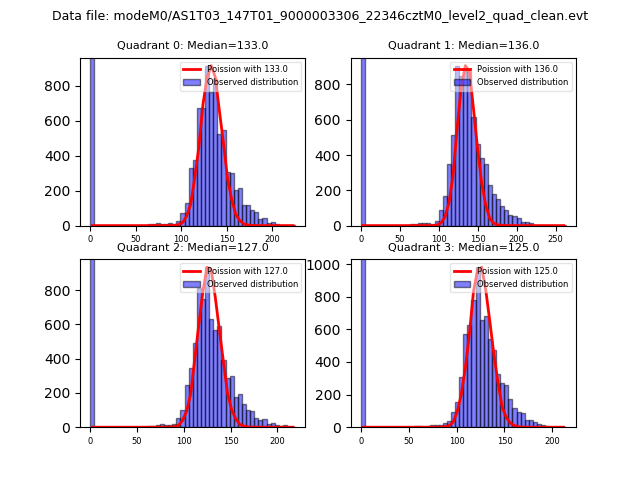 |
 |
| Quadrant-wise count rates Data is divided into 100 sec bins |
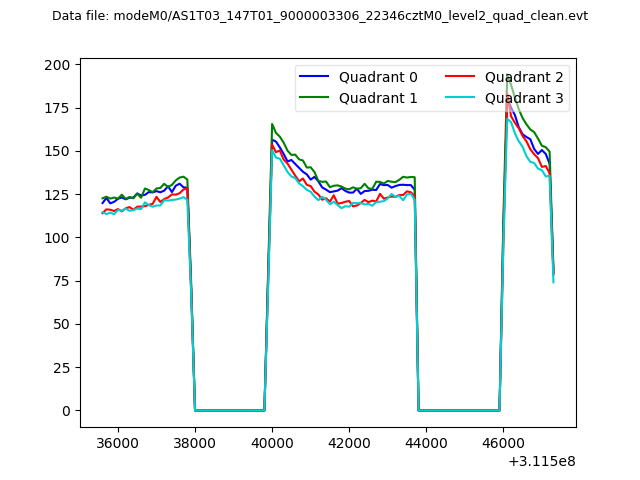 |
|
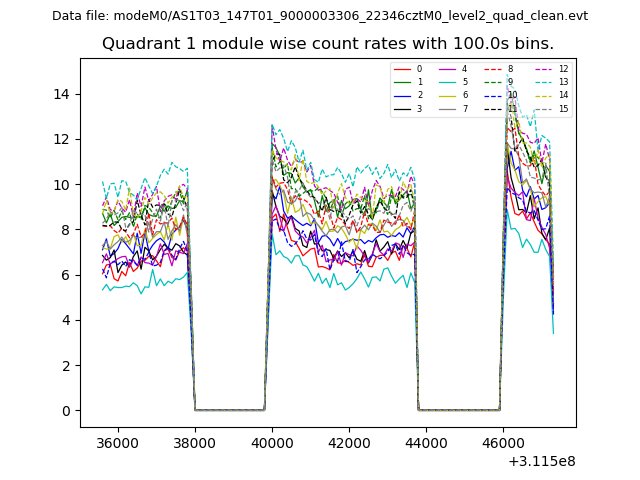
| Module-wise count rates for Quadrant A Data is divided into 100 sec bins |
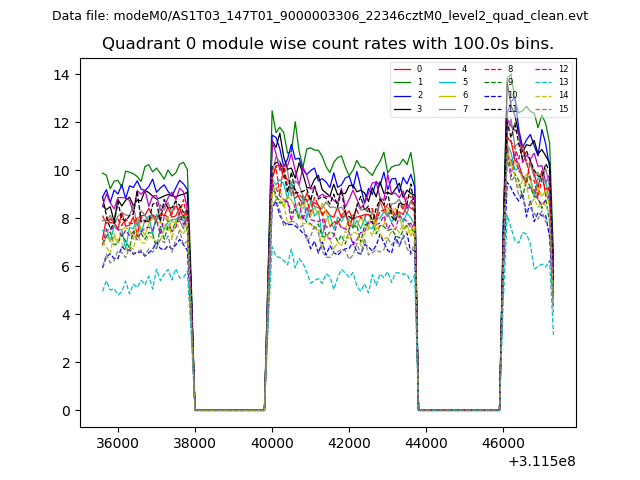 |
 |
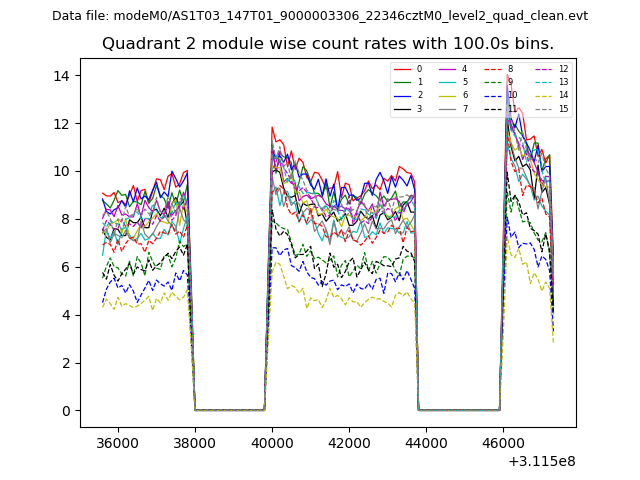
| Module-wise count rates for Quadrant B Data is divided into 100 sec bins |
 |
 |
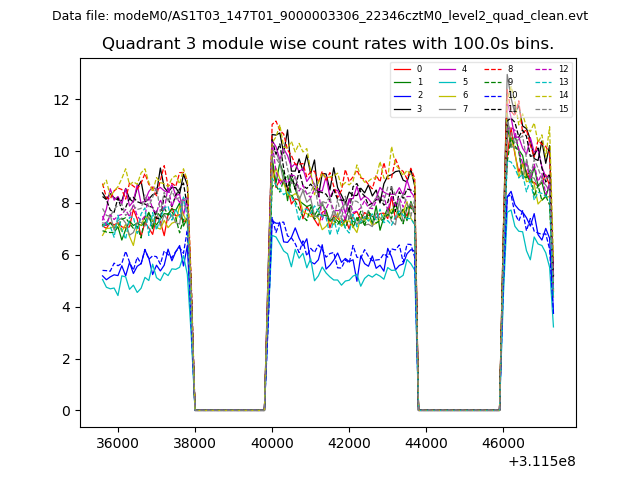
| Module-wise count rates for Quadrant C Data is divided into 100 sec bins |
 |
 |
| Module-wise count rates for Quadrant D Data is divided into 100 sec bins |
 |
 |
| Parameter | Plot |
|---|---|
| CZT HV Monitor |  |
| D_VDD | 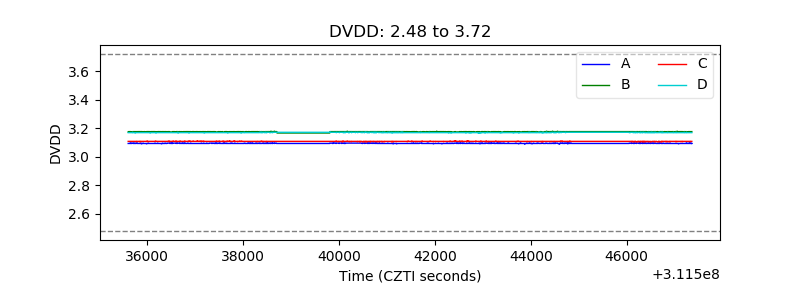 |
| Temperature 1 | 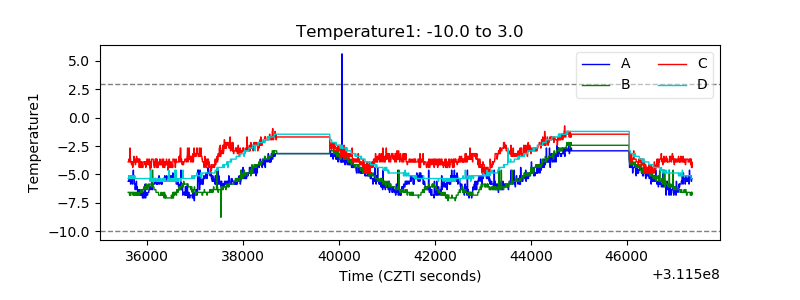 |
| Veto HV Monitor | 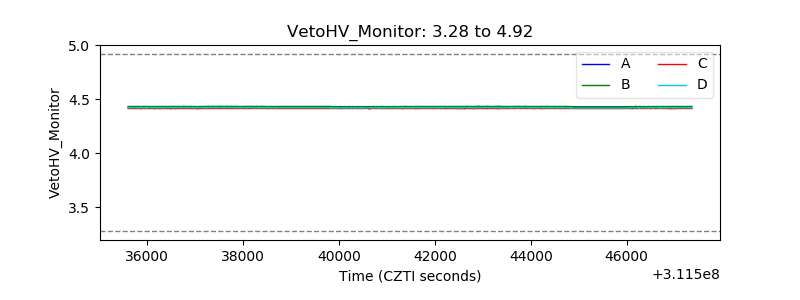 |
| Veto LLD | 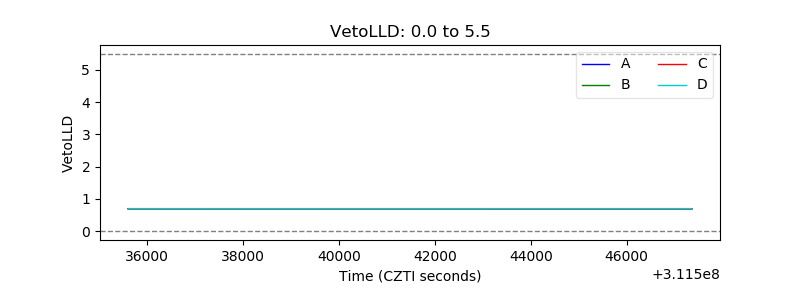 |
| Alpha Counter | 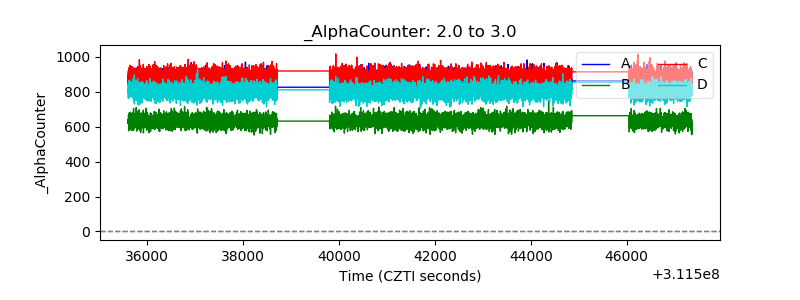 |
| _CPM_Rate | 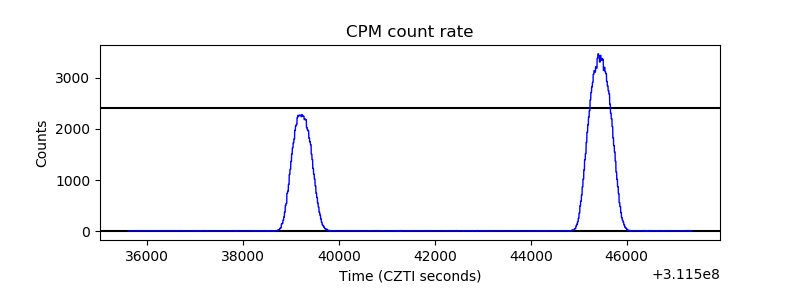 |
| CZT Counter | 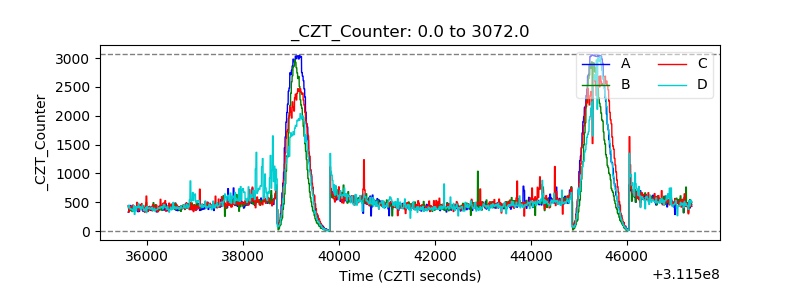 |
| +2.5 Volts monitor |  |
| +5 Volts monitor |  |
| _ROLL_ROT | 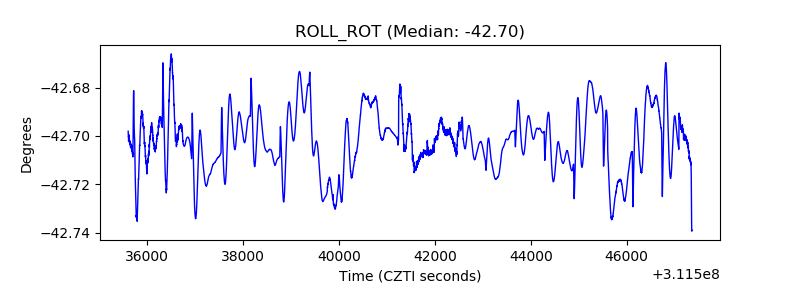 |
| _Roll_DEC |  |
| _Roll_RA | 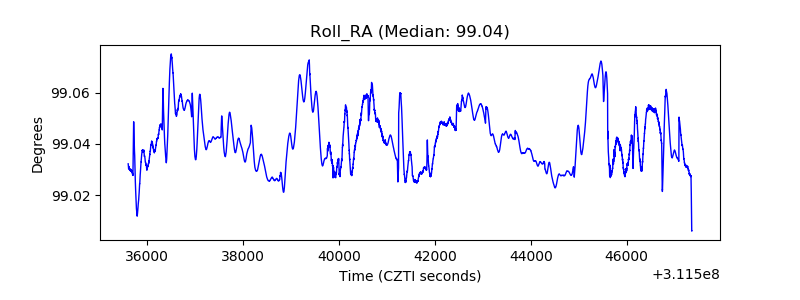 |
| Veto Counter | 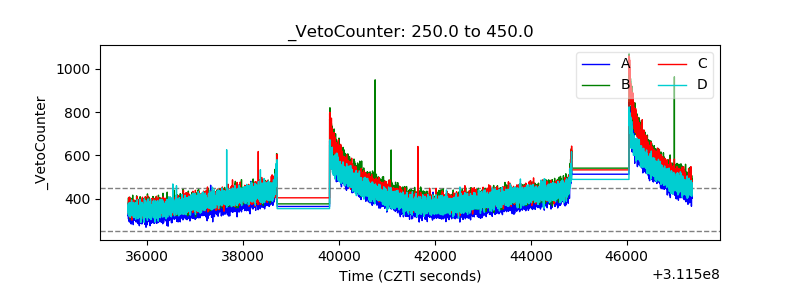 |