| Param | Original file | Final file |
|---|---|---|
| Filename | modeM0/AS1T03_147T01_9000003306_22347cztM0_level2.evt | modeM0/AS1T03_147T01_9000003306_22347cztM0_level2_quad_clean.evt |
| Size (bytes) | 486,112,320 | 114,698,880 |
| Size | 463.6 MB | 109.4 MB |
| Events in quadrant A | 3,507,936 | 753,312 |
| Events in quadrant B | 3,619,800 | 790,200 |
| Events in quadrant C | 3,647,582 | 733,349 |
| Events in quadrant D | 3,469,762 | 707,987 |
| Mode M9 | |||
|---|---|---|---|
| Quadrant | BADHDUFLAG | Total packets | Discarded packets |
| A | 0 | 25 | 0 |
| B | 0 | 25 | 0 |
| C | 0 | 25 | 0 |
| D | 0 | 25 | 0 |
| Mode SS | |||
|---|---|---|---|
| Quadrant | BADHDUFLAG | Total packets | Discarded packets |
| A | 0 | 144 | 0 |
| B | 0 | 144 | 0 |
| C | 0 | 144 | 0 |
| D | 0 | 144 | 0 |
| Mode M0 | |||
|---|---|---|---|
| Quadrant | BADHDUFLAG | Total packets | Discarded packets |
| A | 0 | 14834 | 2 |
| B | 0 | 15103 | 2 |
| C | 0 | 15152 | 2 |
| D | 0 | 14910 | 2 |
| Quadrant | Total seconds | Saturated seconds | Saturation percentage |
|---|---|---|---|
| A | 7023 | 39 | 0.555318% |
| B | 7024 | 66 | 0.939636% |
| C | 7024 | 89 | 1.267084% |
| D | 7024 | 26 | 0.370159% |
Noise dominated data is calculated using 1-second bins in cleaned event files. If a bin has >2000 counts, and if more than 50% of those come from <1% of pixels, then it is considered to be noise-dominated and hence unusable.
| Quadrant | # 1 sec bins | Bins with >0 counts | Bins with >2000 counts | High rate bins dominated by noise | Noise dominated (total time) | Noise dominated (detector-on time) | Marked lightcurve |
|---|---|---|---|---|---|---|---|
| A | 9508 | 7025 | 0 | 0 | 0.00% | 0.00% | 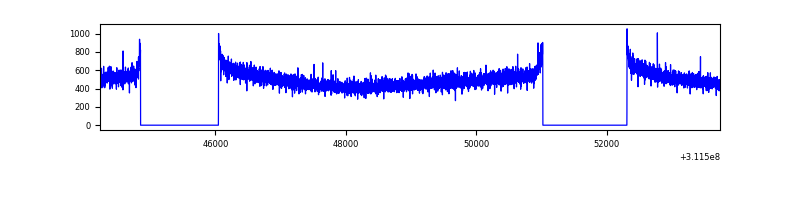 |
| B | 9509 | 7026 | 0 | 0 | 0.00% | 0.00% | 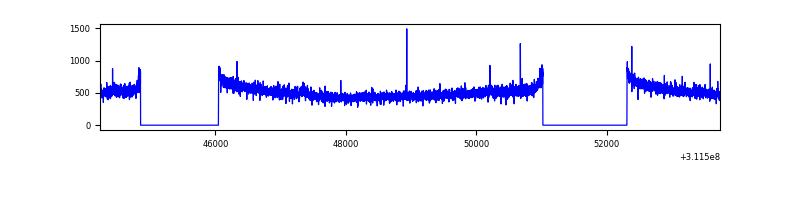 |
| C | 9509 | 7026 | 1 | 1 | 0.01% | 0.01% | 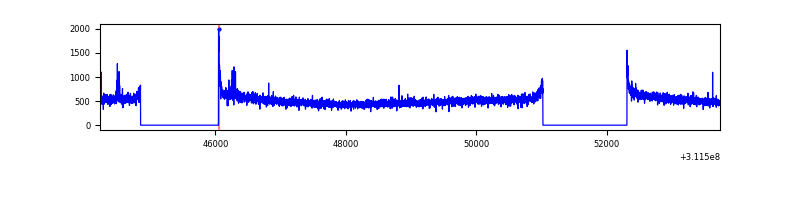 |
| D | 9509 | 7026 | 2 | 2 | 0.02% | 0.03% | 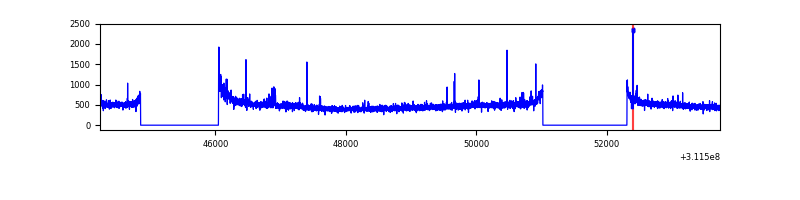 |
Top three noisy pixels from each quadrant. If the there are fewer than three noisy pixels in the level2.evt file, extra rows are filled as -1
| Pixel properties | Quadrant properties | ||||||
|---|---|---|---|---|---|---|---|
| Quadrant | DetID | PixID | Counts | Sigma | Mean | Median | Sigma |
| A | 13 | 254 | 8859 | 43.84 | 909 | 891 | 181.7 |
| A | 0 | 226 | 7831 | 38.19 | 909 | 891 | 181.7 |
| A | 3 | 137 | 7630 | 37.08 | 909 | 891 | 181.7 |
| B | 12 | 111 | 20653 | 115.57 | 922 | 900 | 170.9 |
| B | 11 | 111 | 18195 | 101.19 | 922 | 900 | 170.9 |
| B | 14 | 111 | 16729 | 92.61 | 922 | 900 | 170.9 |
| C | 14 | 238 | 142858 | 686.47 | 884 | 890 | 206.8 |
| C | 10 | 22 | 30319 | 142.3 | 884 | 890 | 206.8 |
| C | 0 | 10 | 25431 | 118.66 | 884 | 890 | 206.8 |
| D | 12 | 227 | 72828 | 338.95 | 882 | 859 | 212.3 |
| D | 1 | 52 | 40830 | 188.25 | 882 | 859 | 212.3 |
| D | 2 | 234 | 25204 | 114.66 | 882 | 859 | 212.3 |
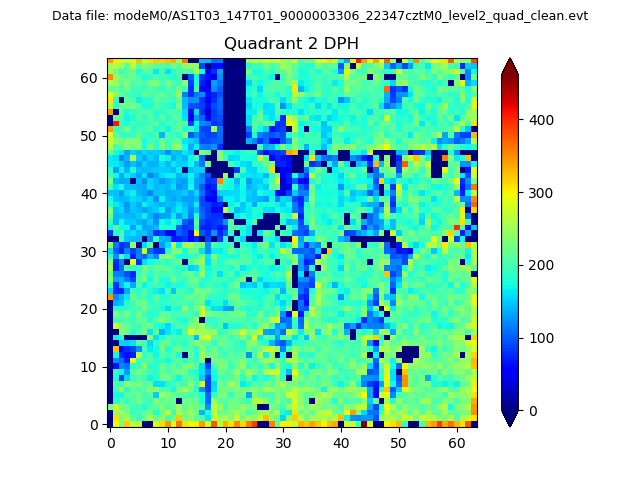
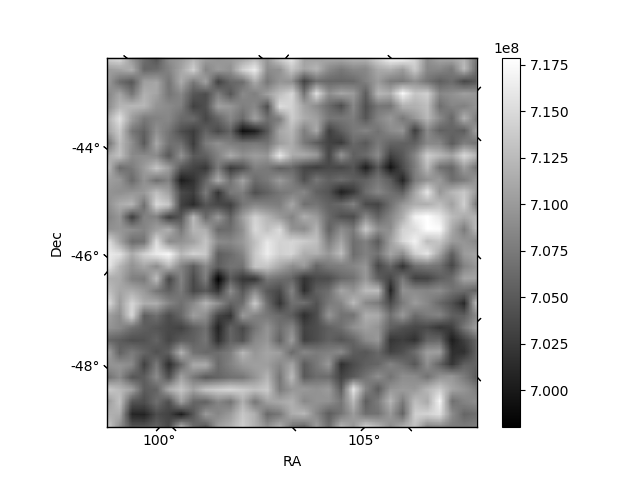
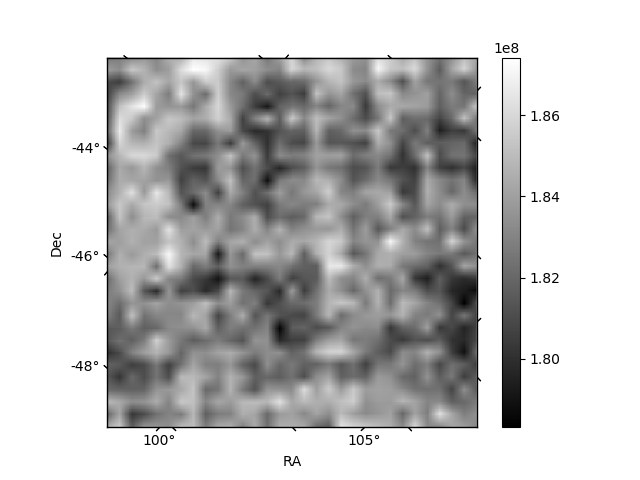
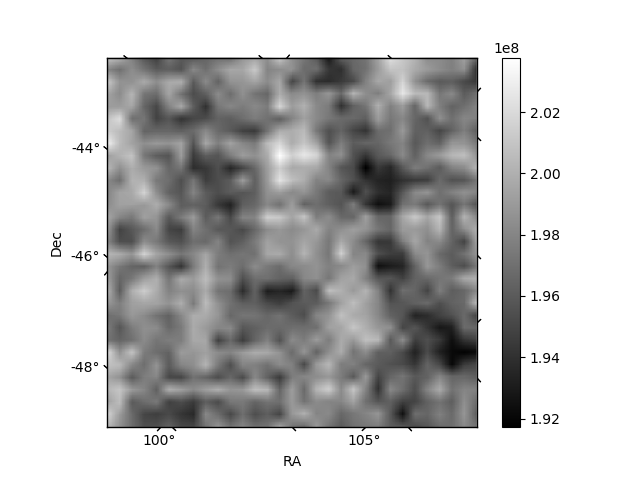
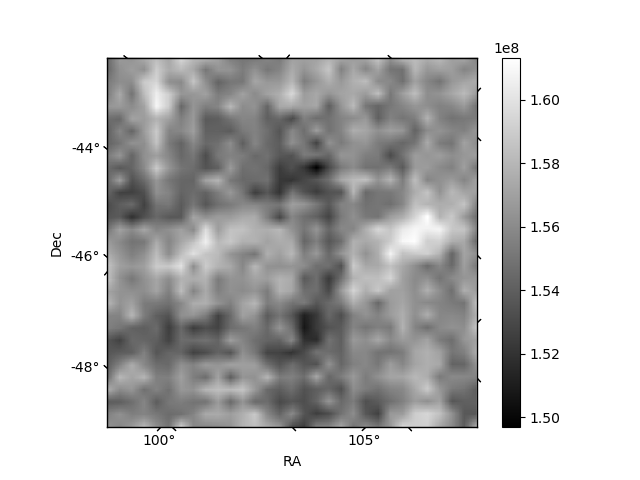
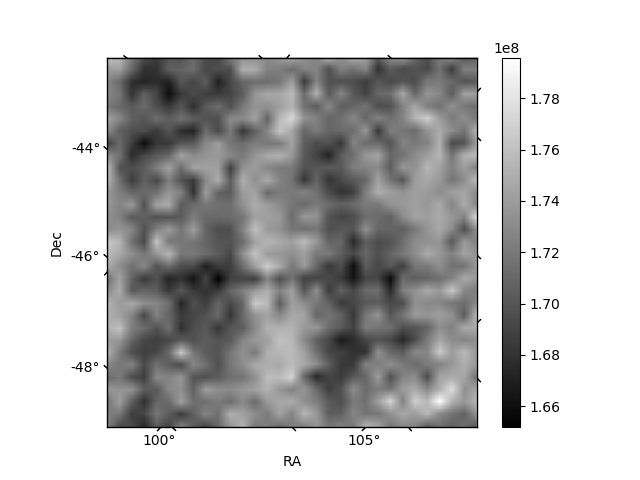
Histogram calculated using DETX and DETY for each event in the final _common_clean file
| Quadrant A | 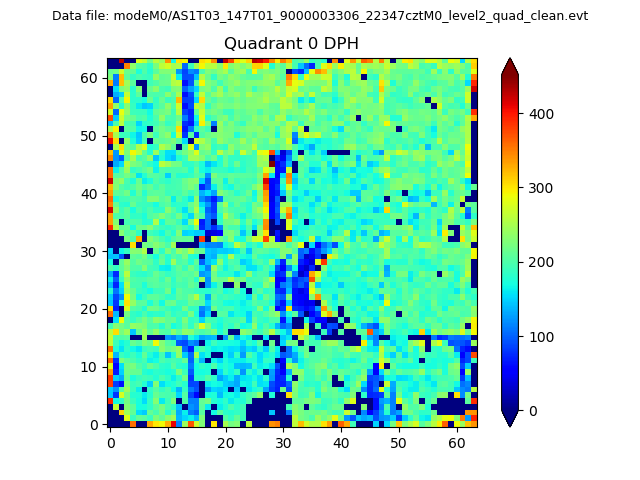 |
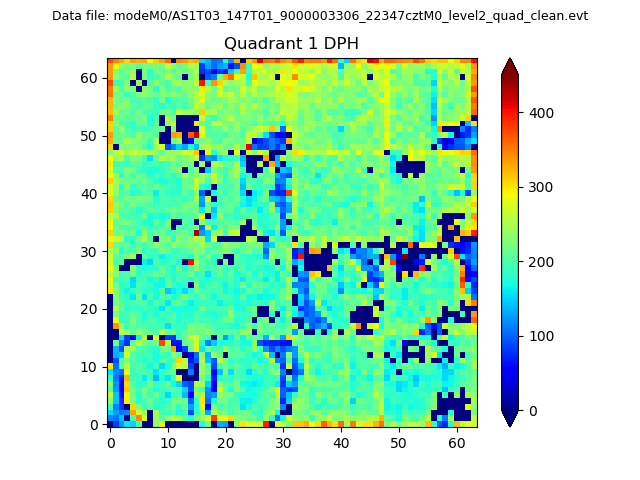 |
Quadrant B |
|---|---|---|---|
| Quadrant D | 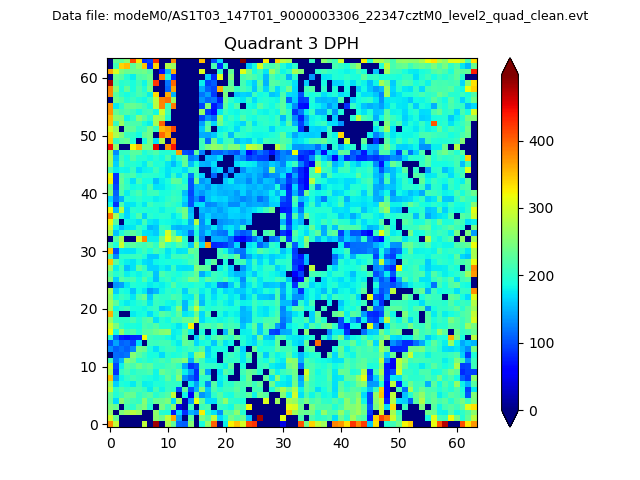 |
 |
Quadrant C |
| Plot type | Count rate plots | Images |
|---|---|---|
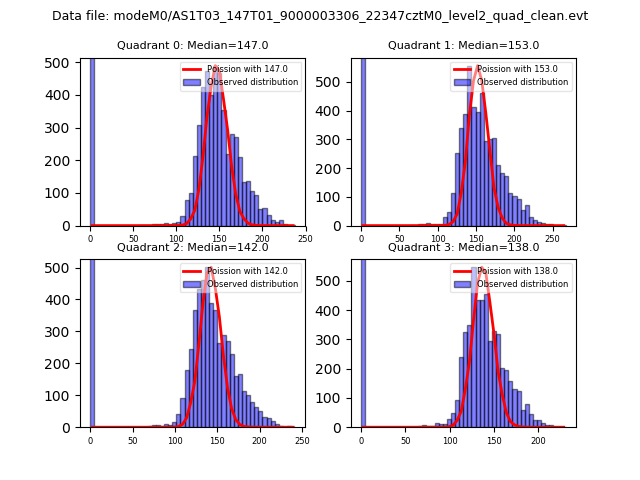
| Comparison with Poisson distribution Blue bars denote a histogram of data divided into 1 sec bins. Red curve is a Poisson curve with rate = median count rate of data. |
 |
 |
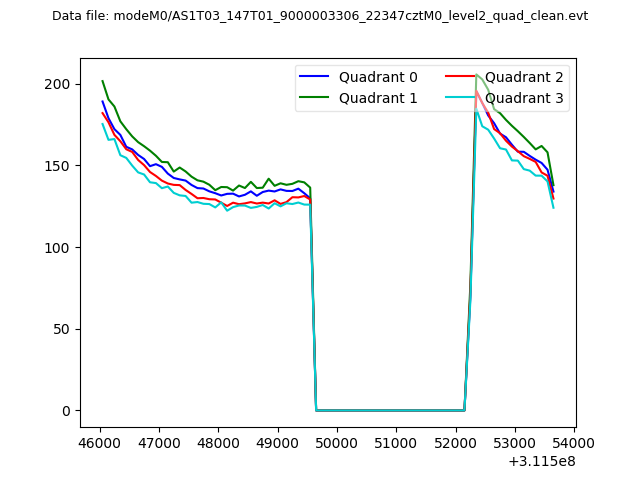
| Quadrant-wise count rates Data is divided into 100 sec bins |
 |
|
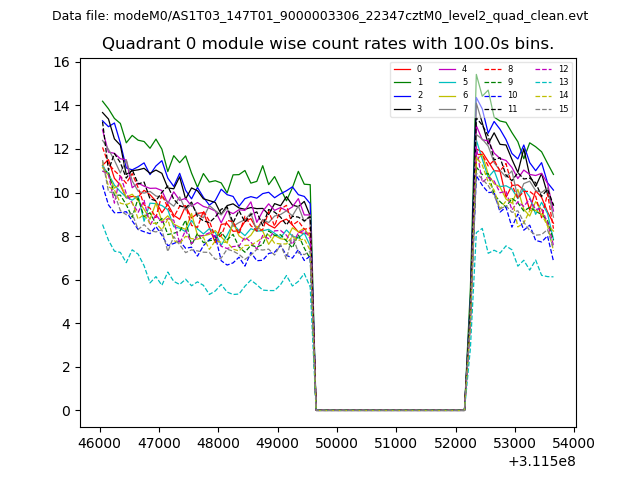
| Module-wise count rates for Quadrant A Data is divided into 100 sec bins |
 |
 |
| Module-wise count rates for Quadrant B Data is divided into 100 sec bins |
 |
 |
| Module-wise count rates for Quadrant C Data is divided into 100 sec bins |
 |
 |
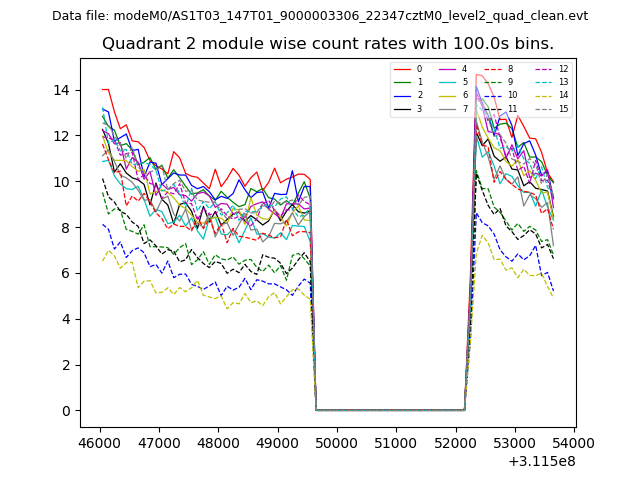
| Module-wise count rates for Quadrant D Data is divided into 100 sec bins |
 |
 |
| Parameter | Plot |
|---|---|
| CZT HV Monitor | 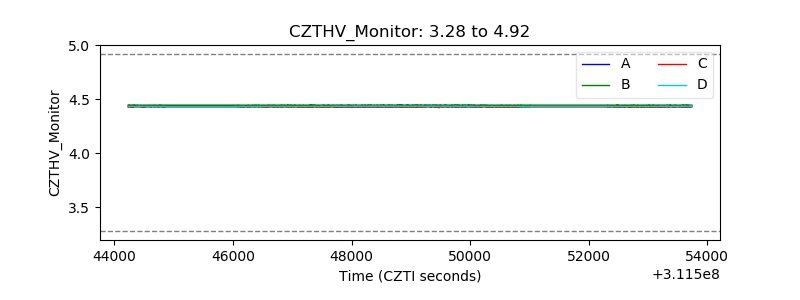 |
| D_VDD | 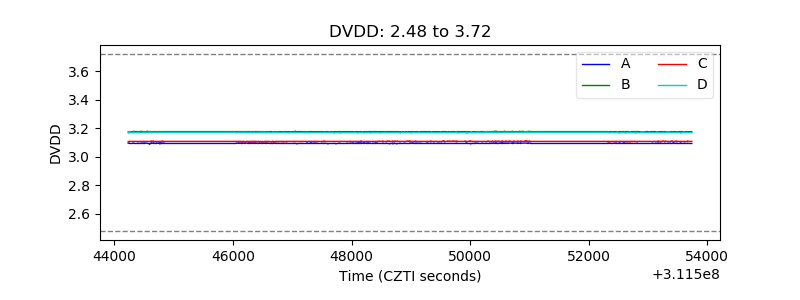 |
| Temperature 1 | 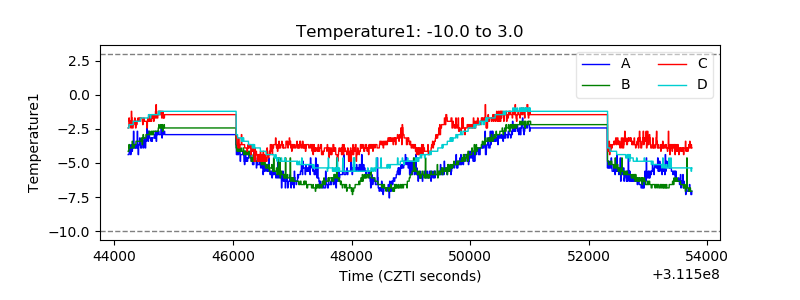 |
| Veto HV Monitor | 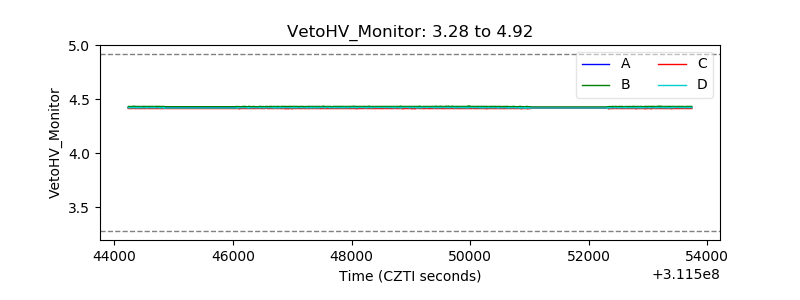 |
| Veto LLD | 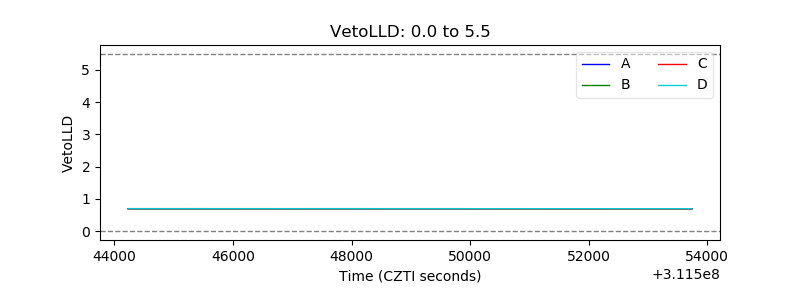 |
| Alpha Counter | 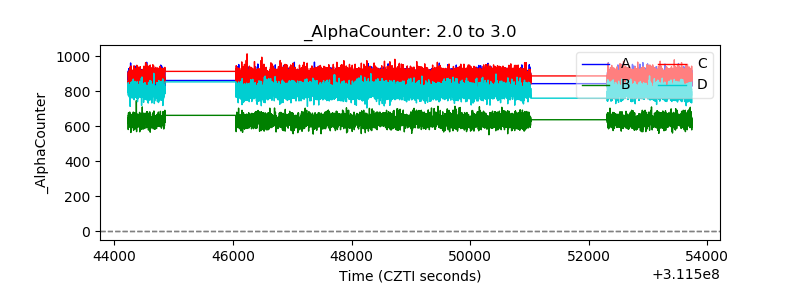 |
| _CPM_Rate | 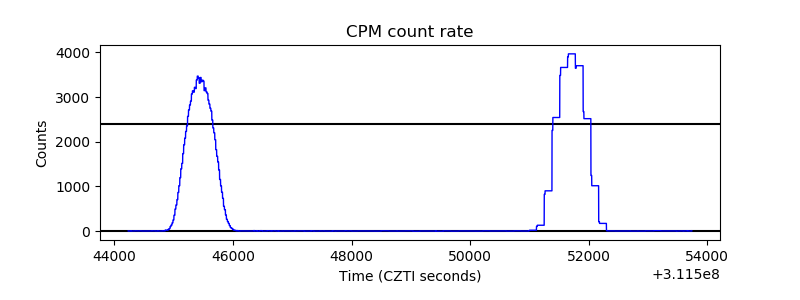 |
| CZT Counter | 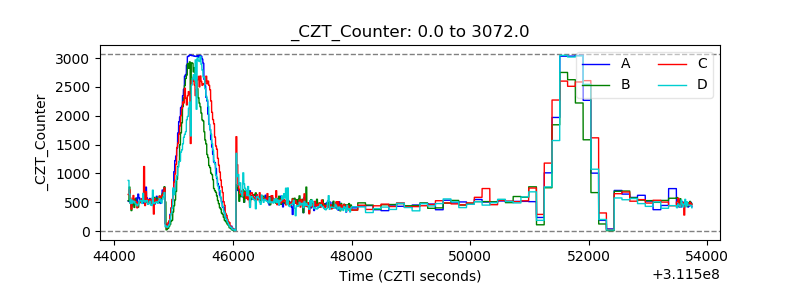 |
| +2.5 Volts monitor | 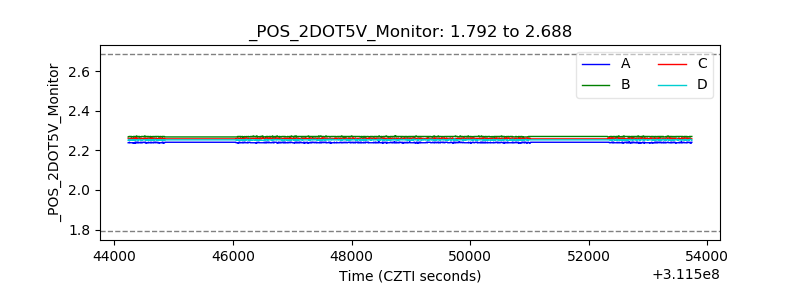 |
| +5 Volts monitor | 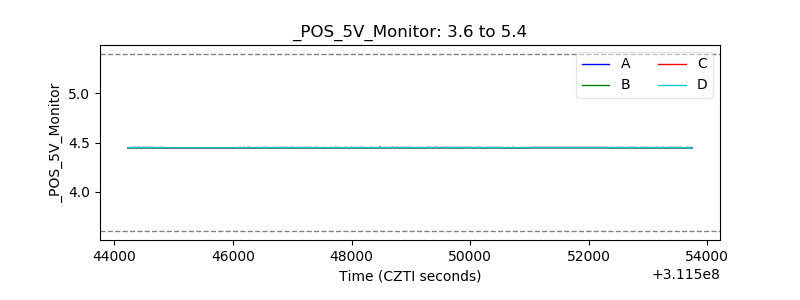 |
| _ROLL_ROT | 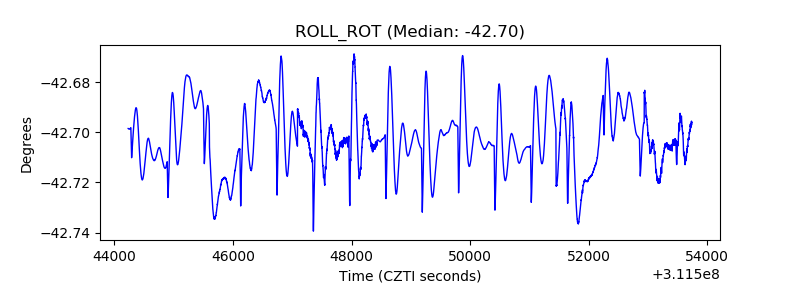 |
| _Roll_DEC | 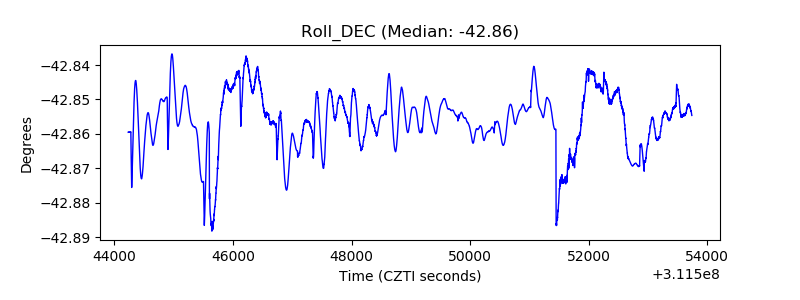 |
| _Roll_RA | 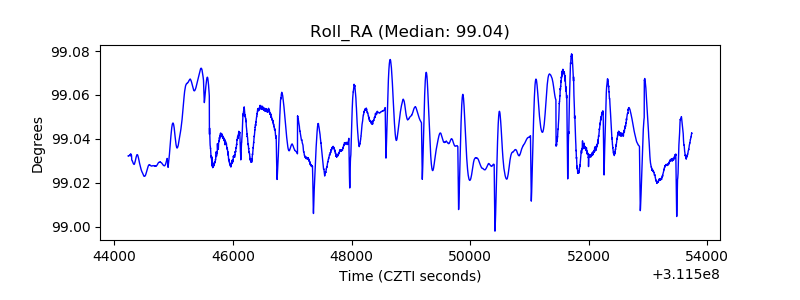 |
| Veto Counter | 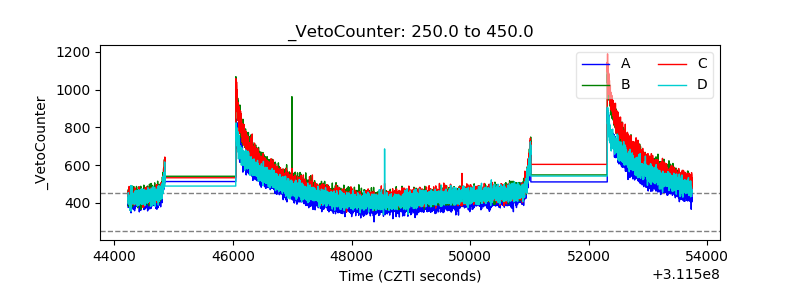 |