| Param | Original file | Final file |
|---|---|---|
| Filename | modeM0/AS1T03_147T01_9000003306_22348cztM0_level2.evt | modeM0/AS1T03_147T01_9000003306_22348cztM0_level2_quad_clean.evt |
| Size (bytes) | 430,790,400 | 77,325,120 |
| Size | 410.8 MB | 73.7 MB |
| Events in quadrant A | 3,081,120 | 480,359 |
| Events in quadrant B | 3,206,286 | 506,694 |
| Events in quadrant C | 3,232,741 | 472,997 |
| Events in quadrant D | 3,110,709 | 454,340 |
| Mode M9 | |||
|---|---|---|---|
| Quadrant | BADHDUFLAG | Total packets | Discarded packets |
| A | 0 | 22 | 0 |
| B | 0 | 23 | 0 |
| C | 0 | 23 | 0 |
| D | 0 | 23 | 0 |
| Mode SS | |||
|---|---|---|---|
| Quadrant | BADHDUFLAG | Total packets | Discarded packets |
| A | 0 | 124 | 0 |
| B | 0 | 124 | 0 |
| C | 0 | 124 | 0 |
| D | 0 | 124 | 0 |
| Mode M0 | |||
|---|---|---|---|
| Quadrant | BADHDUFLAG | Total packets | Discarded packets |
| A | 0 | 12950 | 2 |
| B | 0 | 13270 | 2 |
| C | 0 | 13285 | 2 |
| D | 0 | 13188 | 2 |
| Quadrant | Total seconds | Saturated seconds | Saturation percentage |
|---|---|---|---|
| A | 6118 | 16 | 0.261523% |
| B | 6118 | 36 | 0.588428% |
| C | 6118 | 53 | 0.866296% |
| D | 6118 | 10 | 0.163452% |
Noise dominated data is calculated using 1-second bins in cleaned event files. If a bin has >2000 counts, and if more than 50% of those come from <1% of pixels, then it is considered to be noise-dominated and hence unusable.
| Quadrant | # 1 sec bins | Bins with >0 counts | Bins with >2000 counts | High rate bins dominated by noise | Noise dominated (total time) | Noise dominated (detector-on time) | Marked lightcurve |
|---|---|---|---|---|---|---|---|
| A | 7508 | 6119 | 0 | 0 | 0.00% | 0.00% | 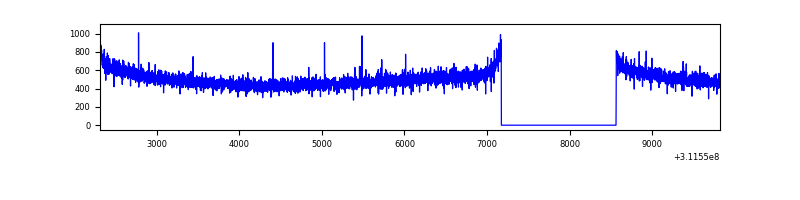 |
| B | 7508 | 6119 | 0 | 0 | 0.00% | 0.00% | 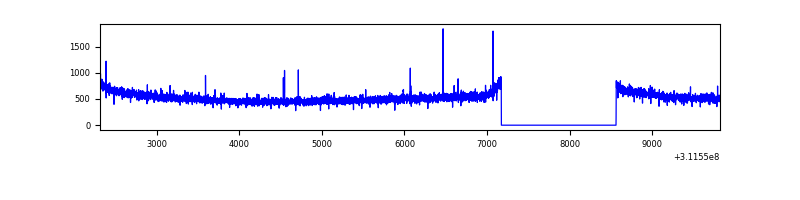 |
| C | 7508 | 6119 | 0 | 0 | 0.00% | 0.00% | 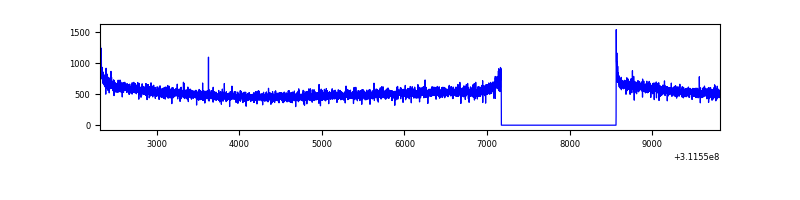 |
| D | 7508 | 6119 | 4 | 4 | 0.05% | 0.07% |  |
Top three noisy pixels from each quadrant. If the there are fewer than three noisy pixels in the level2.evt file, extra rows are filled as -1
| Pixel properties | Quadrant properties | ||||||
|---|---|---|---|---|---|---|---|
| Quadrant | DetID | PixID | Counts | Sigma | Mean | Median | Sigma |
| A | 13 | 254 | 7845 | 44.33 | 799 | 784 | 159.3 |
| A | 0 | 226 | 6786 | 37.68 | 799 | 784 | 159.3 |
| A | 3 | 137 | 6471 | 35.7 | 799 | 784 | 159.3 |
| B | 12 | 111 | 17539 | 111.67 | 817 | 797 | 149.9 |
| B | 11 | 111 | 15445 | 97.7 | 817 | 797 | 149.9 |
| B | 14 | 111 | 14309 | 90.12 | 817 | 797 | 149.9 |
| C | 14 | 238 | 127258 | 683.18 | 793 | 801 | 185.1 |
| C | 0 | 10 | 13581 | 69.04 | 793 | 801 | 185.1 |
| C | 13 | 61 | 5536 | 25.58 | 793 | 801 | 185.1 |
| D | 12 | 227 | 107978 | 565.88 | 784 | 760 | 189.5 |
| D | 1 | 52 | 25644 | 131.33 | 784 | 760 | 189.5 |
| D | 2 | 234 | 21931 | 111.74 | 784 | 760 | 189.5 |
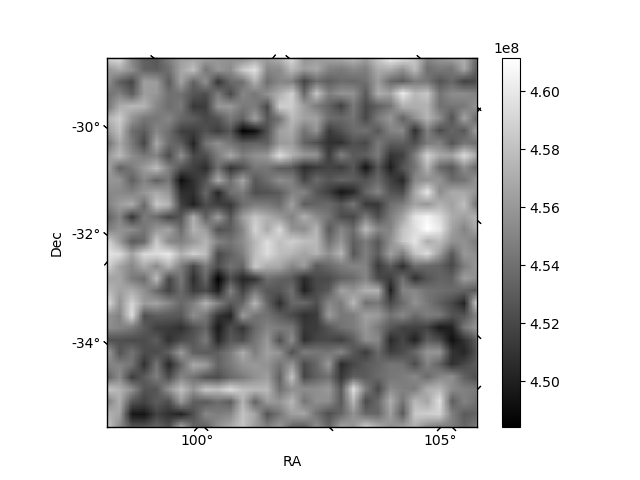
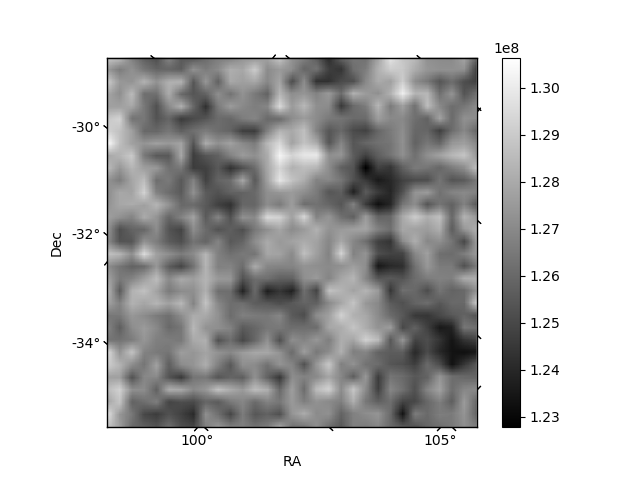
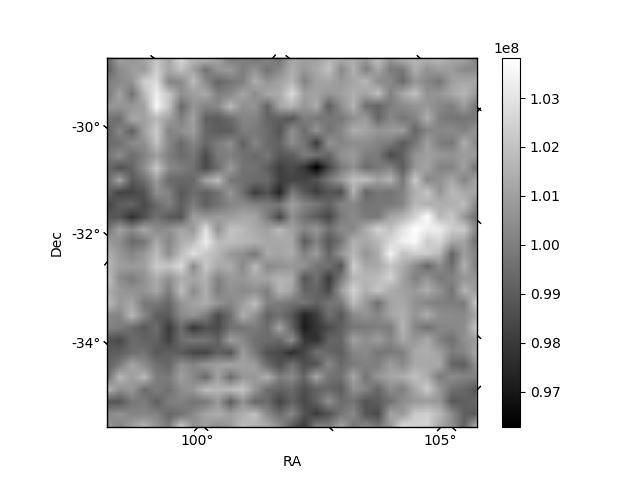
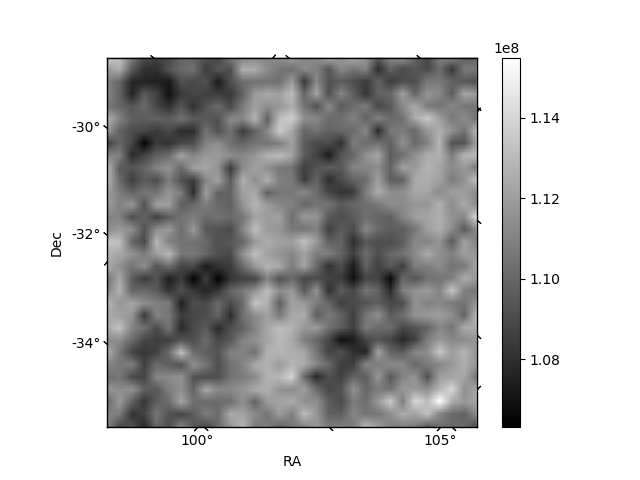
Histogram calculated using DETX and DETY for each event in the final _common_clean file
| Quadrant A | 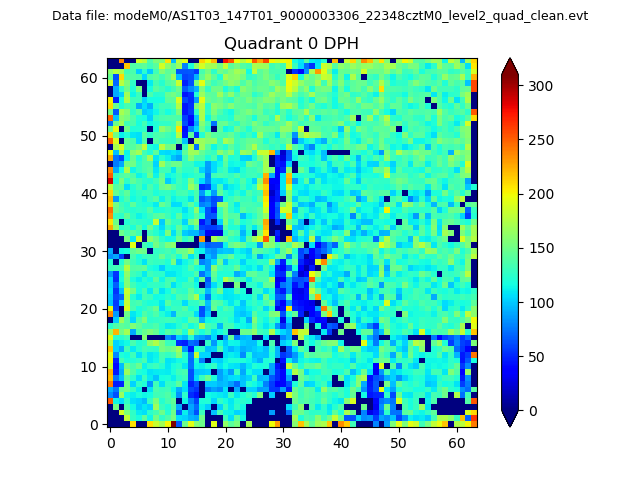 |
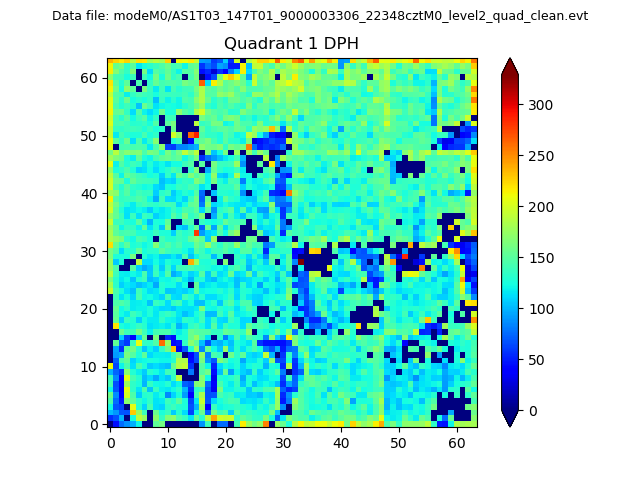 |
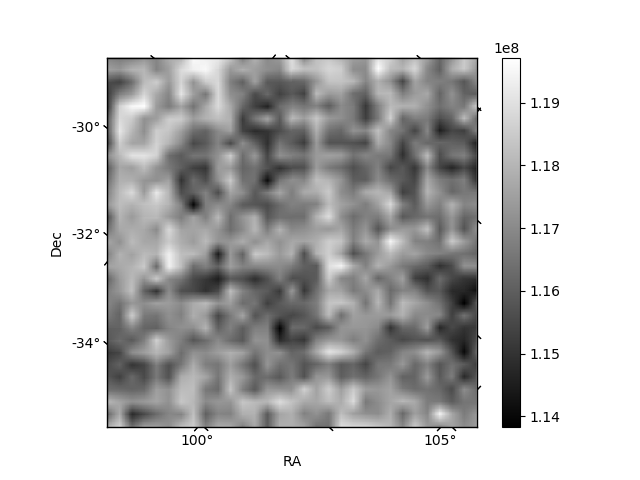
Quadrant B |
|---|---|---|---|
| Quadrant D | 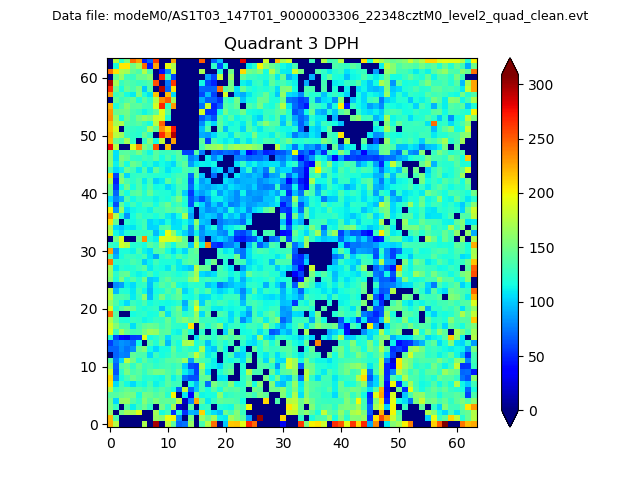 |
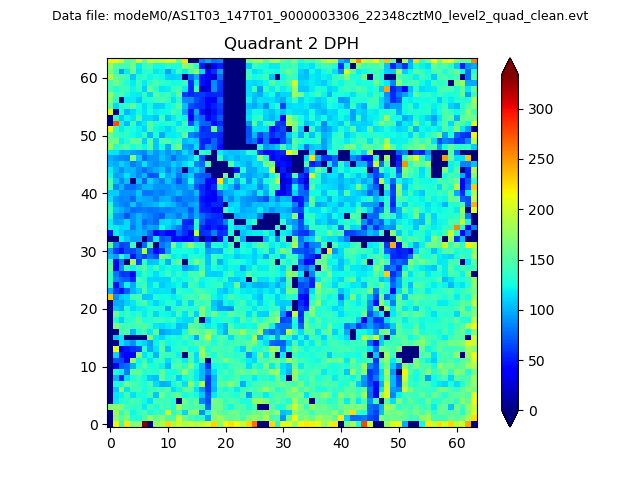 |
Quadrant C |
| Plot type | Count rate plots | Images |
|---|---|---|
| Comparison with Poisson distribution Blue bars denote a histogram of data divided into 1 sec bins. Red curve is a Poisson curve with rate = median count rate of data. |
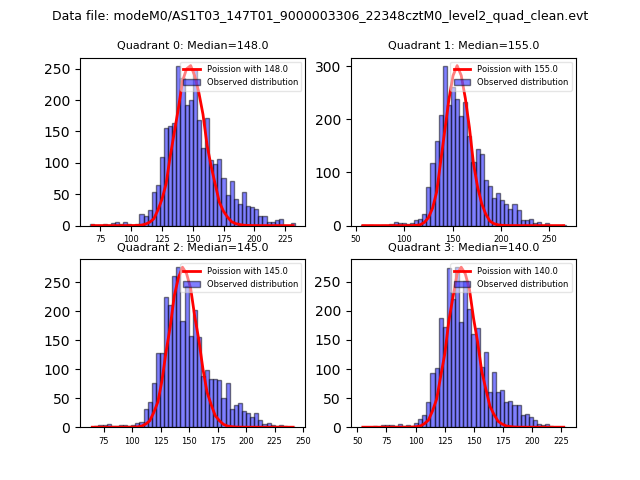 |
 |
| Quadrant-wise count rates Data is divided into 100 sec bins |
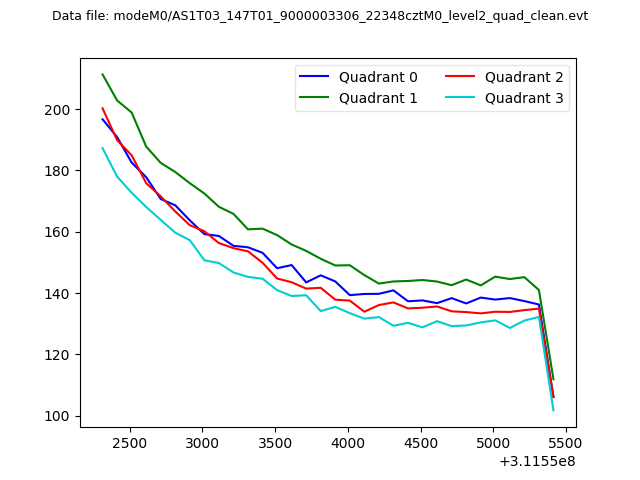 |
|
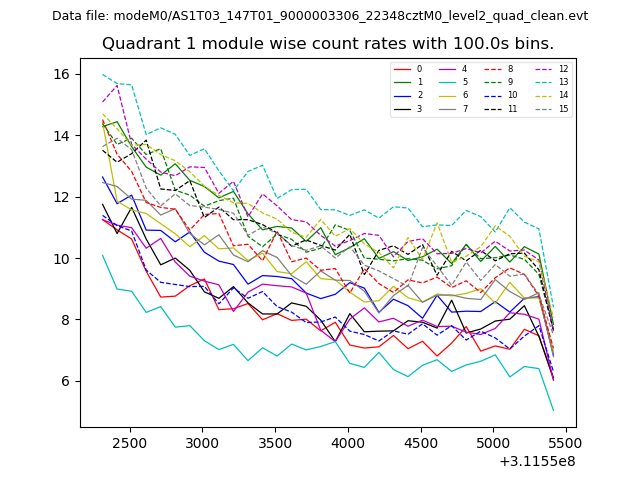
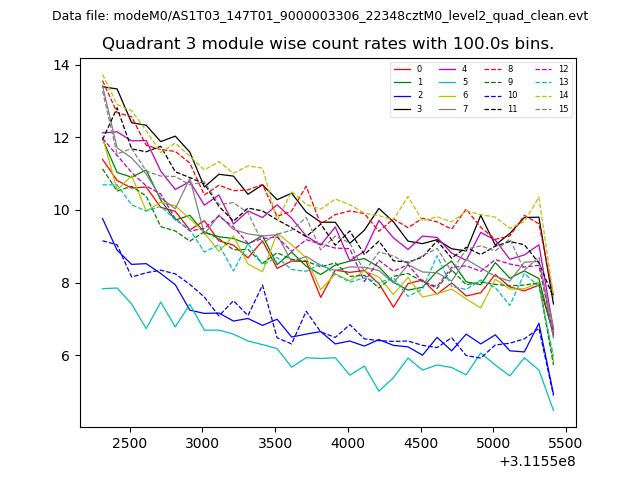
| Module-wise count rates for Quadrant A Data is divided into 100 sec bins |
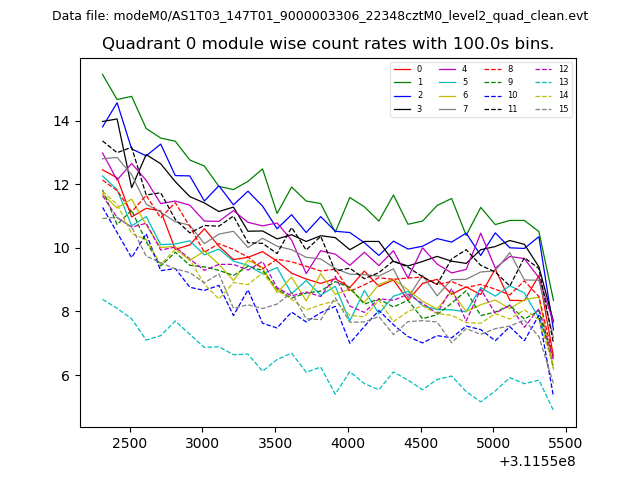 |
 |
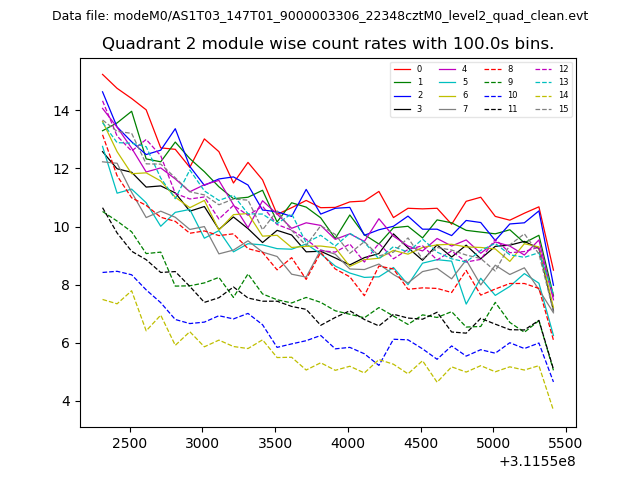
| Module-wise count rates for Quadrant B Data is divided into 100 sec bins |
 |
 |
| Module-wise count rates for Quadrant C Data is divided into 100 sec bins |
 |
 |
| Module-wise count rates for Quadrant D Data is divided into 100 sec bins |
 |
 |
| Parameter | Plot |
|---|---|
| CZT HV Monitor | 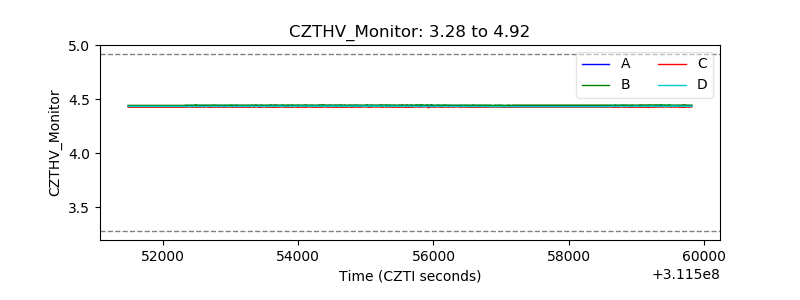 |
| D_VDD |  |
| Temperature 1 | 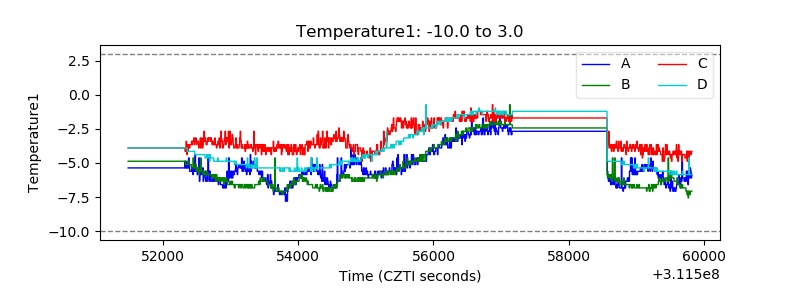 |
| Veto HV Monitor | 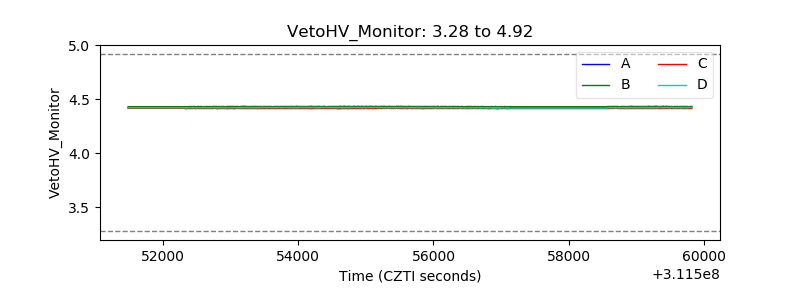 |
| Veto LLD | 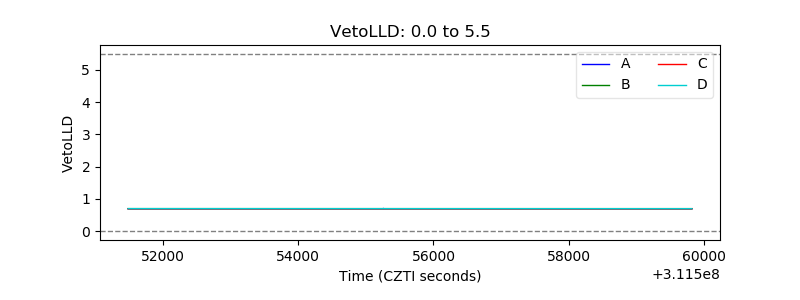 |
| Alpha Counter | 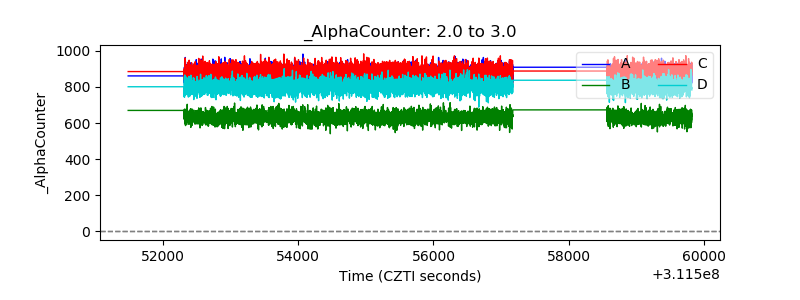 |
| _CPM_Rate | 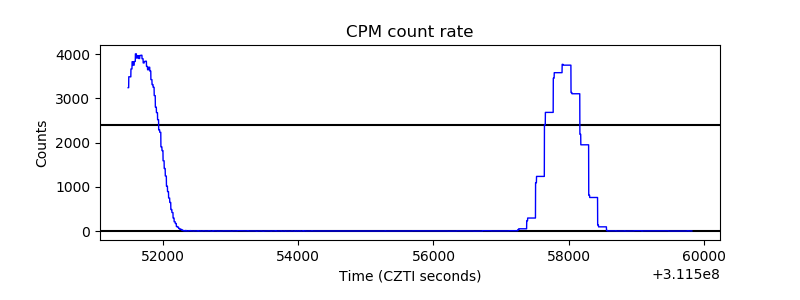 |
| CZT Counter | 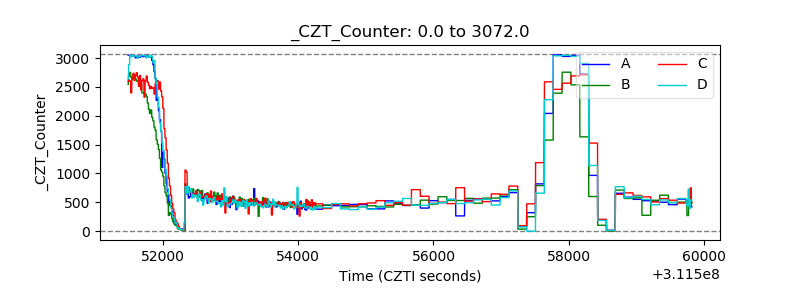 |
| +2.5 Volts monitor |  |
| +5 Volts monitor |  |
| _ROLL_ROT | 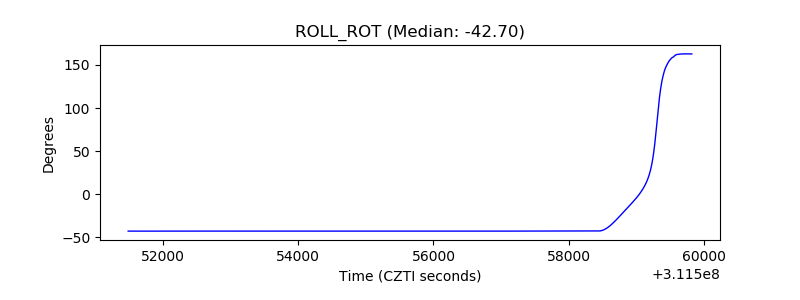 |
| _Roll_DEC | 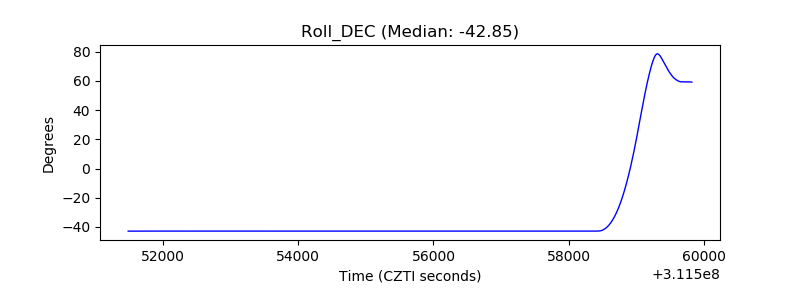 |
| _Roll_RA |  |
| Veto Counter | 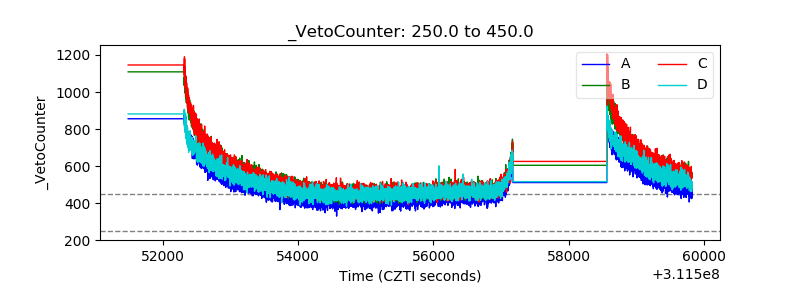 |