| Param | Original file | Final file |
|---|---|---|
| Filename | modeM0/AS1A07_007T04_9000003310cztM0_level2.fits | modeM0/AS1A07_007T04_9000003310cztM0_level2_quad_clean.evt |
| Size (bytes) | 23,595,840 | 19,370,880 |
| Size | 22.5 MB | 18.5 MB |
| Events in quadrant A | 146,388 | 111,812 |
| Events in quadrant B | 139,756 | 110,839 |
| Events in quadrant C | 142,474 | 105,262 |
| Events in quadrant D | 125,558 | 97,016 |
| Mode M0 | |||
|---|---|---|---|
| Quadrant | BADHDUFLAG | Total packets | Discarded packets |
| A | 0 | 4749 | 0 |
| B | 0 | 4837 | 0 |
| C | 0 | 4738 | 0 |
| D | 0 | 4929 | 0 |
| Mode SS | |||
|---|---|---|---|
| Quadrant | BADHDUFLAG | Total packets | Discarded packets |
| A | 0 | 44 | 0 |
| B | 0 | 44 | 0 |
| C | 0 | 44 | 0 |
| D | 0 | 44 | 0 |
| Mode M9 | |||
|---|---|---|---|
| Quadrant | BADHDUFLAG | Total packets | Discarded packets |
| A | 1 | 140431603648552 | 140428250710062 |
| B | 1 | 140431603648552 | 140428250710062 |
| C | 1 | 140431603648552 | 140428250710062 |
| D | 1 | 140431603648552 | 140428250710062 |
| Quadrant | Total seconds | Saturated seconds | Saturation percentage |
|---|---|---|---|
| A | 2224 | 3 | 0.134892% |
| B | 2224 | 6 | 0.269784% |
| C | 2224 | 21 | 0.944245% |
| D | 2224 | 7 | 0.314748% |
Noise dominated data is calculated using 1-second bins in cleaned event files. If a bin has >2000 counts, and if more than 50% of those come from <1% of pixels, then it is considered to be noise-dominated and hence unusable.
| Quadrant | # 1 sec bins | Bins with >0 counts | Bins with >2000 counts | High rate bins dominated by noise | Noise dominated (total time) | Noise dominated (detector-on time) | Marked lightcurve |
|---|---|---|---|---|---|---|---|
| A | 2223 | 2223 | 0 | 0 | 0.00% | 0.00% | 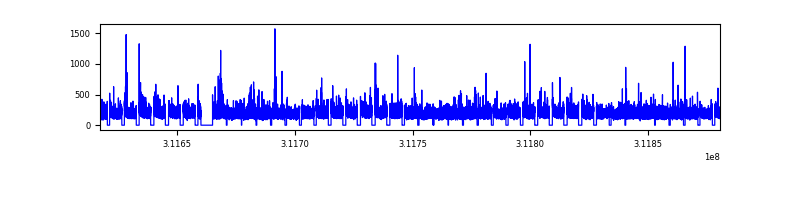 |
| B | 2223 | 2223 | 0 | 0 | 0.00% | 0.00% |  |
| C | 2223 | 2223 | 0 | 0 | 0.00% | 0.00% | 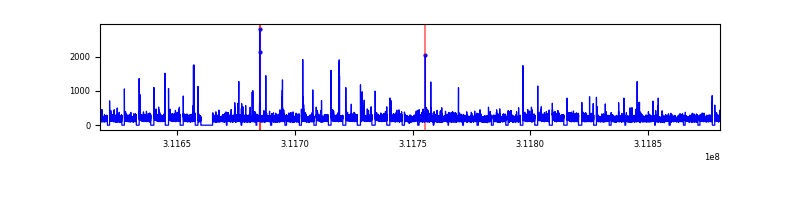 |
| D | 2223 | 2223 | 0 | 0 | 0.00% | 0.00% |  |
Top three noisy pixels from each quadrant. If the there are fewer than three noisy pixels in the level2.evt file, extra rows are filled as -1
| Pixel properties | Quadrant properties | ||||||
|---|---|---|---|---|---|---|---|
| Quadrant | DetID | PixID | Counts | Sigma | Mean | Median | Sigma |
| A | 7 | 110 | 128 | 8.01 | 38 | 36 | 11.5 |
| A | 0 | 29 | 120 | 7.31 | 38 | 36 | 11.5 |
| A | 14 | 79 | 113 | 6.7 | 38 | 36 | 11.5 |
| B | 2 | 9 | 105 | 7.37 | 37 | 35 | 9.5 |
| B | 5 | 128 | 104 | 7.27 | 37 | 35 | 9.5 |
| B | 5 | 255 | 103 | 7.16 | 37 | 35 | 9.5 |
| C | 1 | 81 | 116 | 7.24 | 37 | 35 | 11.2 |
| C | 3 | 234 | 108 | 6.52 | 37 | 35 | 11.2 |
| C | 1 | 80 | 103 | 6.07 | 37 | 35 | 11.2 |
| D | 13 | 238 | 96 | 5.87 | 35 | 32 | 10.9 |
| D | 7 | 4 | 96 | 5.87 | 35 | 32 | 10.9 |
| D | 3 | 14 | 96 | 5.87 | 35 | 32 | 10.9 |
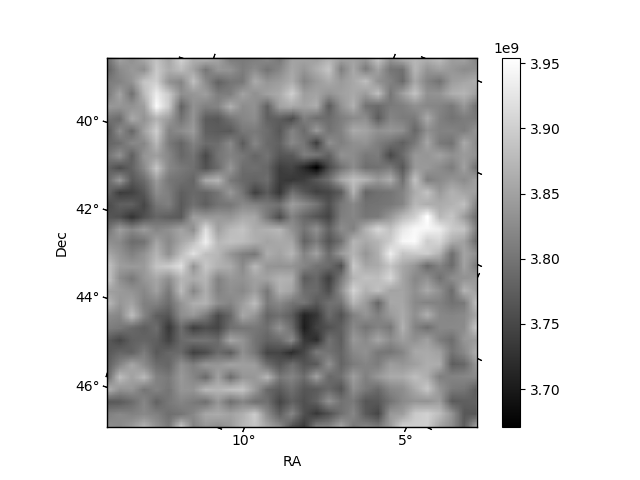
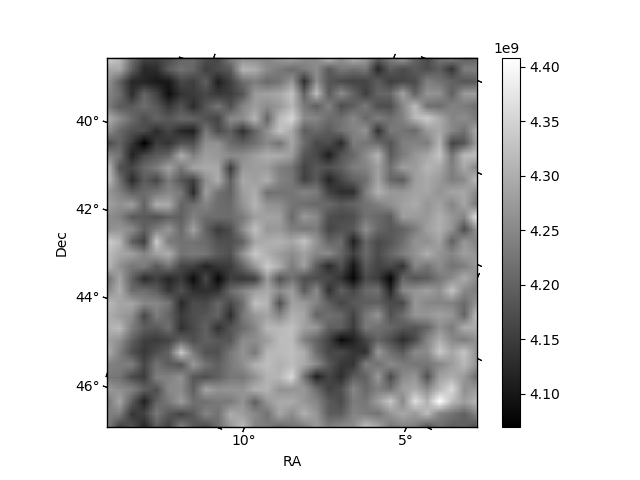
Histogram calculated using DETX and DETY for each event in the final _common_clean file
| Quadrant A |  |
 |
Quadrant B |
|---|---|---|---|
| Quadrant D | 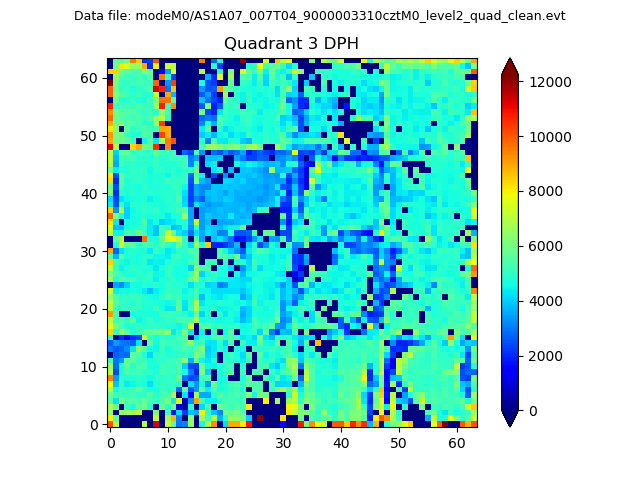 |
 |
Quadrant C |
| Plot type | Count rate plots | Images |
|---|---|---|
| Comparison with Poisson distribution Blue bars denote a histogram of data divided into 1 sec bins. Red curve is a Poisson curve with rate = median count rate of data. |
 |
 |
| Quadrant-wise count rates Data is divided into 100 sec bins |
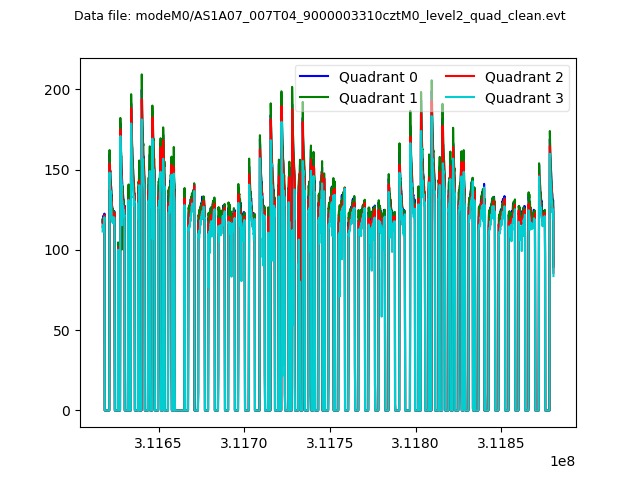 |
|
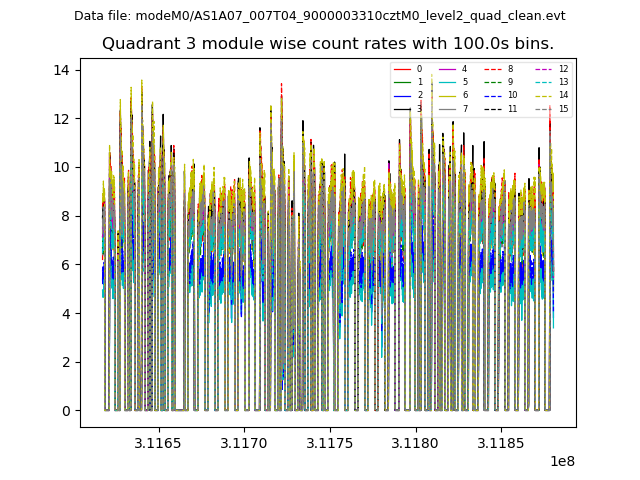
| Module-wise count rates for Quadrant A Data is divided into 100 sec bins |
 |
 |
| Module-wise count rates for Quadrant B Data is divided into 100 sec bins |
 |
 |
| Module-wise count rates for Quadrant C Data is divided into 100 sec bins |
 |
 |
| Module-wise count rates for Quadrant D Data is divided into 100 sec bins |
 |
 |
| Parameter | Plot |
|---|---|
| CZT HV Monitor |  |
| D_VDD |  |
| Temperature 1 |  |
| Veto HV Monitor |  |
| Veto LLD |  |
| Alpha Counter |  |
| _CPM_Rate |  |
| CZT Counter |  |
| +2.5 Volts monitor | 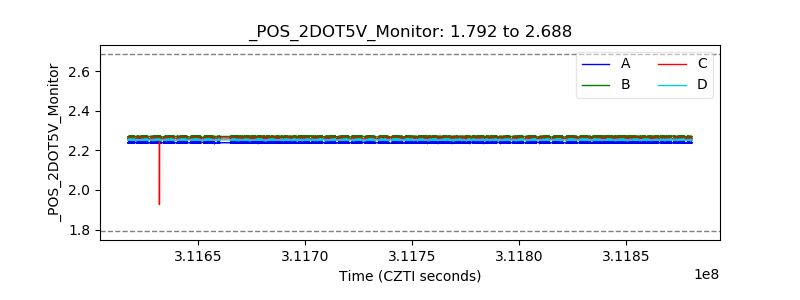 |
| +5 Volts monitor |  |
| _ROLL_ROT | 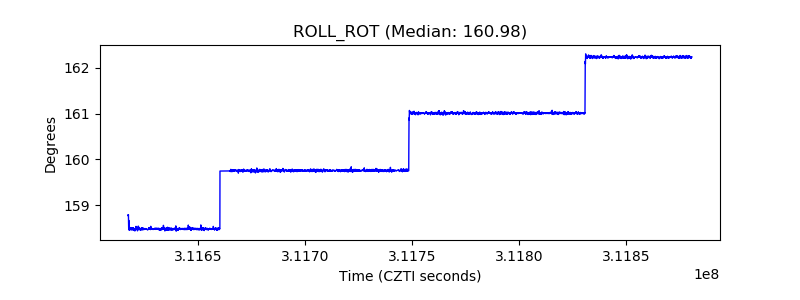 |
| _Roll_DEC | 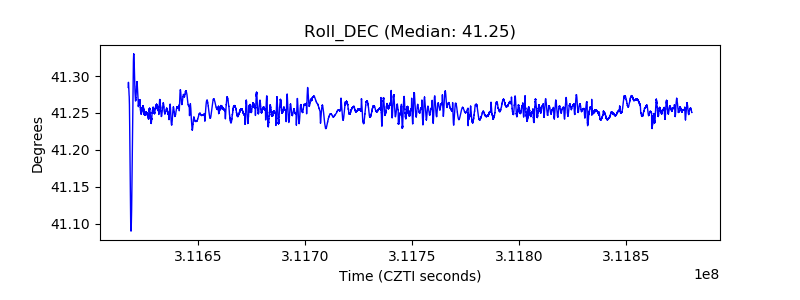 |
| _Roll_RA | 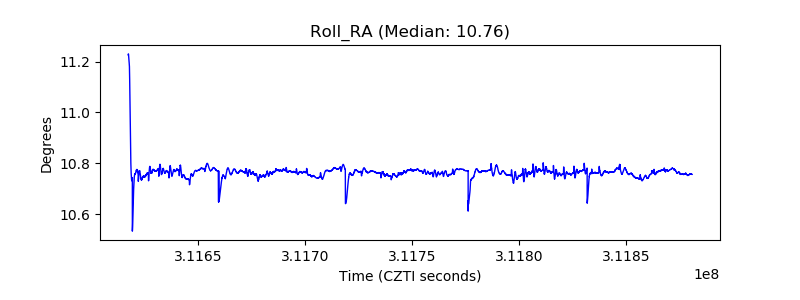 |
| Veto Counter |  |