| Param | Original file | Final file |
|---|---|---|
| Filename | modeM0/AS1A07_007T04_9000003310_22358cztM0_level2.evt | modeM0/AS1A07_007T04_9000003310_22358cztM0_level2_quad_clean.evt |
| Size (bytes) | 301,780,800 | 56,761,920 |
| Size | 287.8 MB | 54.1 MB |
| Events in quadrant A | 2,094,060 | 356,962 |
| Events in quadrant B | 2,172,321 | 358,649 |
| Events in quadrant C | 2,143,805 | 348,763 |
| Events in quadrant D | 2,421,808 | 337,470 |
| Mode M0 | |||
|---|---|---|---|
| Quadrant | BADHDUFLAG | Total packets | Discarded packets |
| A | 0 | 9300 | 1 |
| B | 0 | 9436 | 1 |
| C | 0 | 9316 | 1 |
| D | 0 | 10337 | 1 |
| Mode SS | |||
|---|---|---|---|
| Quadrant | BADHDUFLAG | Total packets | Discarded packets |
| A | 0 | 92 | 0 |
| B | 0 | 92 | 0 |
| C | 0 | 92 | 0 |
| D | 0 | 92 | 0 |
| Mode M9 | |||
|---|---|---|---|
| Quadrant | BADHDUFLAG | Total packets | Discarded packets |
| A | 0 | 9 | 0 |
| B | 0 | 9 | 0 |
| C | 0 | 9 | 0 |
| D | 0 | 9 | 0 |
| Quadrant | Total seconds | Saturated seconds | Saturation percentage |
|---|---|---|---|
| A | 4503 | 41 | 0.910504% |
| B | 4503 | 45 | 0.999334% |
| C | 4503 | 66 | 1.465690% |
| D | 4502 | 87 | 1.932474% |
Noise dominated data is calculated using 1-second bins in cleaned event files. If a bin has >2000 counts, and if more than 50% of those come from <1% of pixels, then it is considered to be noise-dominated and hence unusable.
| Quadrant | # 1 sec bins | Bins with >0 counts | Bins with >2000 counts | High rate bins dominated by noise | Noise dominated (total time) | Noise dominated (detector-on time) | Marked lightcurve |
|---|---|---|---|---|---|---|---|
| A | 5468 | 4503 | 0 | 0 | 0.00% | 0.00% | 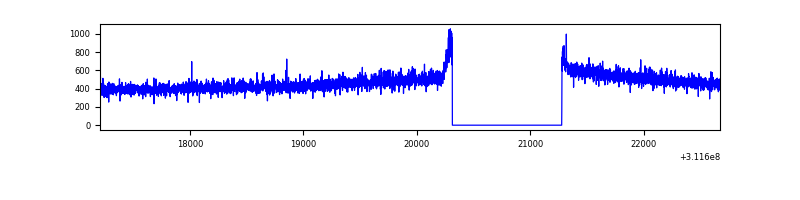 |
| B | 5468 | 4503 | 1 | 1 | 0.02% | 0.02% | 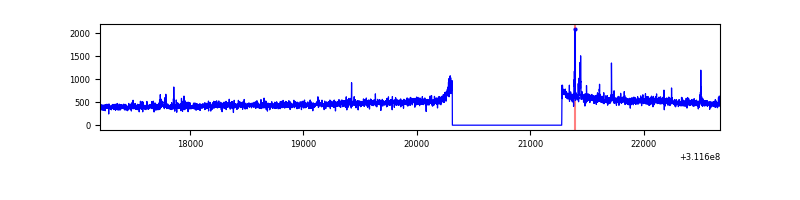 |
| C | 5468 | 4503 | 0 | 0 | 0.00% | 0.00% | 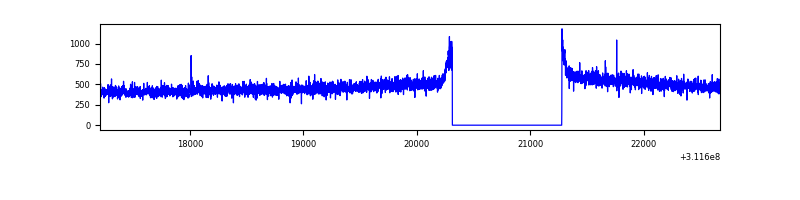 |
| D | 5467 | 4502 | 37 | 37 | 0.68% | 0.82% | 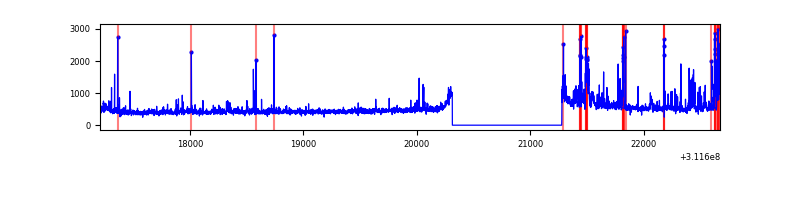 |
Top three noisy pixels from each quadrant. If the there are fewer than three noisy pixels in the level2.evt file, extra rows are filled as -1
| Pixel properties | Quadrant properties | ||||||
|---|---|---|---|---|---|---|---|
| Quadrant | DetID | PixID | Counts | Sigma | Mean | Median | Sigma |
| A | 13 | 254 | 5920 | 48.99 | 542 | 529 | 110.0 |
| A | 3 | 137 | 4749 | 38.35 | 542 | 529 | 110.0 |
| A | 0 | 226 | 4615 | 37.13 | 542 | 529 | 110.0 |
| B | 0 | 190 | 23010 | 212.73 | 542 | 528 | 105.7 |
| B | 0 | 229 | 14316 | 130.47 | 542 | 528 | 105.7 |
| B | 12 | 111 | 12509 | 113.37 | 542 | 528 | 105.7 |
| C | 14 | 238 | 83668 | 670.29 | 527 | 530 | 124.0 |
| C | 0 | 10 | 4423 | 31.39 | 527 | 530 | 124.0 |
| C | 13 | 61 | 3663 | 25.26 | 527 | 530 | 124.0 |
| D | 1 | 52 | 306801 | 2350.53 | 530 | 514 | 130.3 |
| D | 12 | 227 | 71945 | 548.18 | 530 | 514 | 130.3 |
| D | 2 | 234 | 18707 | 139.62 | 530 | 514 | 130.3 |
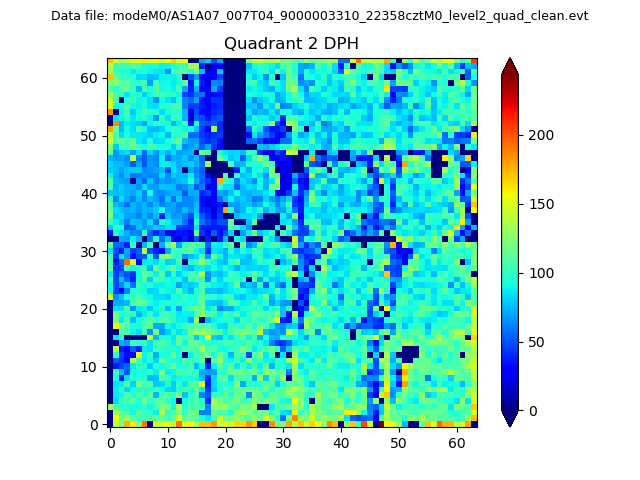
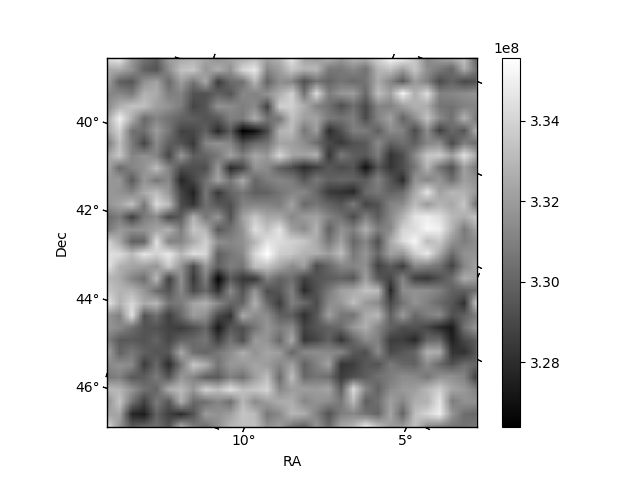
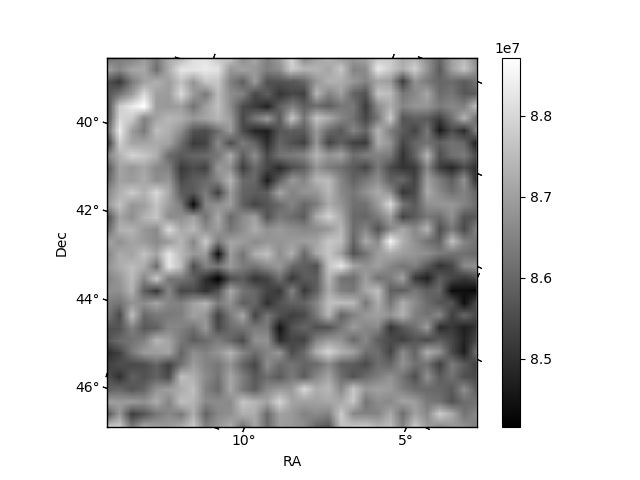
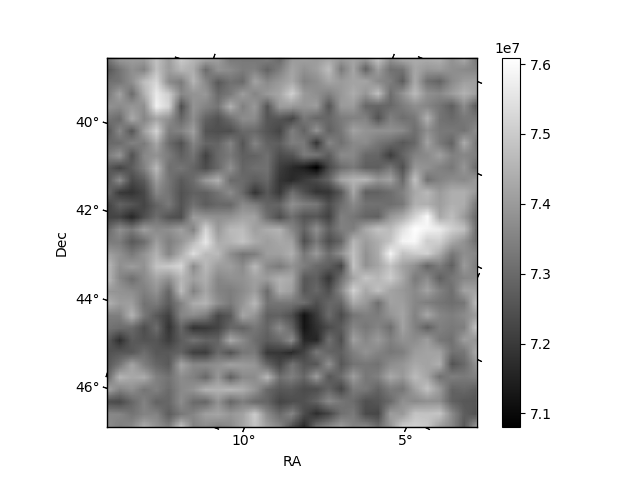
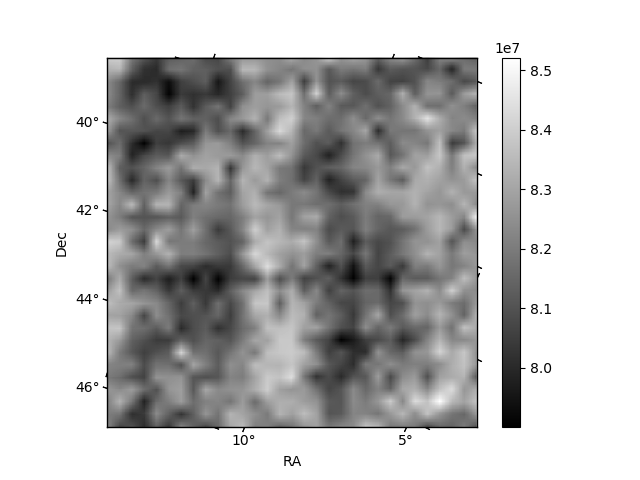
Histogram calculated using DETX and DETY for each event in the final _common_clean file
| Quadrant A | 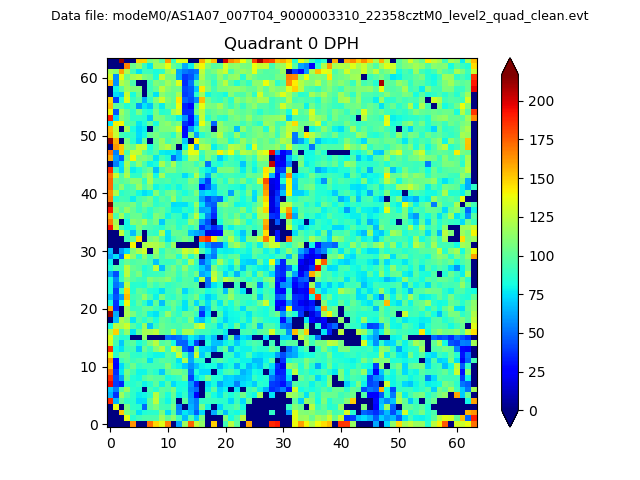 |
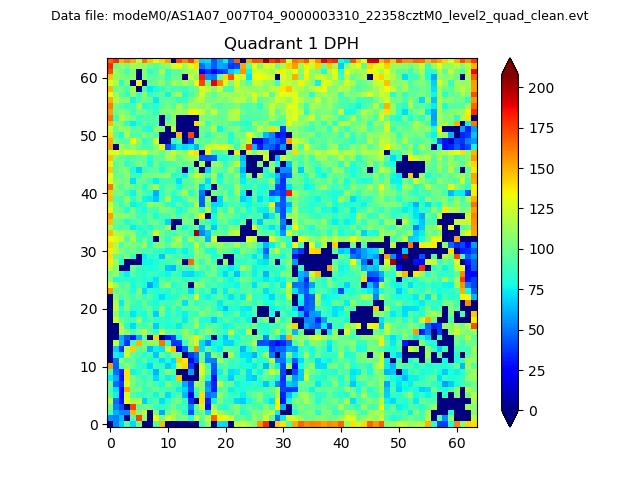 |
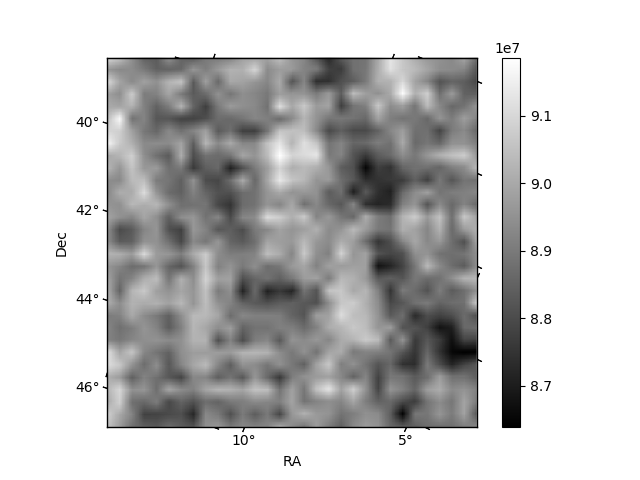
Quadrant B |
|---|---|---|---|
| Quadrant D | 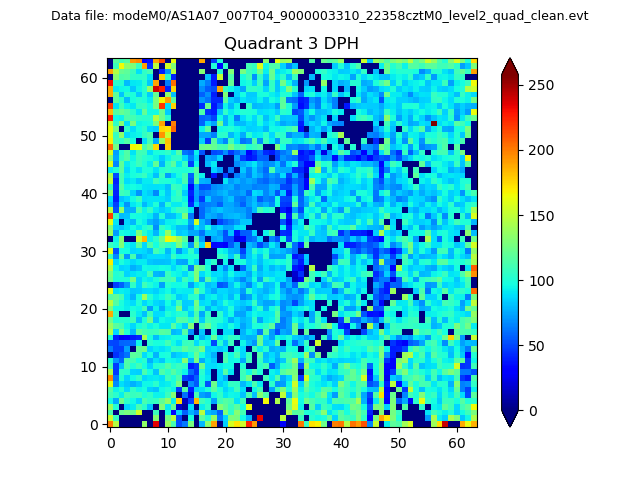 |
 |
Quadrant C |
| Plot type | Count rate plots | Images |
|---|---|---|
| Comparison with Poisson distribution Blue bars denote a histogram of data divided into 1 sec bins. Red curve is a Poisson curve with rate = median count rate of data. |
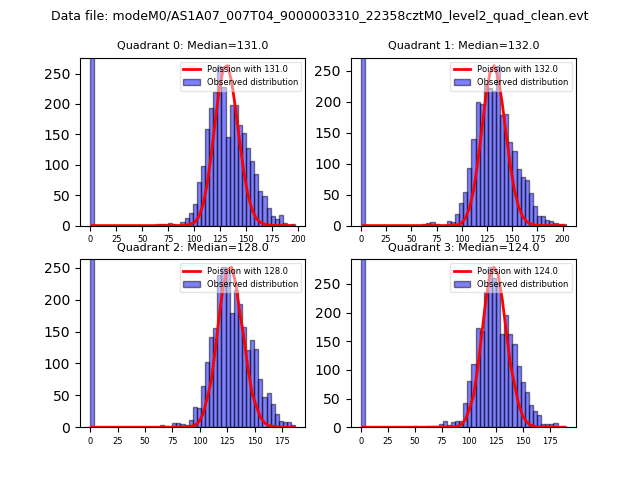 |
 |
| Quadrant-wise count rates Data is divided into 100 sec bins |
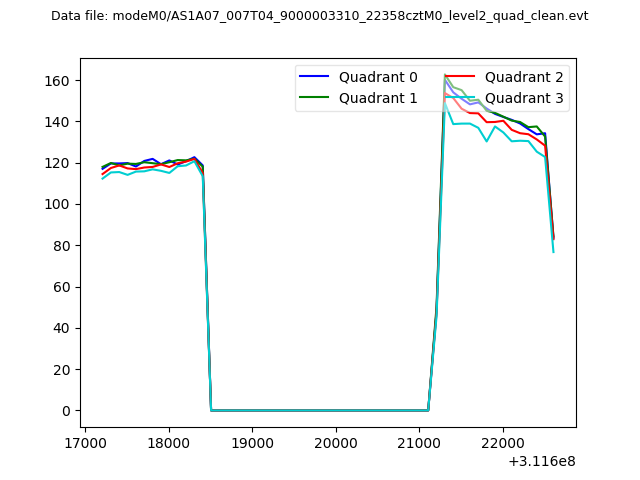 |
|
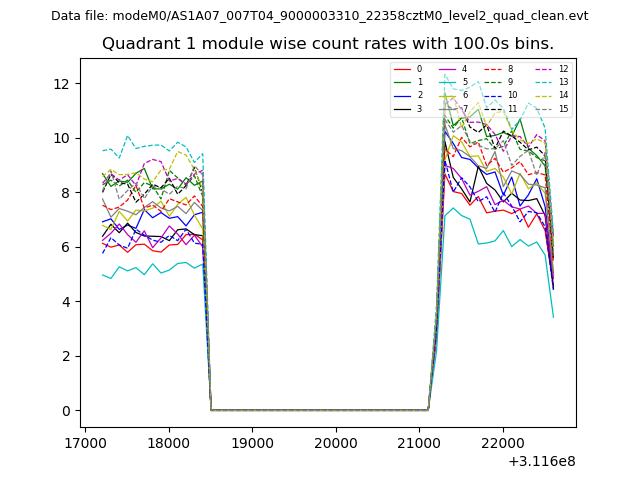
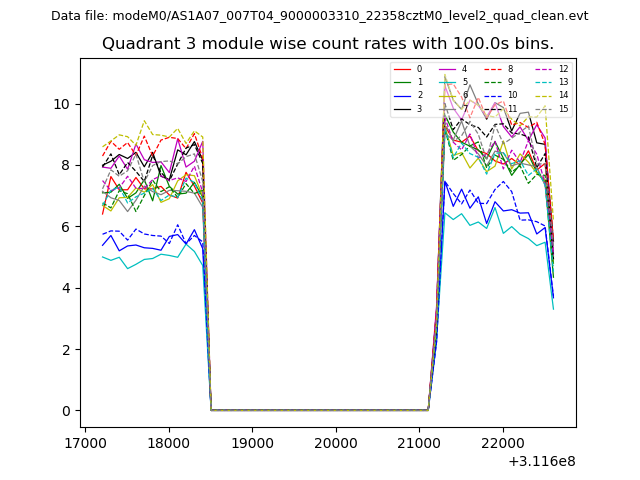
| Module-wise count rates for Quadrant A Data is divided into 100 sec bins |
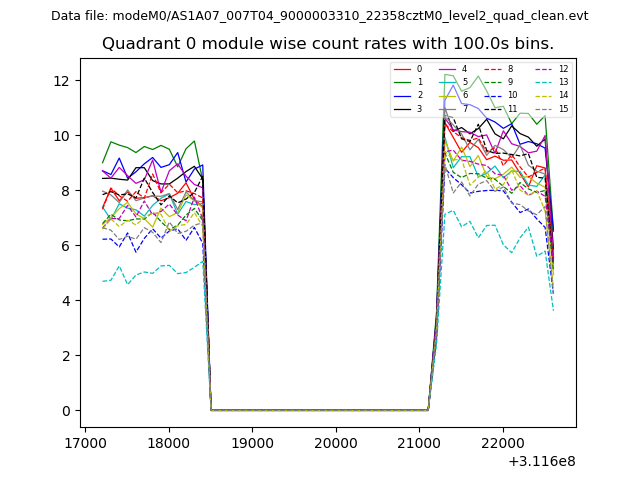 |
 |
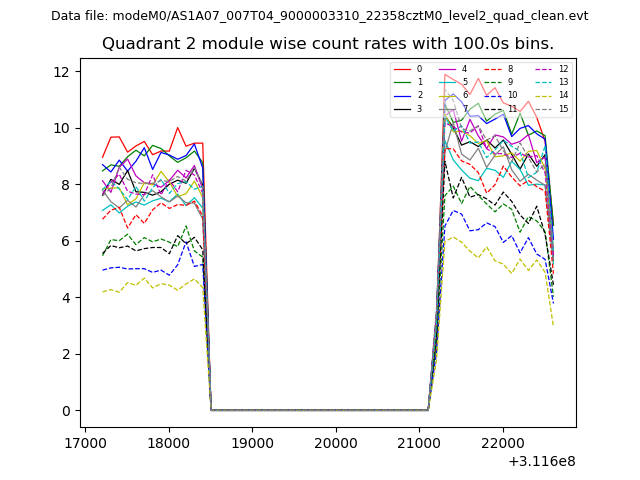
| Module-wise count rates for Quadrant B Data is divided into 100 sec bins |
 |
 |
| Module-wise count rates for Quadrant C Data is divided into 100 sec bins |
 |
 |
| Module-wise count rates for Quadrant D Data is divided into 100 sec bins |
 |
 |
| Parameter | Plot |
|---|---|
| CZT HV Monitor | 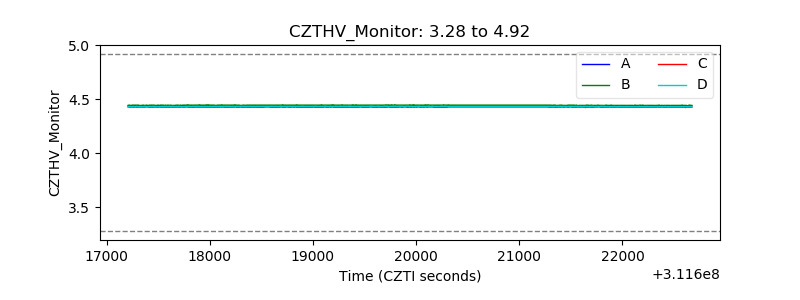 |
| D_VDD | 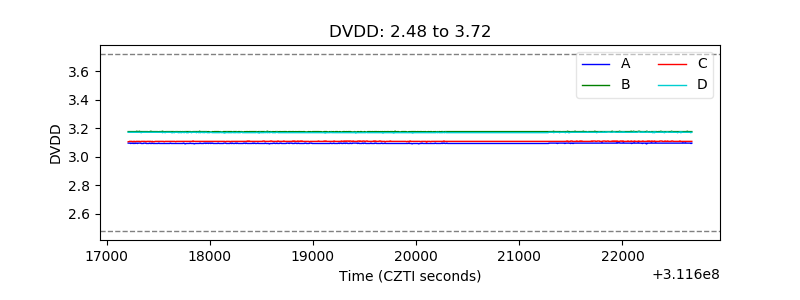 |
| Temperature 1 | 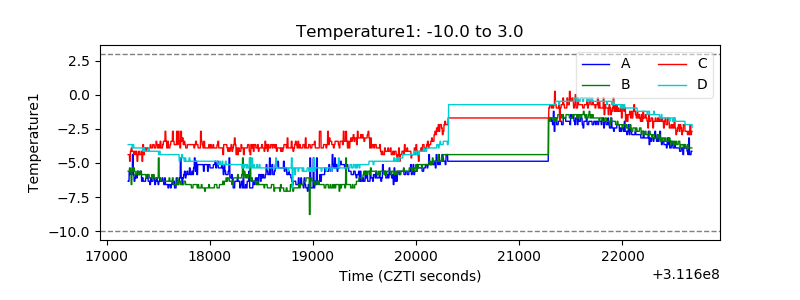 |
| Veto HV Monitor | 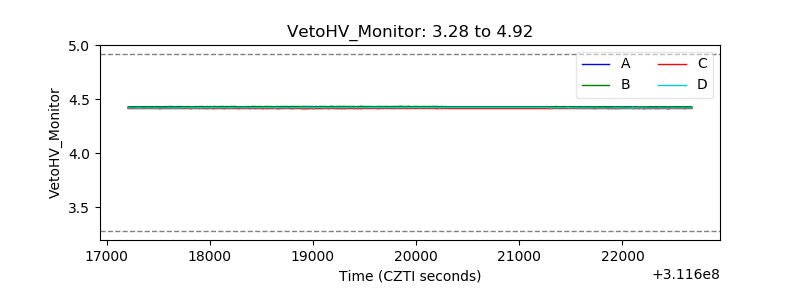 |
| Veto LLD | 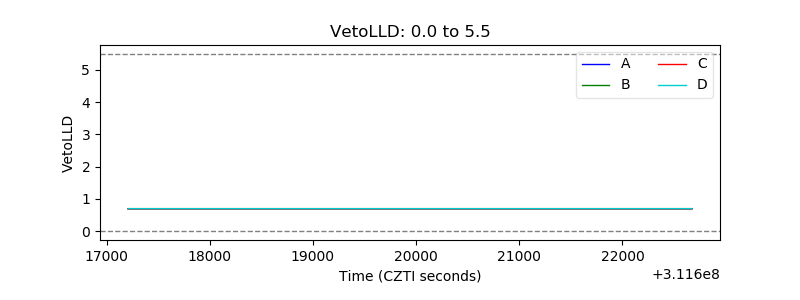 |
| Alpha Counter | 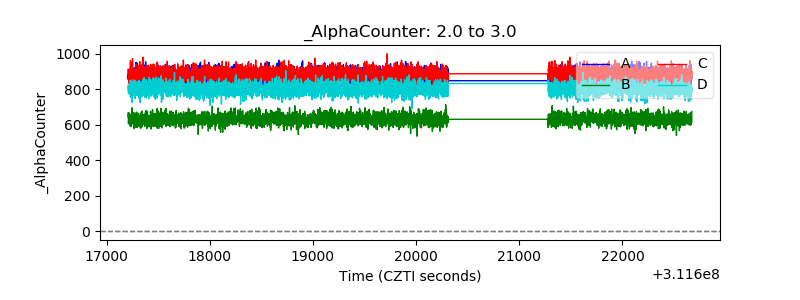 |
| _CPM_Rate | 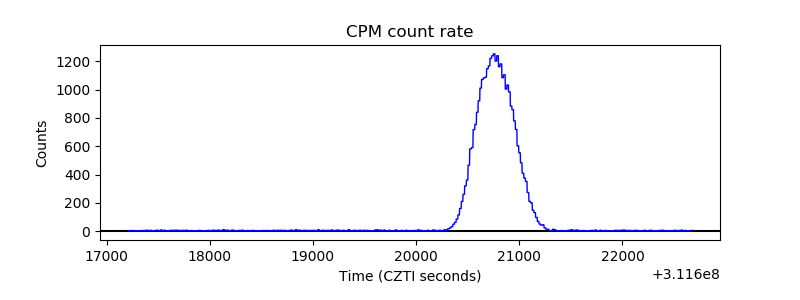 |
| CZT Counter | 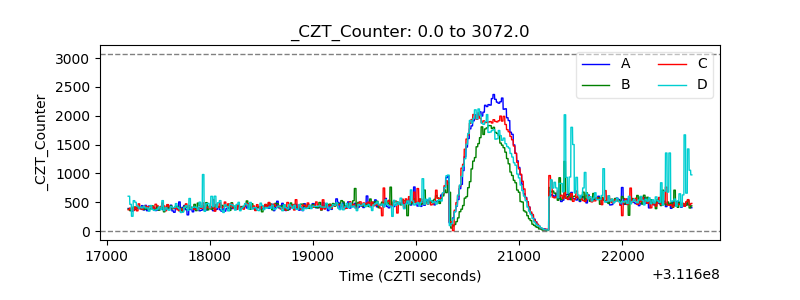 |
| +2.5 Volts monitor |  |
| +5 Volts monitor | 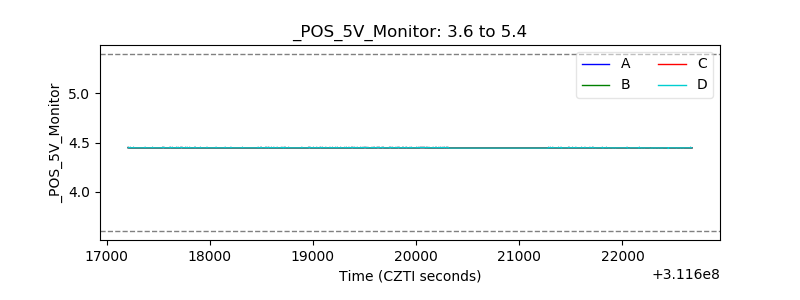 |
| _ROLL_ROT | 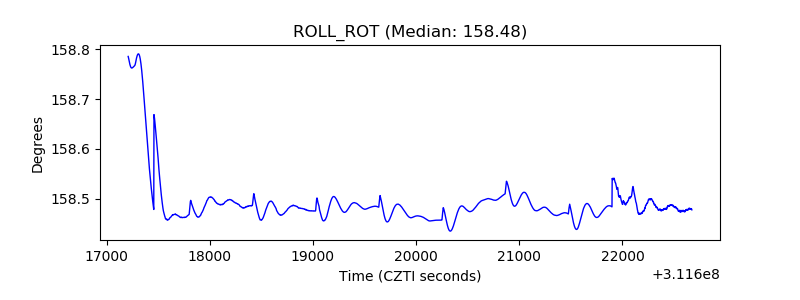 |
| _Roll_DEC |  |
| _Roll_RA | 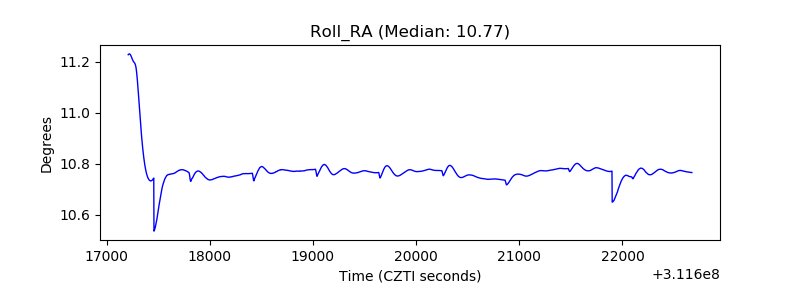 |
| Veto Counter | 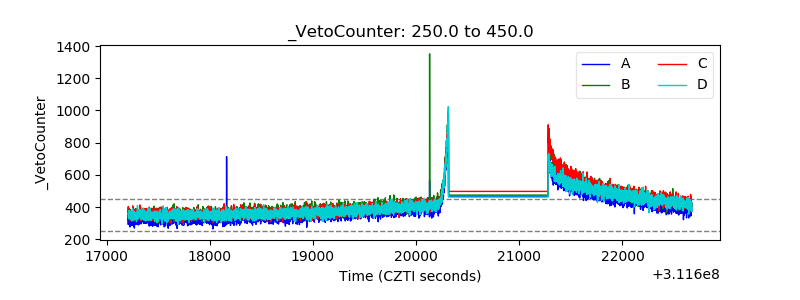 |