| Param | Original file | Final file |
|---|---|---|
| Filename | modeM0/AS1A07_007T04_9000003310_22360cztM0_level2.evt | modeM0/AS1A07_007T04_9000003310_22360cztM0_level2_quad_clean.evt |
| Size (bytes) | 463,216,320 | 94,507,200 |
| Size | 441.8 MB | 90.1 MB |
| Events in quadrant A | 3,085,592 | 618,305 |
| Events in quadrant B | 3,795,255 | 612,376 |
| Events in quadrant C | 3,133,281 | 602,958 |
| Events in quadrant D | 3,579,918 | 582,263 |
| Mode M0 | |||
|---|---|---|---|
| Quadrant | BADHDUFLAG | Total packets | Discarded packets |
| A | 0 | 13471 | 2 |
| B | 0 | 15669 | 3 |
| C | 0 | 13471 | 2 |
| D | 0 | 15246 | 2 |
| Mode SS | |||
|---|---|---|---|
| Quadrant | BADHDUFLAG | Total packets | Discarded packets |
| A | 0 | 130 | 0 |
| B | 0 | 130 | 0 |
| C | 0 | 130 | 0 |
| D | 0 | 130 | 0 |
| Mode M9 | |||
|---|---|---|---|
| Quadrant | BADHDUFLAG | Total packets | Discarded packets |
| A | 0 | 11 | 0 |
| B | 0 | 12 | 0 |
| C | 0 | 12 | 0 |
| D | 0 | 12 | 0 |
| Quadrant | Total seconds | Saturated seconds | Saturation percentage |
|---|---|---|---|
| A | 6394 | 41 | 0.641226% |
| B | 6393 | 243 | 3.801032% |
| C | 6393 | 81 | 1.267011% |
| D | 6393 | 140 | 2.189895% |
Noise dominated data is calculated using 1-second bins in cleaned event files. If a bin has >2000 counts, and if more than 50% of those come from <1% of pixels, then it is considered to be noise-dominated and hence unusable.
| Quadrant | # 1 sec bins | Bins with >0 counts | Bins with >2000 counts | High rate bins dominated by noise | Noise dominated (total time) | Noise dominated (detector-on time) | Marked lightcurve |
|---|---|---|---|---|---|---|---|
| A | 7499 | 6394 | 0 | 0 | 0.00% | 0.00% | 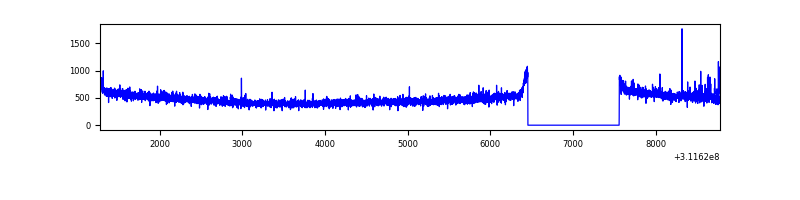 |
| B | 7498 | 6393 | 168 | 168 | 2.24% | 2.63% | 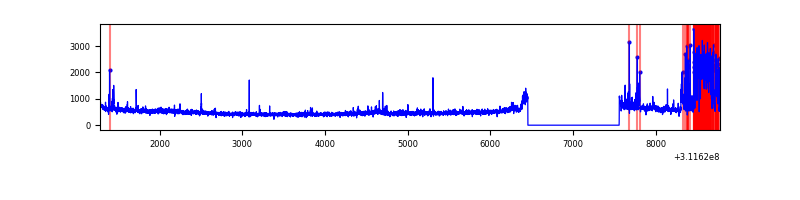 |
| C | 7498 | 6393 | 0 | 0 | 0.00% | 0.00% | 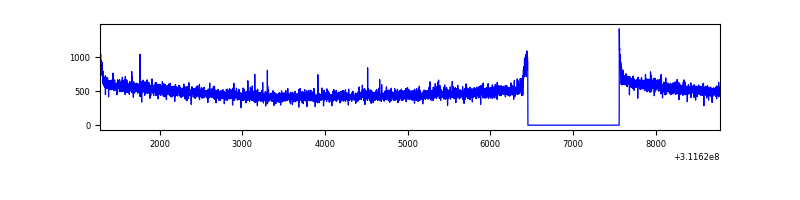 |
| D | 7498 | 6393 | 92 | 92 | 1.23% | 1.44% | 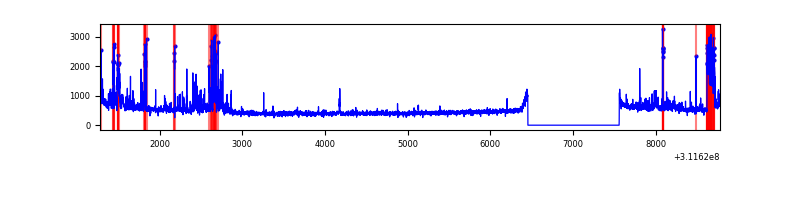 |
Top three noisy pixels from each quadrant. If the there are fewer than three noisy pixels in the level2.evt file, extra rows are filled as -1
| Pixel properties | Quadrant properties | ||||||
|---|---|---|---|---|---|---|---|
| Quadrant | DetID | PixID | Counts | Sigma | Mean | Median | Sigma |
| A | 3 | 1 | 34991 | 216.54 | 792 | 775 | 158.0 |
| A | 13 | 254 | 8819 | 50.91 | 792 | 775 | 158.0 |
| A | 3 | 137 | 6769 | 37.93 | 792 | 775 | 158.0 |
| B | 3 | 64 | 669062 | 4541.63 | 781 | 762 | 147.1 |
| B | 0 | 190 | 31176 | 206.69 | 781 | 762 | 147.1 |
| B | 0 | 229 | 21030 | 137.74 | 781 | 762 | 147.1 |
| C | 14 | 238 | 121208 | 674.19 | 768 | 773 | 178.6 |
| C | 0 | 10 | 9758 | 50.3 | 768 | 773 | 178.6 |
| C | 10 | 1 | 7779 | 39.22 | 768 | 773 | 178.6 |
| D | 1 | 52 | 328178 | 1744.65 | 774 | 752 | 187.7 |
| D | 7 | 38 | 170796 | 906.06 | 774 | 752 | 187.7 |
| D | 12 | 227 | 93530 | 494.36 | 774 | 752 | 187.7 |
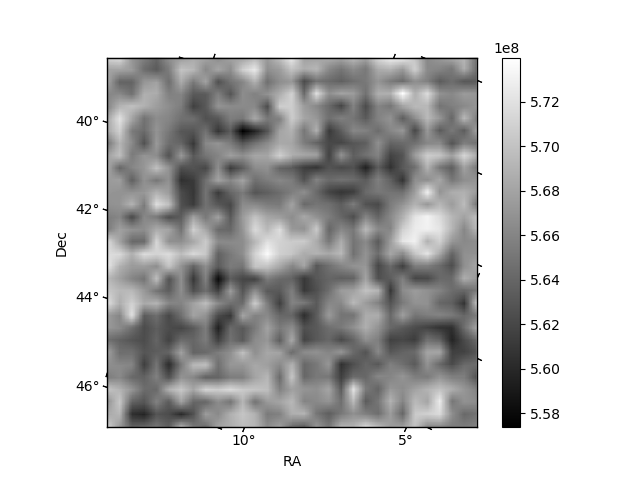
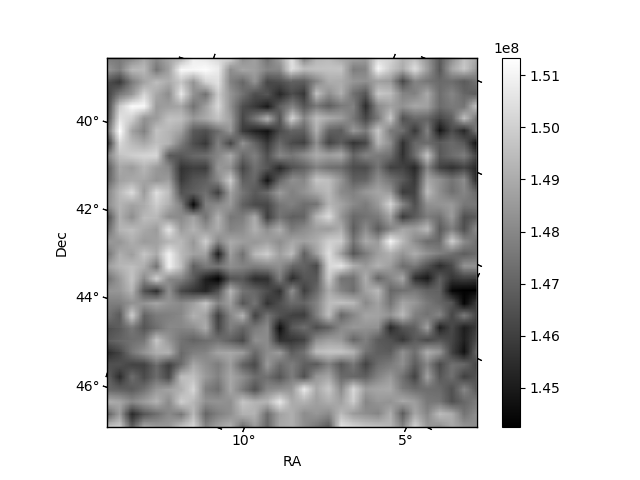
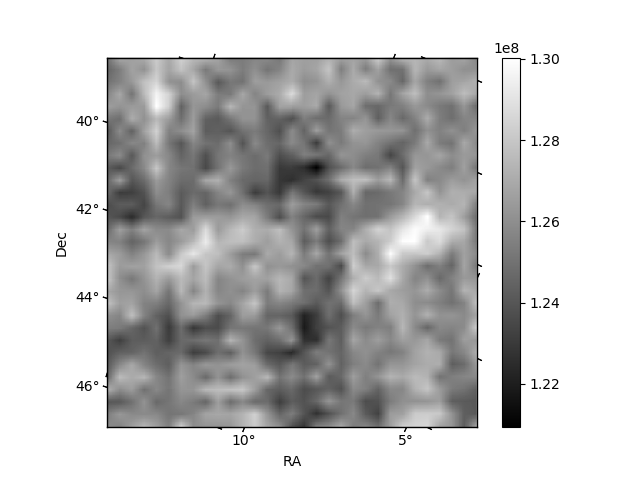
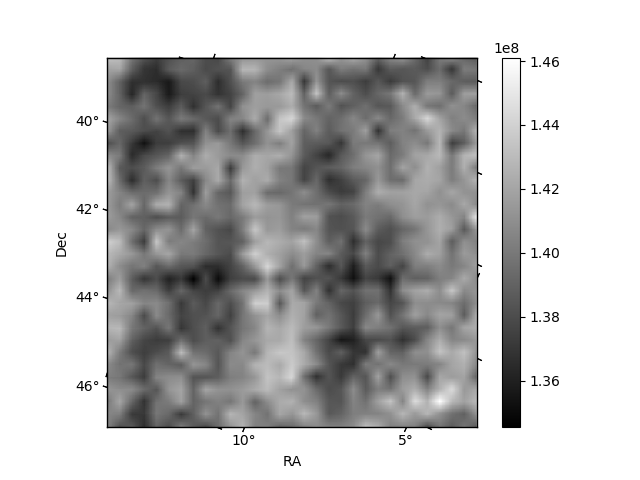
Histogram calculated using DETX and DETY for each event in the final _common_clean file
| Quadrant A | 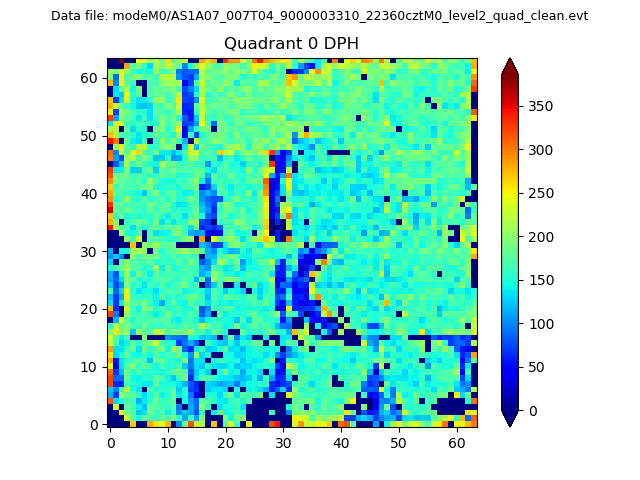 |
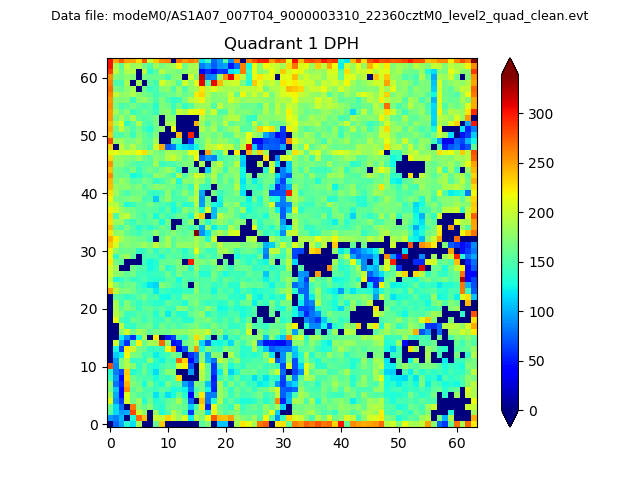 |
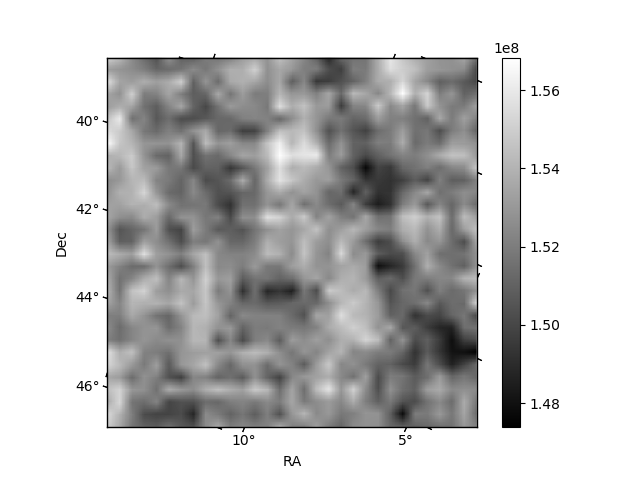
Quadrant B |
|---|---|---|---|
| Quadrant D | 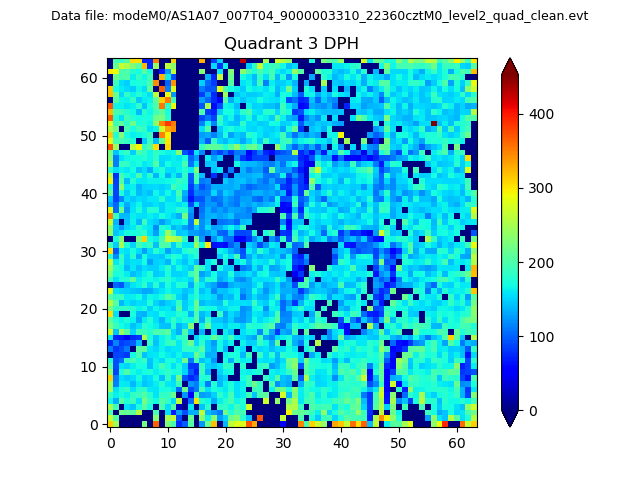 |
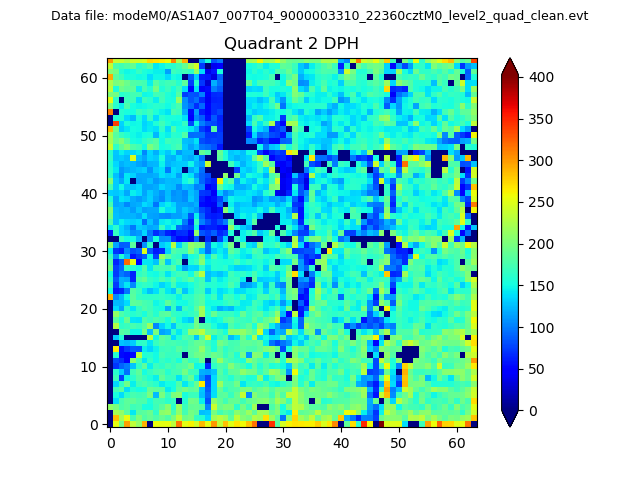 |
Quadrant C |
| Plot type | Count rate plots | Images |
|---|---|---|
| Comparison with Poisson distribution Blue bars denote a histogram of data divided into 1 sec bins. Red curve is a Poisson curve with rate = median count rate of data. |
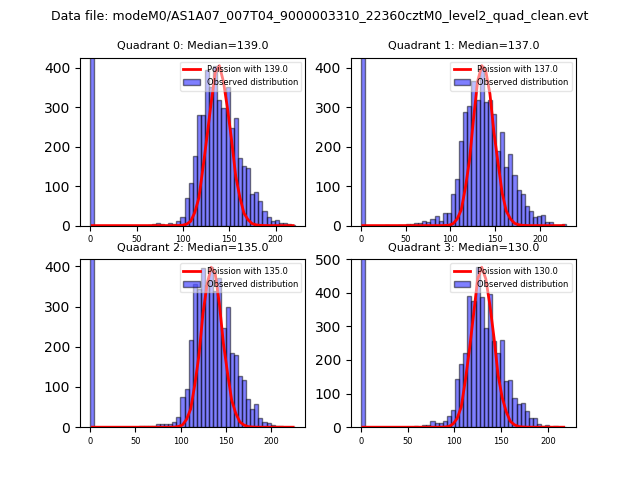 |
 |
| Quadrant-wise count rates Data is divided into 100 sec bins |
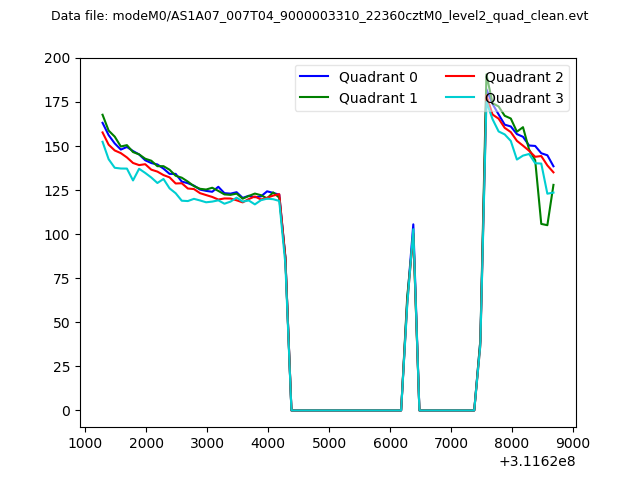 |
|
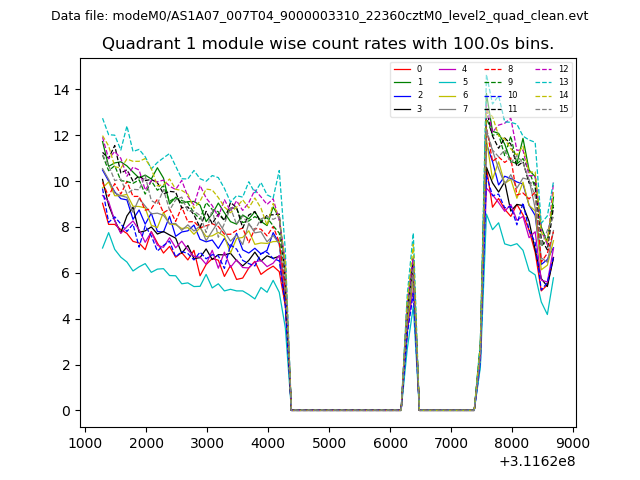
| Module-wise count rates for Quadrant A Data is divided into 100 sec bins |
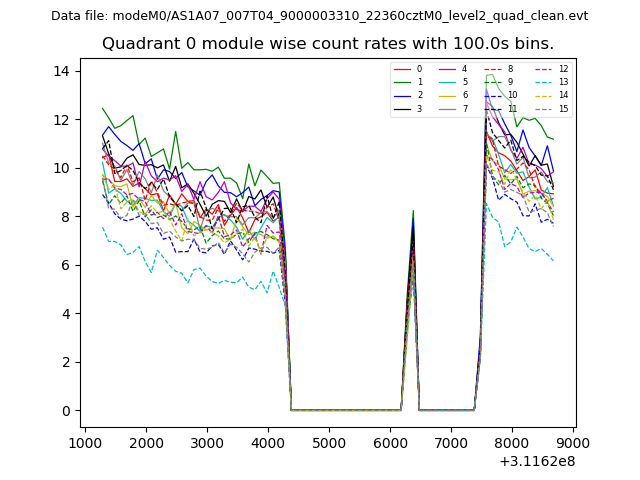 |
 |
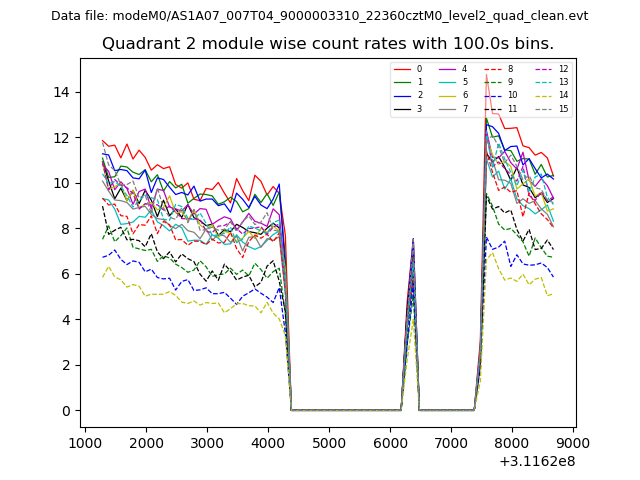
| Module-wise count rates for Quadrant B Data is divided into 100 sec bins |
 |
 |
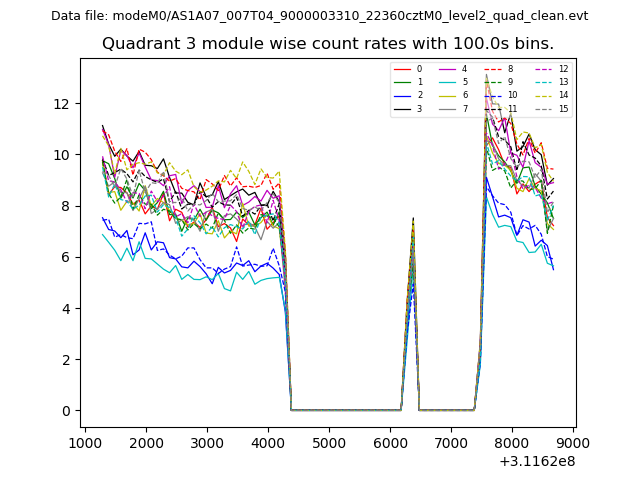
| Module-wise count rates for Quadrant C Data is divided into 100 sec bins |
 |
 |
| Module-wise count rates for Quadrant D Data is divided into 100 sec bins |
 |
 |
| Parameter | Plot |
|---|---|
| CZT HV Monitor | 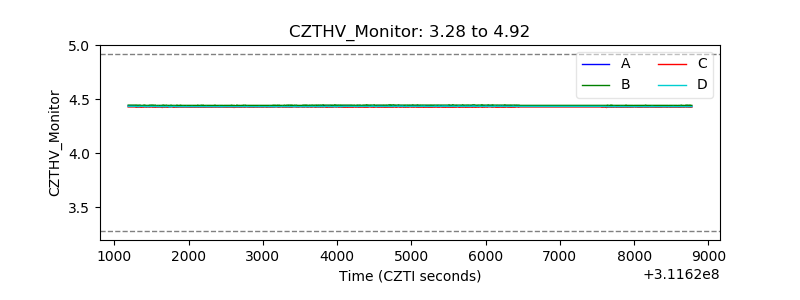 |
| D_VDD | 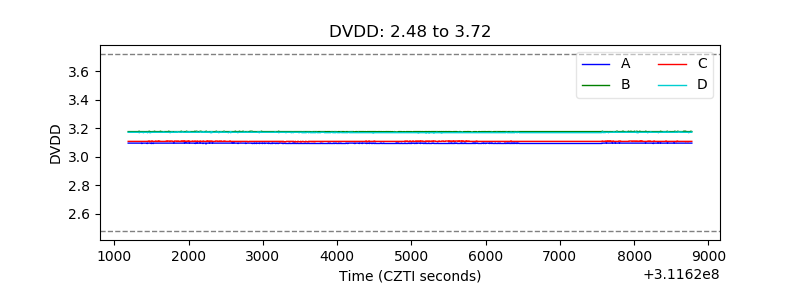 |
| Temperature 1 | 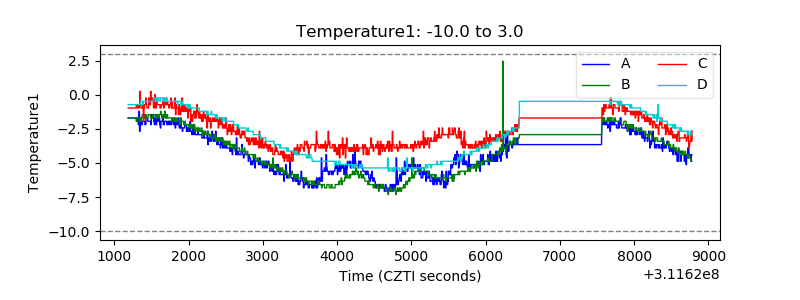 |
| Veto HV Monitor | 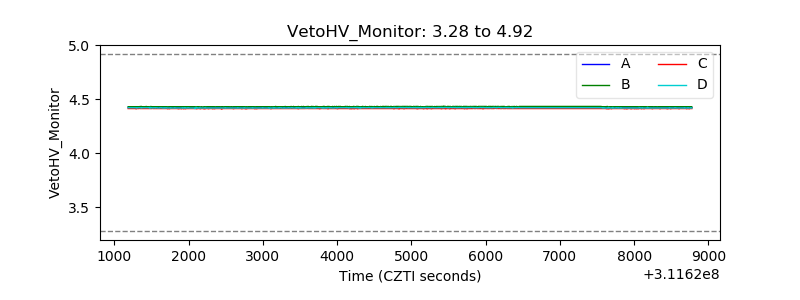 |
| Veto LLD |  |
| Alpha Counter | 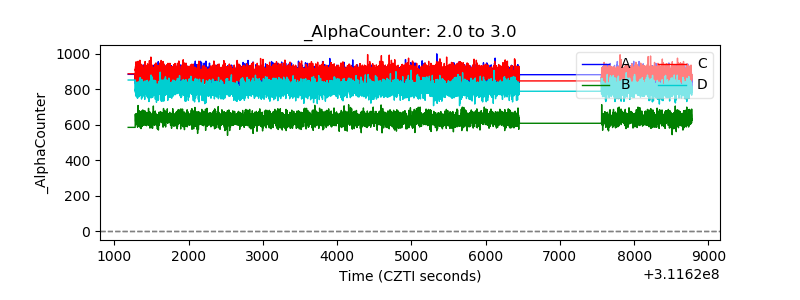 |
| _CPM_Rate | 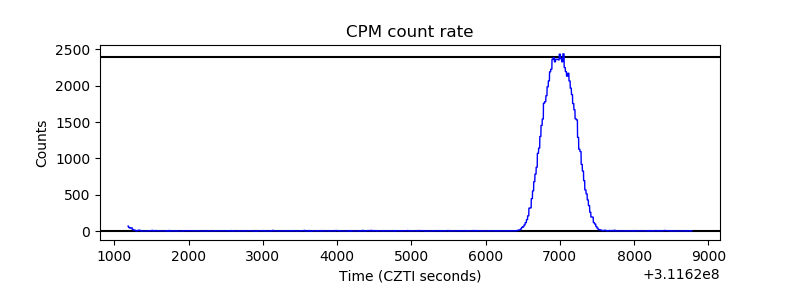 |
| CZT Counter | 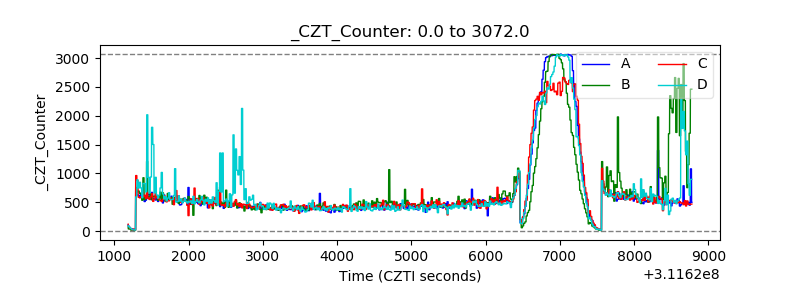 |
| +2.5 Volts monitor |  |
| +5 Volts monitor |  |
| _ROLL_ROT | 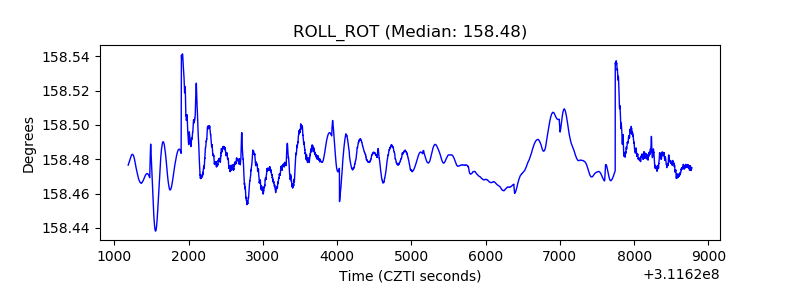 |
| _Roll_DEC | 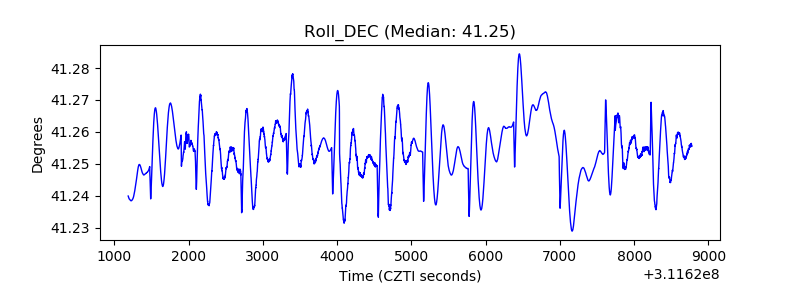 |
| _Roll_RA | 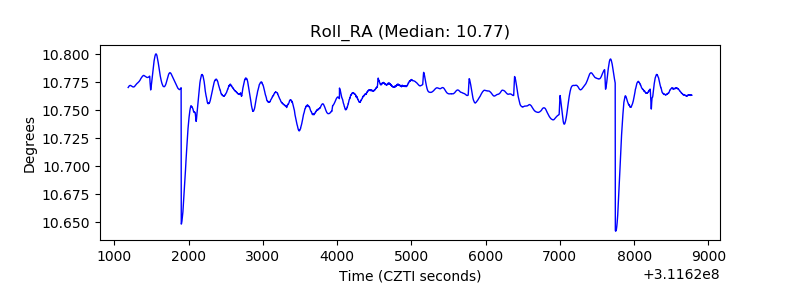 |
| Veto Counter | 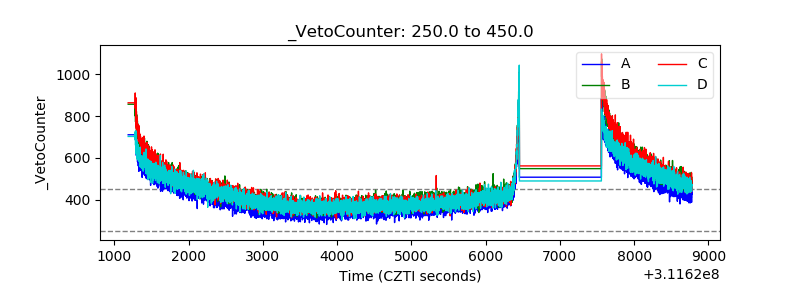 |