| Param | Original file | Final file |
|---|---|---|
| Filename | modeM0/AS1A07_007T04_9000003310_22362cztM0_level2.evt | modeM0/AS1A07_007T04_9000003310_22362cztM0_level2_quad_clean.evt |
| Size (bytes) | 436,049,280 | 98,858,880 |
| Size | 415.8 MB | 94.3 MB |
| Events in quadrant A | 3,067,099 | 651,474 |
| Events in quadrant B | 3,194,019 | 670,590 |
| Events in quadrant C | 3,146,813 | 637,937 |
| Events in quadrant D | 3,382,563 | 607,262 |
| Mode M0 | |||
|---|---|---|---|
| Quadrant | BADHDUFLAG | Total packets | Discarded packets |
| A | 0 | 12989 | 2 |
| B | 0 | 13319 | 2 |
| C | 0 | 13175 | 2 |
| D | 0 | 14212 | 2 |
| Mode SS | |||
|---|---|---|---|
| Quadrant | BADHDUFLAG | Total packets | Discarded packets |
| A | 0 | 124 | 0 |
| B | 0 | 124 | 0 |
| C | 0 | 124 | 0 |
| D | 0 | 124 | 0 |
| Mode M9 | |||
|---|---|---|---|
| Quadrant | BADHDUFLAG | Total packets | Discarded packets |
| A | 0 | 19 | 0 |
| B | 0 | 20 | 0 |
| C | 0 | 20 | 0 |
| D | 0 | 20 | 0 |
| Quadrant | Total seconds | Saturated seconds | Saturation percentage |
|---|---|---|---|
| A | 6113 | 9 | 0.147227% |
| B | 6113 | 21 | 0.343530% |
| C | 6113 | 60 | 0.981515% |
| D | 6113 | 44 | 0.719778% |
Noise dominated data is calculated using 1-second bins in cleaned event files. If a bin has >2000 counts, and if more than 50% of those come from <1% of pixels, then it is considered to be noise-dominated and hence unusable.
| Quadrant | # 1 sec bins | Bins with >0 counts | Bins with >2000 counts | High rate bins dominated by noise | Noise dominated (total time) | Noise dominated (detector-on time) | Marked lightcurve |
|---|---|---|---|---|---|---|---|
| A | 7473 | 6114 | 0 | 0 | 0.00% | 0.00% | 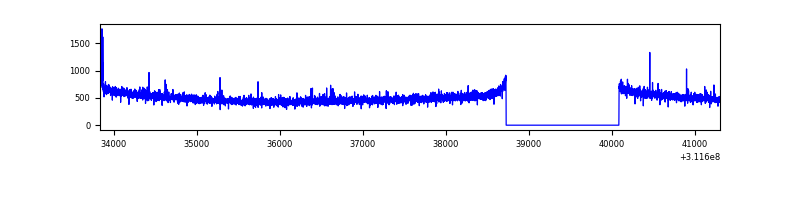 |
| B | 7473 | 6114 | 4 | 4 | 0.05% | 0.07% | 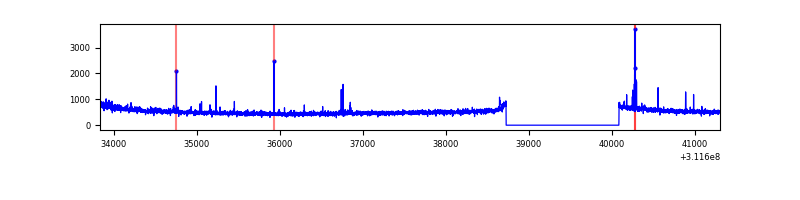 |
| C | 7473 | 6113 | 0 | 0 | 0.00% | 0.00% | 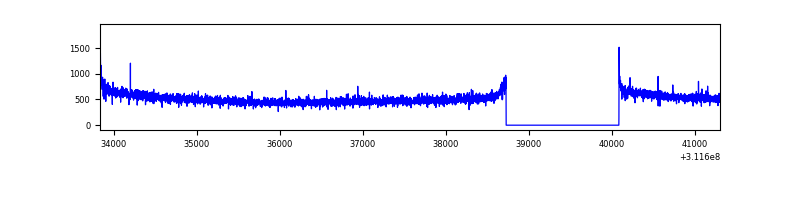 |
| D | 7473 | 6114 | 39 | 39 | 0.52% | 0.64% | 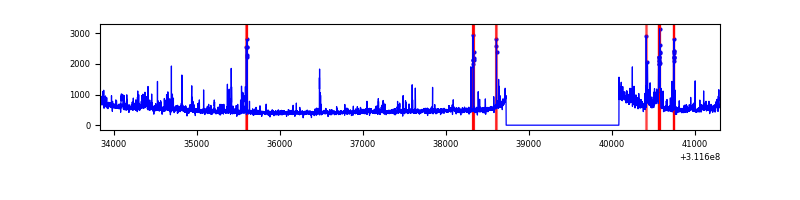 |
Top three noisy pixels from each quadrant. If the there are fewer than three noisy pixels in the level2.evt file, extra rows are filled as -1
| Pixel properties | Quadrant properties | ||||||
|---|---|---|---|---|---|---|---|
| Quadrant | DetID | PixID | Counts | Sigma | Mean | Median | Sigma |
| A | 3 | 1 | 27299 | 170.09 | 788 | 775 | 155.9 |
| A | 13 | 254 | 8999 | 52.74 | 788 | 775 | 155.9 |
| A | 0 | 226 | 6868 | 39.07 | 788 | 775 | 155.9 |
| B | 3 | 64 | 47594 | 321.77 | 794 | 776 | 145.5 |
| B | 0 | 229 | 18848 | 124.21 | 794 | 776 | 145.5 |
| B | 12 | 111 | 16794 | 110.09 | 794 | 776 | 145.5 |
| C | 14 | 238 | 123824 | 688.44 | 771 | 778 | 178.7 |
| C | 0 | 10 | 12102 | 63.36 | 771 | 778 | 178.7 |
| C | 13 | 61 | 5287 | 25.23 | 771 | 778 | 178.7 |
| D | 12 | 227 | 196382 | 1054.59 | 767 | 745 | 185.5 |
| D | 1 | 52 | 152392 | 817.46 | 767 | 745 | 185.5 |
| D | 2 | 120 | 34436 | 181.61 | 767 | 745 | 185.5 |
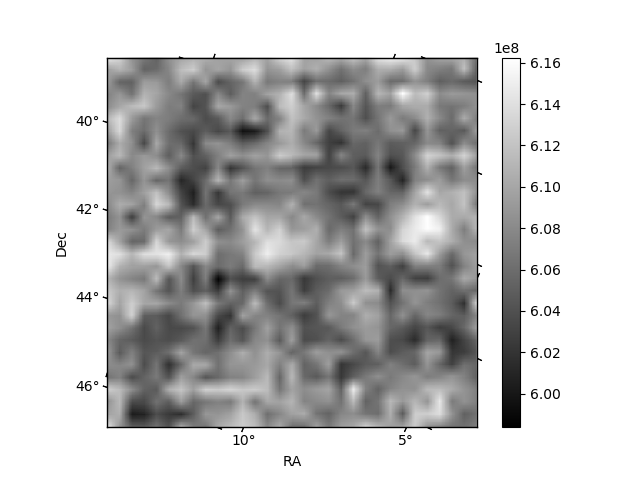
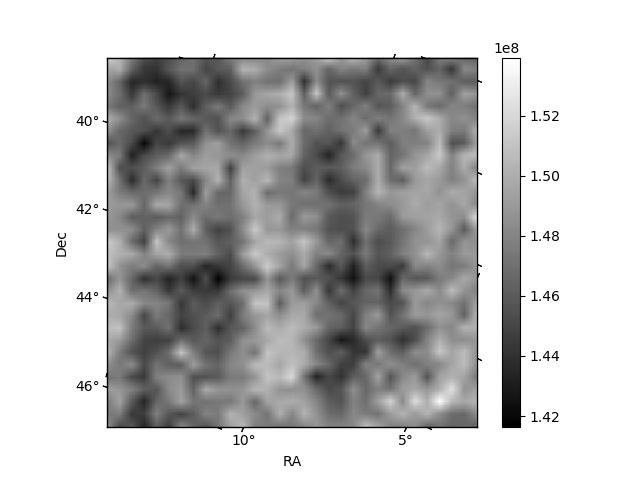
Histogram calculated using DETX and DETY for each event in the final _common_clean file
| Quadrant A | 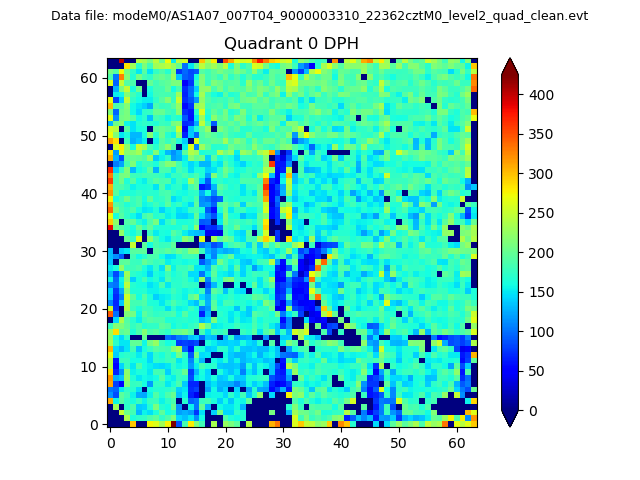 |
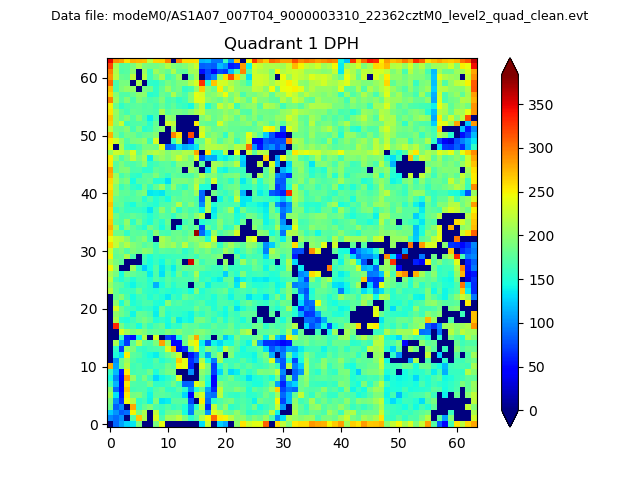 |
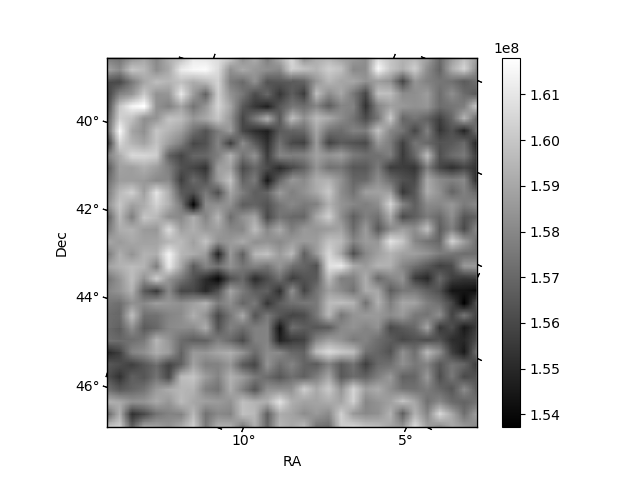
Quadrant B |
|---|---|---|---|
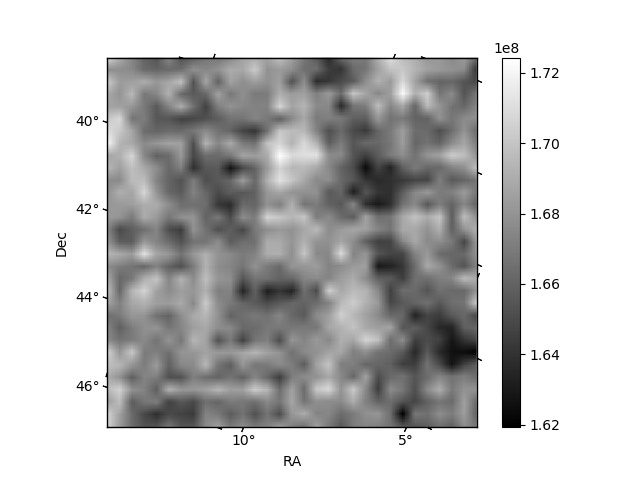
| Quadrant D | 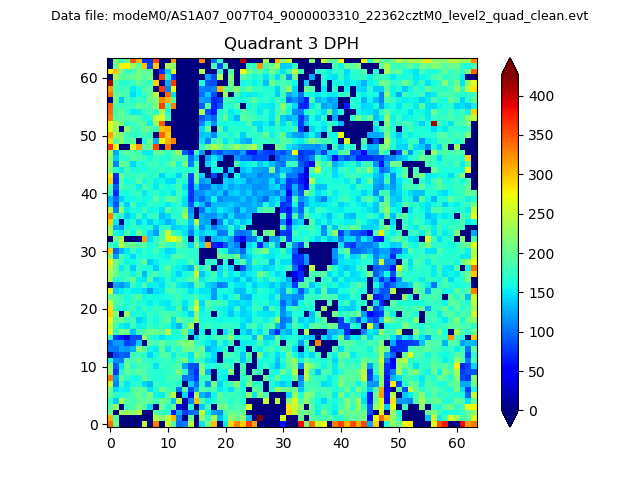 |
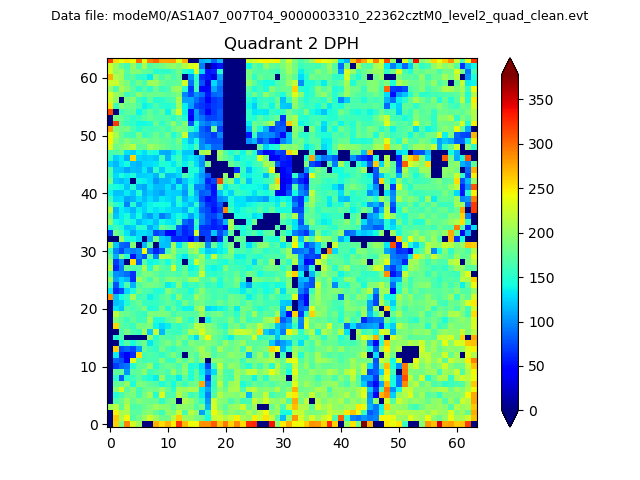 |
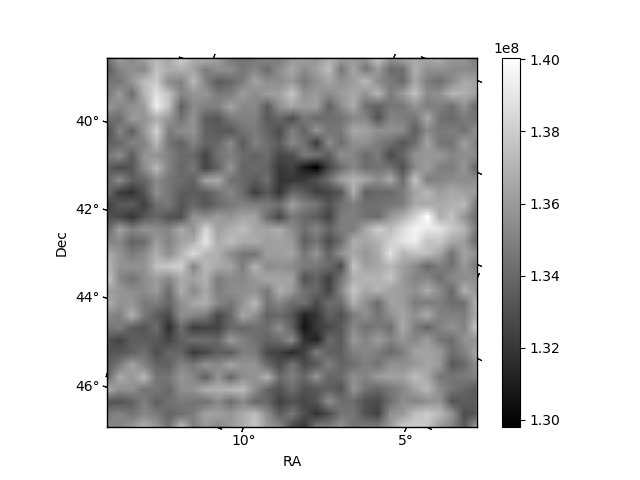
Quadrant C |
| Plot type | Count rate plots | Images |
|---|---|---|
| Comparison with Poisson distribution Blue bars denote a histogram of data divided into 1 sec bins. Red curve is a Poisson curve with rate = median count rate of data. |
 |
 |
| Quadrant-wise count rates Data is divided into 100 sec bins |
 |
|
| Module-wise count rates for Quadrant A Data is divided into 100 sec bins |
 |
 |
| Module-wise count rates for Quadrant B Data is divided into 100 sec bins |
 |
 |
| Module-wise count rates for Quadrant C Data is divided into 100 sec bins |
 |
 |
| Module-wise count rates for Quadrant D Data is divided into 100 sec bins |
 |
 |
| Parameter | Plot |
|---|---|
| CZT HV Monitor |  |
| D_VDD | 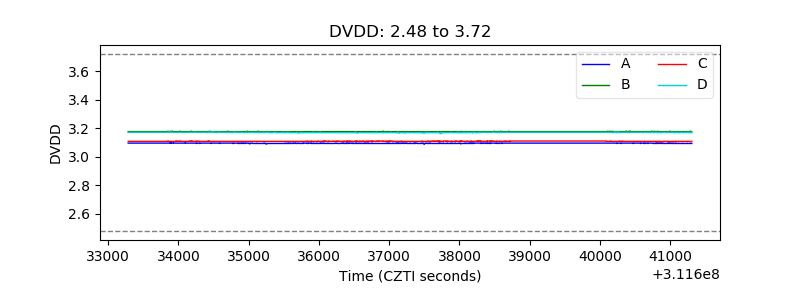 |
| Temperature 1 | 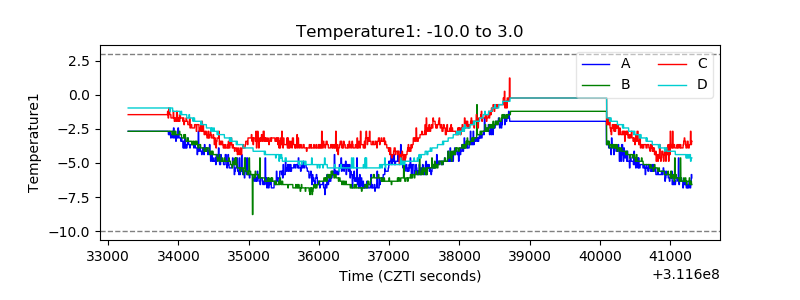 |
| Veto HV Monitor | 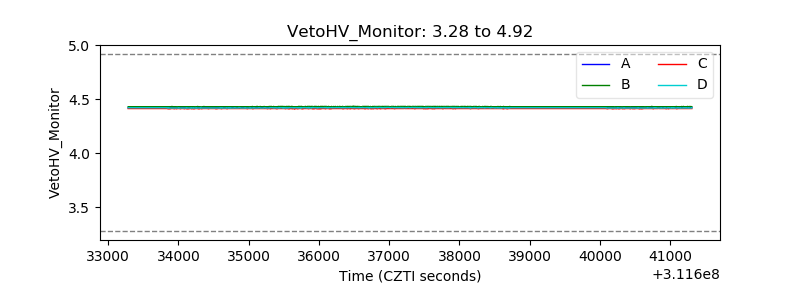 |
| Veto LLD | 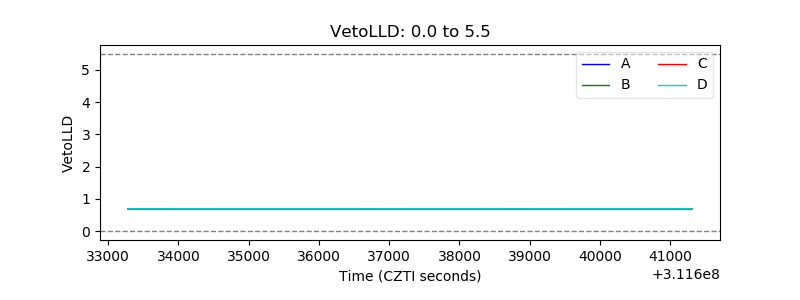 |
| Alpha Counter | 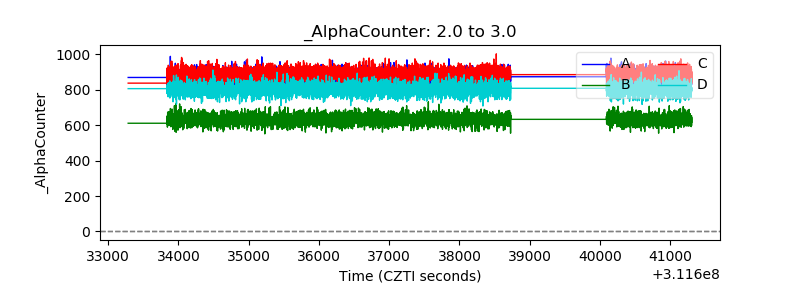 |
| _CPM_Rate | 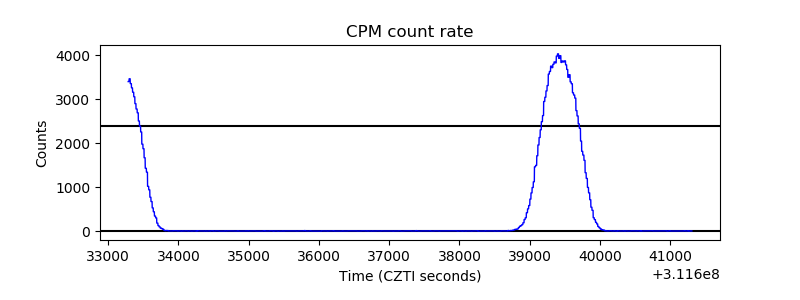 |
| CZT Counter | 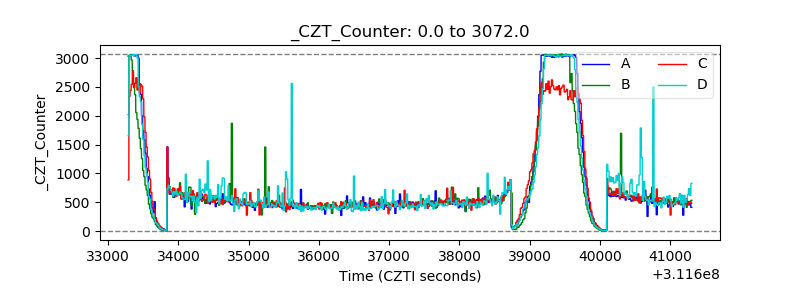 |
| +2.5 Volts monitor |  |
| +5 Volts monitor |  |
| _ROLL_ROT |  |
| _Roll_DEC |  |
| _Roll_RA | 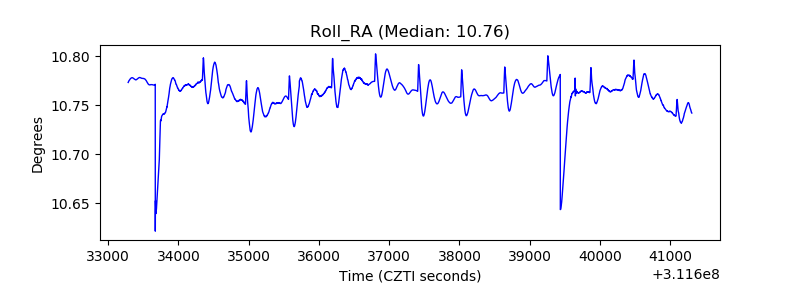 |
| Veto Counter |  |