| Param | Original file | Final file |
|---|---|---|
| Filename | modeM0/AS1A07_007T04_9000003310_22363cztM0_level2.evt | modeM0/AS1A07_007T04_9000003310_22363cztM0_level2_quad_clean.evt |
| Size (bytes) | 458,625,600 | 101,116,800 |
| Size | 437.4 MB | 96.4 MB |
| Events in quadrant A | 3,117,804 | 668,860 |
| Events in quadrant B | 3,385,103 | 691,892 |
| Events in quadrant C | 3,229,146 | 654,145 |
| Events in quadrant D | 3,736,886 | 615,077 |
| Mode M0 | |||
|---|---|---|---|
| Quadrant | BADHDUFLAG | Total packets | Discarded packets |
| A | 0 | 13072 | 2 |
| B | 0 | 13796 | 2 |
| C | 0 | 13345 | 2 |
| D | 0 | 15380 | 3 |
| Mode SS | |||
|---|---|---|---|
| Quadrant | BADHDUFLAG | Total packets | Discarded packets |
| A | 0 | 124 | 0 |
| B | 0 | 124 | 0 |
| C | 0 | 124 | 0 |
| D | 0 | 124 | 0 |
| Mode M9 | |||
|---|---|---|---|
| Quadrant | BADHDUFLAG | Total packets | Discarded packets |
| A | 0 | 19 | 0 |
| B | 0 | 20 | 0 |
| C | 0 | 20 | 0 |
| D | 0 | 20 | 0 |
| Quadrant | Total seconds | Saturated seconds | Saturation percentage |
|---|---|---|---|
| A | 6202 | 22 | 0.354724% |
| B | 6202 | 69 | 1.112544% |
| C | 6202 | 79 | 1.273783% |
| D | 6201 | 116 | 1.870666% |
Noise dominated data is calculated using 1-second bins in cleaned event files. If a bin has >2000 counts, and if more than 50% of those come from <1% of pixels, then it is considered to be noise-dominated and hence unusable.
| Quadrant | # 1 sec bins | Bins with >0 counts | Bins with >2000 counts | High rate bins dominated by noise | Noise dominated (total time) | Noise dominated (detector-on time) | Marked lightcurve |
|---|---|---|---|---|---|---|---|
| A | 7582 | 6203 | 0 | 0 | 0.00% | 0.00% | 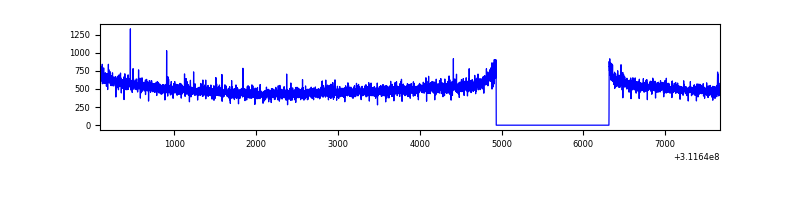 |
| B | 7582 | 6203 | 18 | 18 | 0.24% | 0.29% | 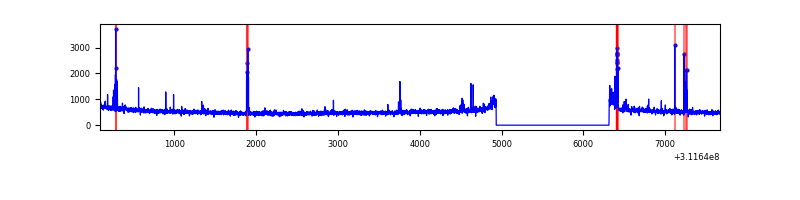 |
| C | 7582 | 6203 | 1 | 1 | 0.01% | 0.02% | 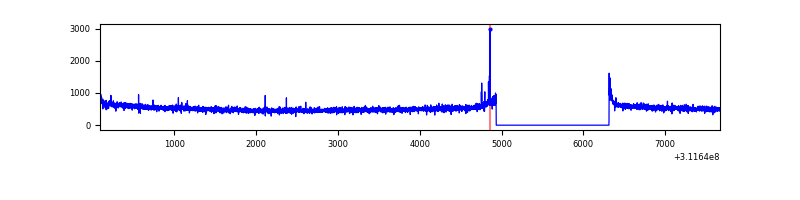 |
| D | 7581 | 6202 | 94 | 94 | 1.24% | 1.52% | 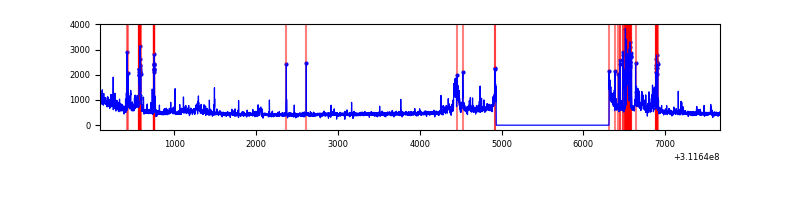 |
Top three noisy pixels from each quadrant. If the there are fewer than three noisy pixels in the level2.evt file, extra rows are filled as -1
| Pixel properties | Quadrant properties | ||||||
|---|---|---|---|---|---|---|---|
| Quadrant | DetID | PixID | Counts | Sigma | Mean | Median | Sigma |
| A | 13 | 254 | 9412 | 54.08 | 806 | 793 | 159.4 |
| A | 0 | 226 | 6967 | 38.74 | 806 | 793 | 159.4 |
| A | 3 | 137 | 6507 | 35.85 | 806 | 793 | 159.4 |
| B | 3 | 64 | 132288 | 880.88 | 816 | 798 | 149.3 |
| B | 0 | 197 | 20461 | 131.73 | 816 | 798 | 149.3 |
| B | 0 | 229 | 19115 | 122.71 | 816 | 798 | 149.3 |
| C | 14 | 238 | 126850 | 684.96 | 790 | 796 | 184.0 |
| C | 0 | 10 | 15138 | 77.93 | 790 | 796 | 184.0 |
| C | 0 | 207 | 10221 | 51.21 | 790 | 796 | 184.0 |
| D | 12 | 227 | 441863 | 2382.09 | 775 | 754 | 185.2 |
| D | 1 | 52 | 190287 | 1023.52 | 775 | 754 | 185.2 |
| D | 13 | 172 | 101844 | 545.91 | 775 | 754 | 185.2 |
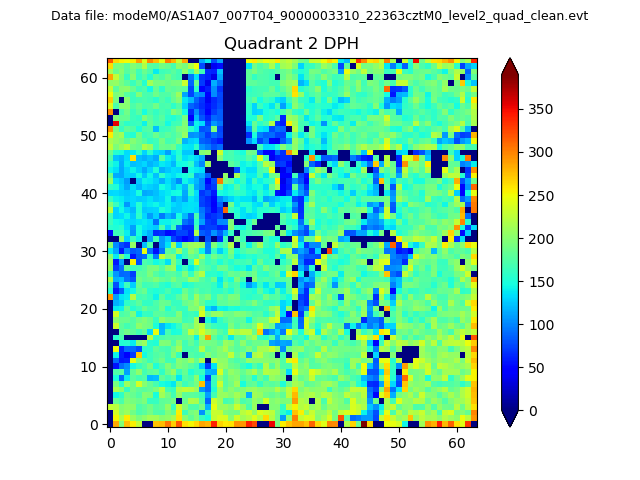
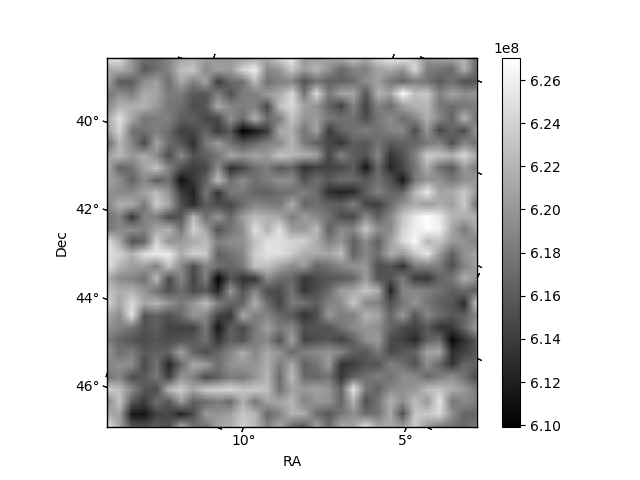
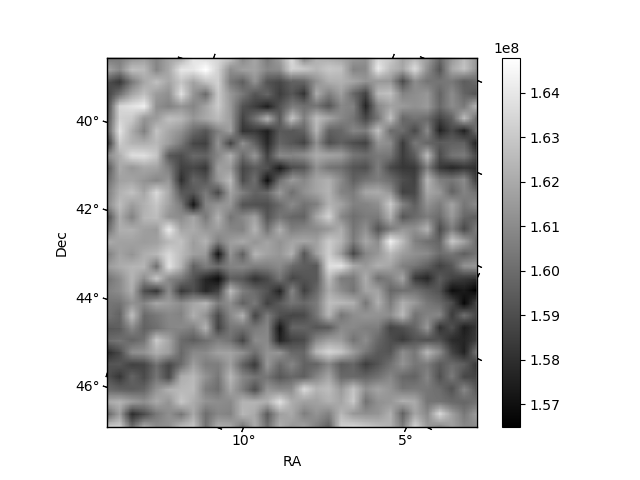
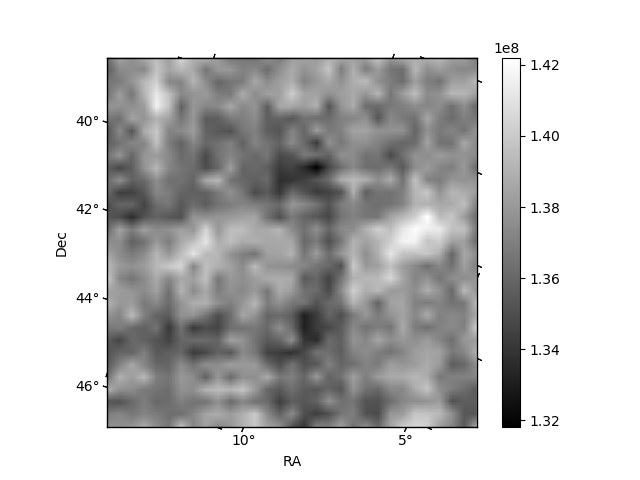
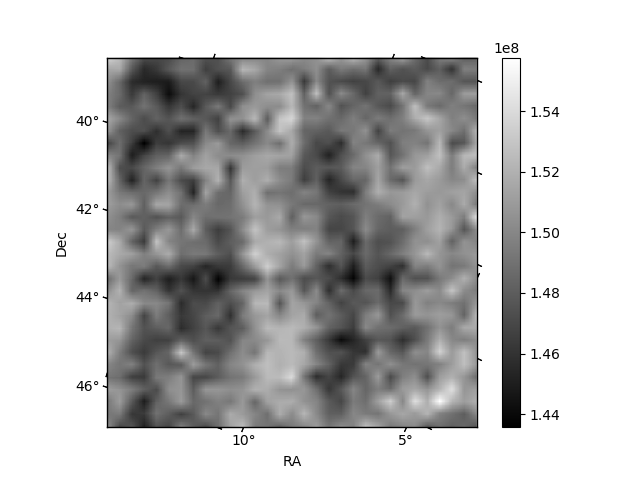
Histogram calculated using DETX and DETY for each event in the final _common_clean file
| Quadrant A | 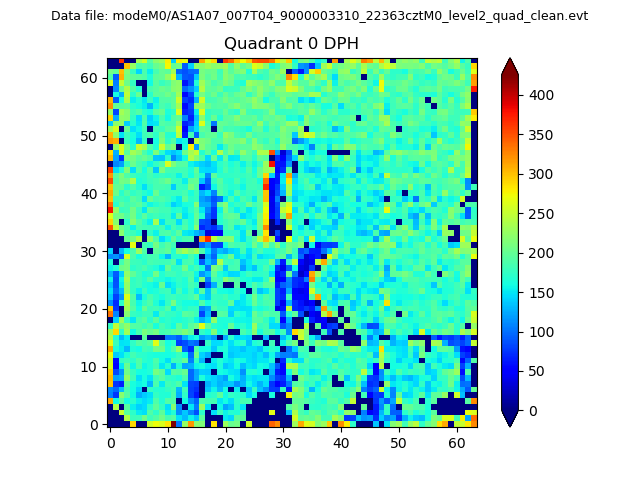 |
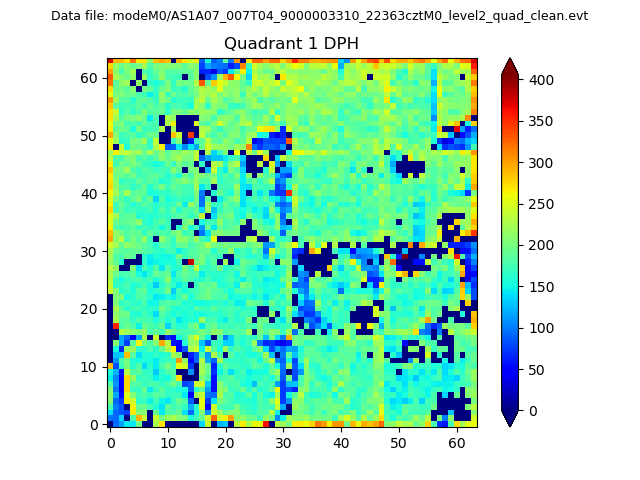 |
Quadrant B |
|---|---|---|---|
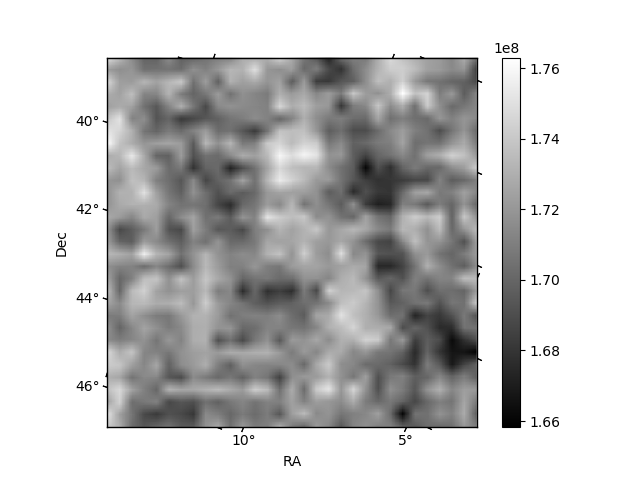
| Quadrant D | 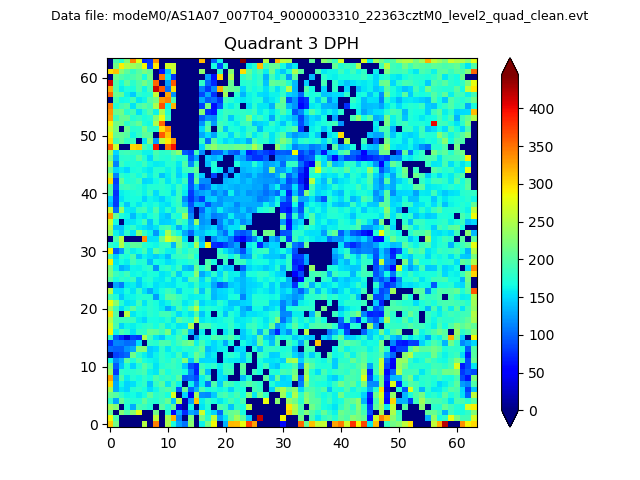 |
 |
Quadrant C |
| Plot type | Count rate plots | Images |
|---|---|---|
| Comparison with Poisson distribution Blue bars denote a histogram of data divided into 1 sec bins. Red curve is a Poisson curve with rate = median count rate of data. |
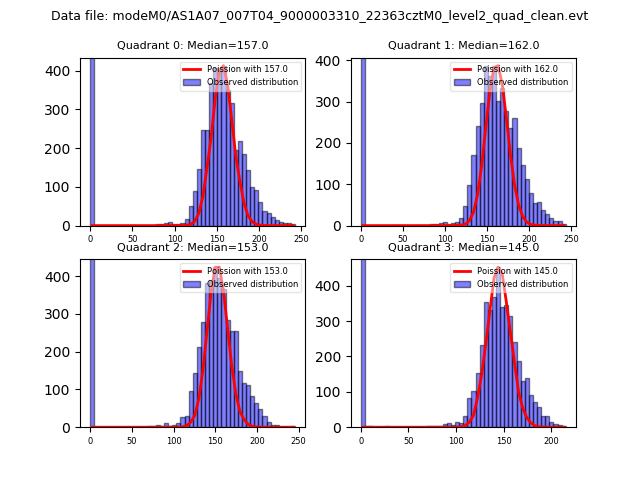 |
 |
| Quadrant-wise count rates Data is divided into 100 sec bins |
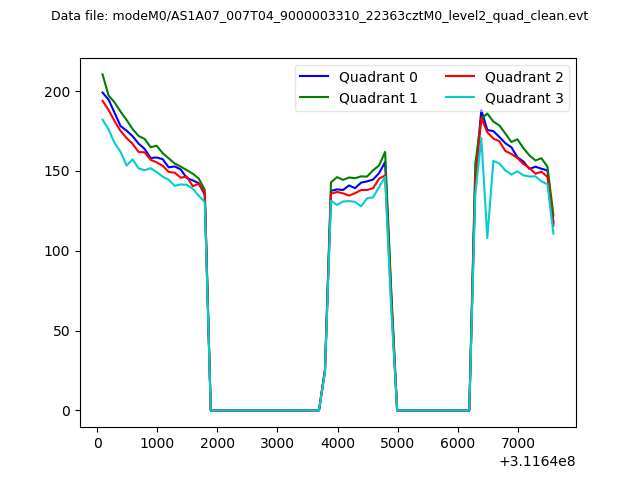 |
|
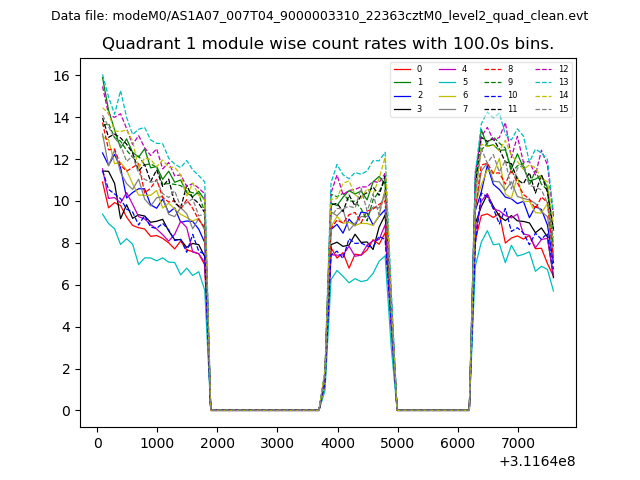
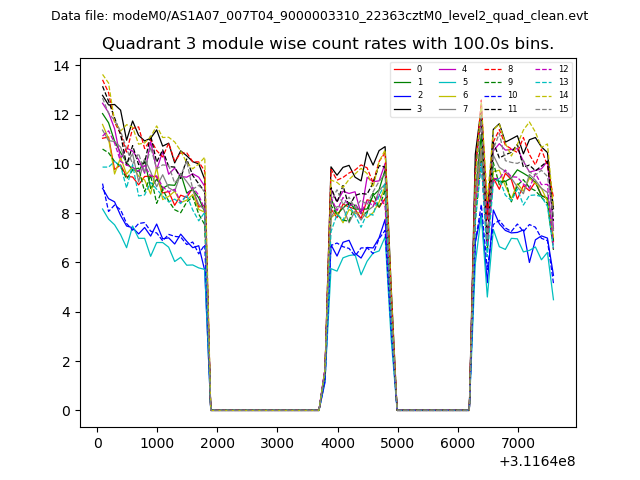
| Module-wise count rates for Quadrant A Data is divided into 100 sec bins |
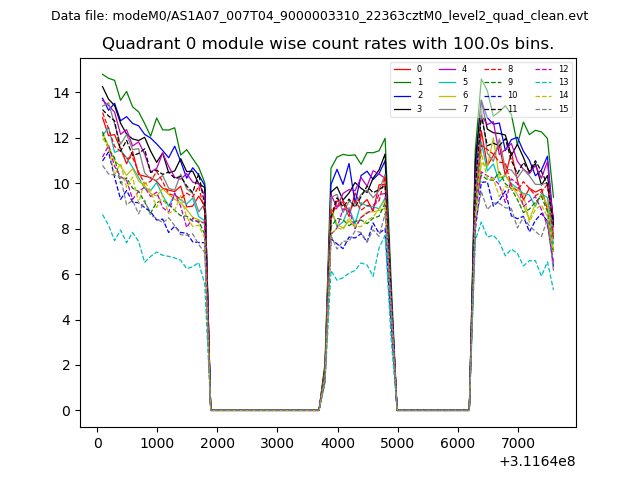 |
 |
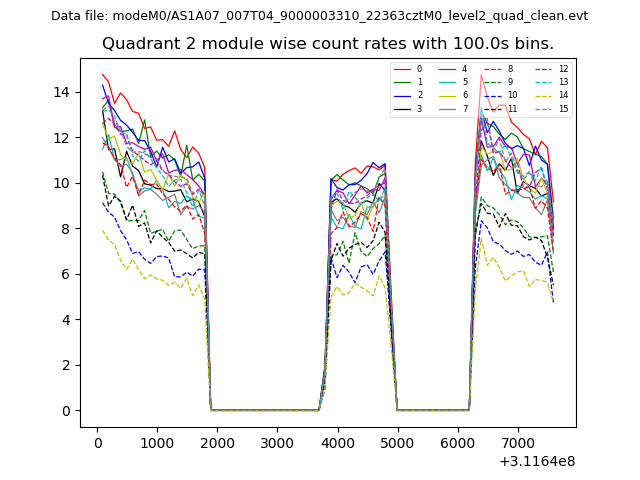
| Module-wise count rates for Quadrant B Data is divided into 100 sec bins |
 |
 |
| Module-wise count rates for Quadrant C Data is divided into 100 sec bins |
 |
 |
| Module-wise count rates for Quadrant D Data is divided into 100 sec bins |
 |
 |
| Parameter | Plot |
|---|---|
| CZT HV Monitor |  |
| D_VDD | 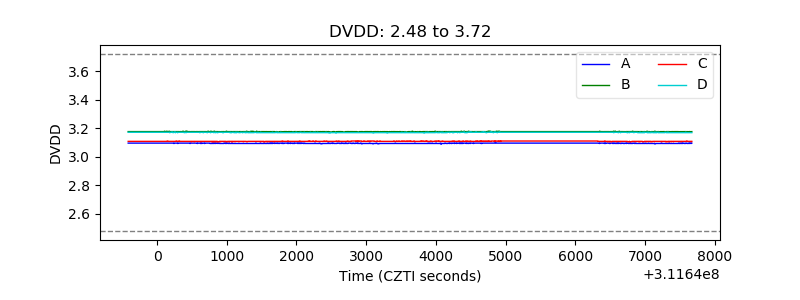 |
| Temperature 1 | 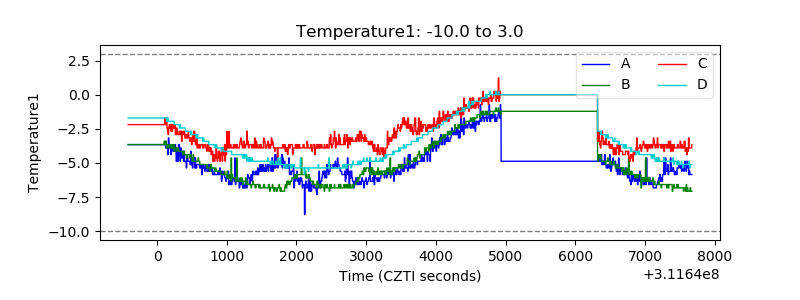 |
| Veto HV Monitor | 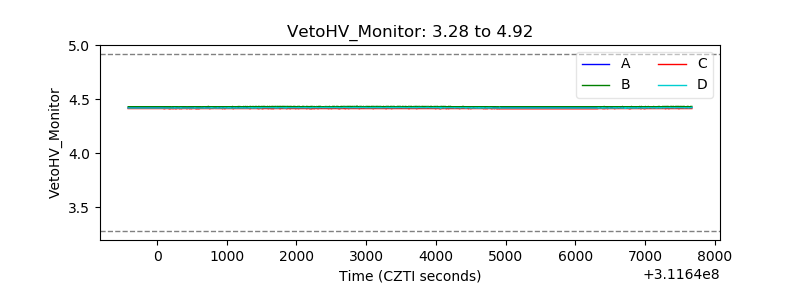 |
| Veto LLD | 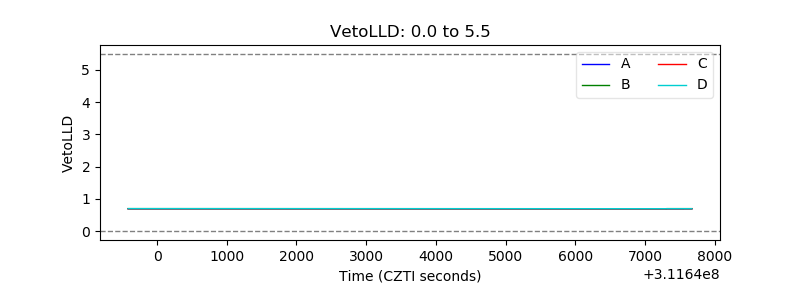 |
| Alpha Counter | 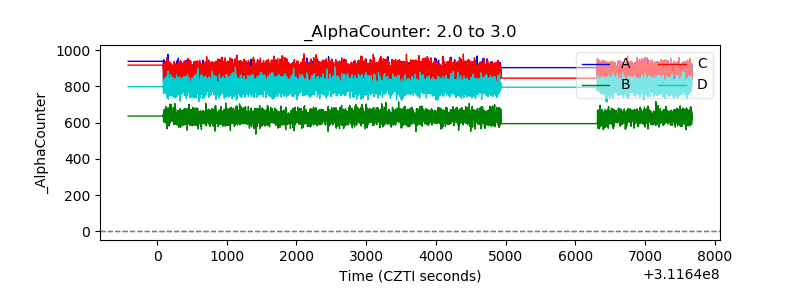 |
| _CPM_Rate | 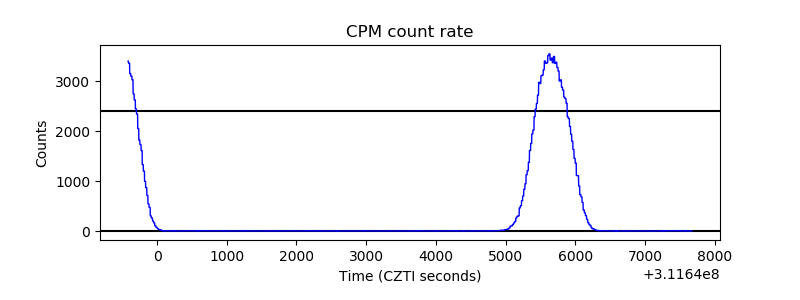 |
| CZT Counter | 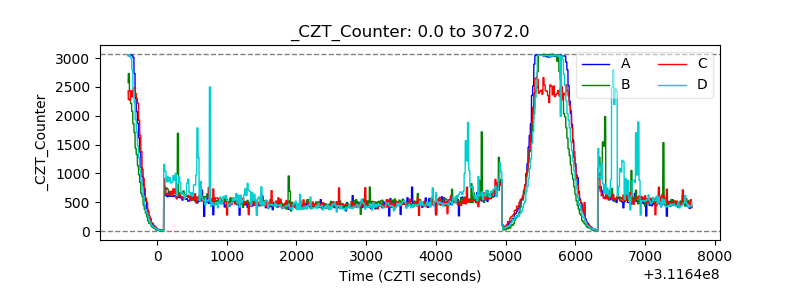 |
| +2.5 Volts monitor |  |
| +5 Volts monitor | 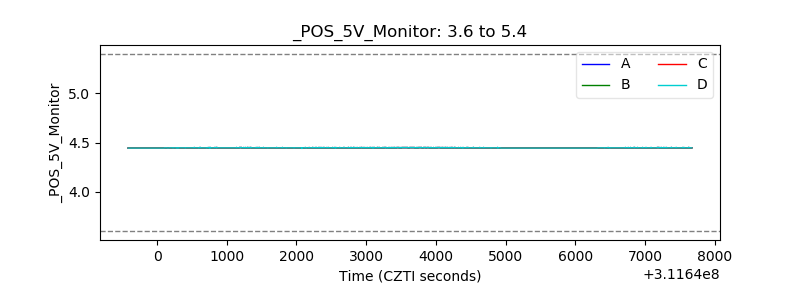 |
| _ROLL_ROT | 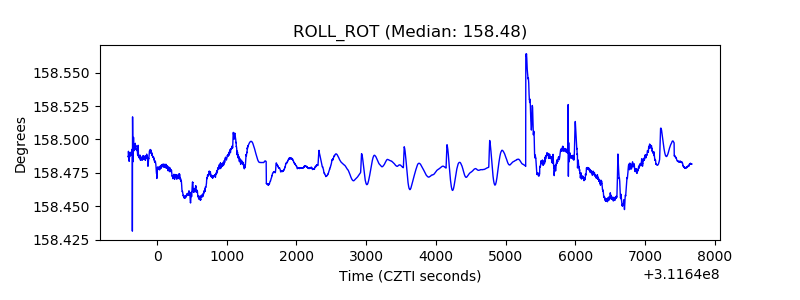 |
| _Roll_DEC |  |
| _Roll_RA | 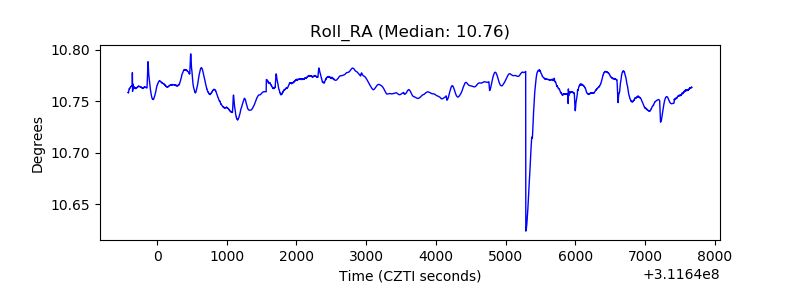 |
| Veto Counter | 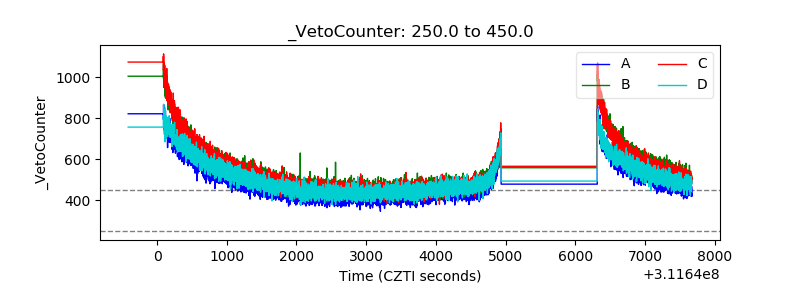 |