| Param | Original file | Final file |
|---|---|---|
| Filename | modeM0/AS1A07_007T04_9000003310_22364cztM0_level2.evt | modeM0/AS1A07_007T04_9000003310_22364cztM0_level2_quad_clean.evt |
| Size (bytes) | 444,136,320 | 92,897,280 |
| Size | 423.6 MB | 88.6 MB |
| Events in quadrant A | 3,092,822 | 605,097 |
| Events in quadrant B | 3,316,385 | 626,273 |
| Events in quadrant C | 3,173,702 | 590,124 |
| Events in quadrant D | 3,444,924 | 557,563 |
| Mode M0 | |||
|---|---|---|---|
| Quadrant | BADHDUFLAG | Total packets | Discarded packets |
| A | 0 | 12988 | 2 |
| B | 0 | 13554 | 2 |
| C | 0 | 13180 | 2 |
| D | 0 | 14479 | 2 |
| Mode SS | |||
|---|---|---|---|
| Quadrant | BADHDUFLAG | Total packets | Discarded packets |
| A | 0 | 126 | 0 |
| B | 0 | 126 | 0 |
| C | 0 | 126 | 0 |
| D | 0 | 126 | 0 |
| Mode M9 | |||
|---|---|---|---|
| Quadrant | BADHDUFLAG | Total packets | Discarded packets |
| A | 0 | 16 | 0 |
| B | 0 | 17 | 0 |
| C | 0 | 17 | 0 |
| D | 0 | 17 | 0 |
| Quadrant | Total seconds | Saturated seconds | Saturation percentage |
|---|---|---|---|
| A | 6223 | 38 | 0.610638% |
| B | 6223 | 86 | 1.381970% |
| C | 6223 | 89 | 1.430178% |
| D | 6223 | 134 | 2.153302% |
Noise dominated data is calculated using 1-second bins in cleaned event files. If a bin has >2000 counts, and if more than 50% of those come from <1% of pixels, then it is considered to be noise-dominated and hence unusable.
| Quadrant | # 1 sec bins | Bins with >0 counts | Bins with >2000 counts | High rate bins dominated by noise | Noise dominated (total time) | Noise dominated (detector-on time) | Marked lightcurve |
|---|---|---|---|---|---|---|---|
| A | 7563 | 6223 | 0 | 0 | 0.00% | 0.00% | 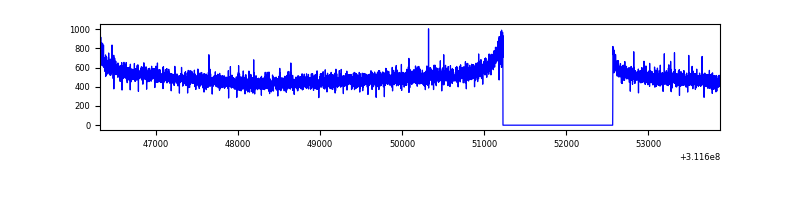 |
| B | 7563 | 6224 | 15 | 15 | 0.20% | 0.24% | 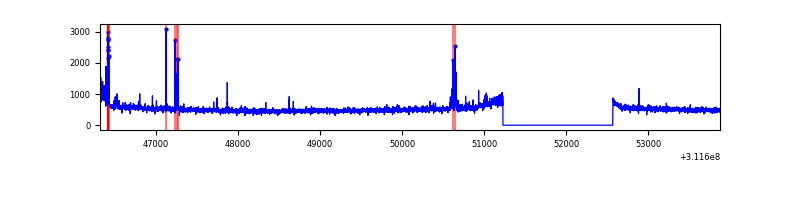 |
| C | 7563 | 6224 | 0 | 0 | 0.00% | 0.00% | 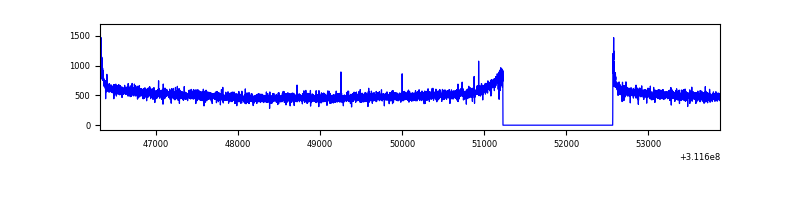 |
| D | 7563 | 6224 | 81 | 81 | 1.07% | 1.30% | 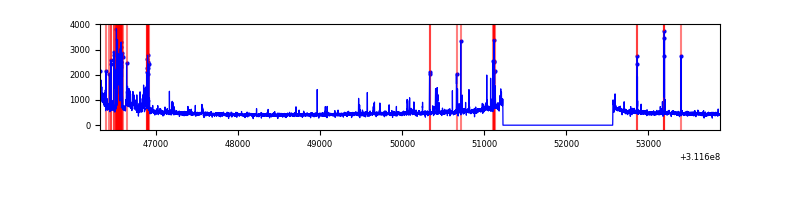 |
Top three noisy pixels from each quadrant. If the there are fewer than three noisy pixels in the level2.evt file, extra rows are filled as -1
| Pixel properties | Quadrant properties | ||||||
|---|---|---|---|---|---|---|---|
| Quadrant | DetID | PixID | Counts | Sigma | Mean | Median | Sigma |
| A | 13 | 254 | 8991 | 51.64 | 801 | 785 | 158.9 |
| A | 0 | 226 | 6918 | 38.6 | 801 | 785 | 158.9 |
| A | 3 | 137 | 6560 | 36.34 | 801 | 785 | 158.9 |
| B | 3 | 64 | 92643 | 615.77 | 808 | 789 | 149.2 |
| B | 0 | 229 | 23043 | 149.18 | 808 | 789 | 149.2 |
| B | 0 | 197 | 19875 | 127.95 | 808 | 789 | 149.2 |
| C | 14 | 238 | 124202 | 685.19 | 777 | 782 | 180.1 |
| C | 0 | 10 | 16477 | 87.13 | 777 | 782 | 180.1 |
| C | 13 | 61 | 5428 | 25.79 | 777 | 782 | 180.1 |
| D | 1 | 52 | 226965 | 1229.64 | 764 | 741 | 184.0 |
| D | 12 | 227 | 168366 | 911.12 | 764 | 741 | 184.0 |
| D | 13 | 172 | 131816 | 712.46 | 764 | 741 | 184.0 |
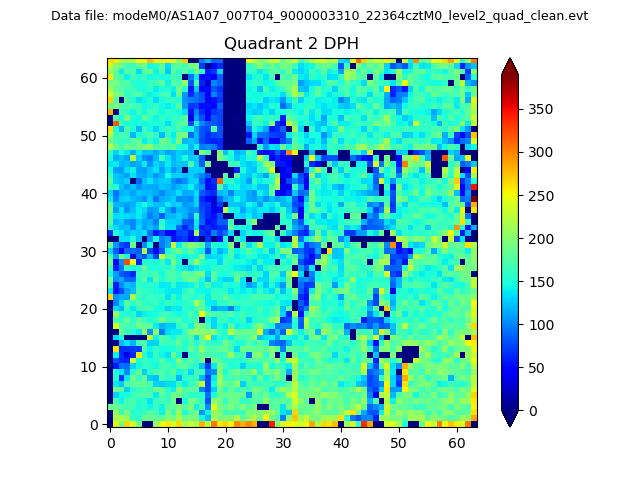
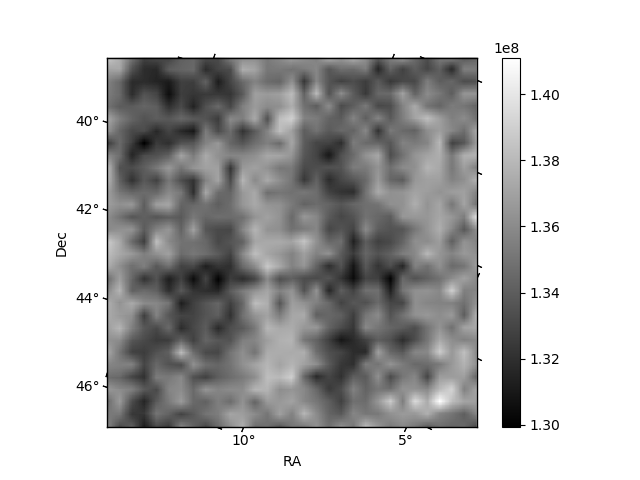
Histogram calculated using DETX and DETY for each event in the final _common_clean file
| Quadrant A | 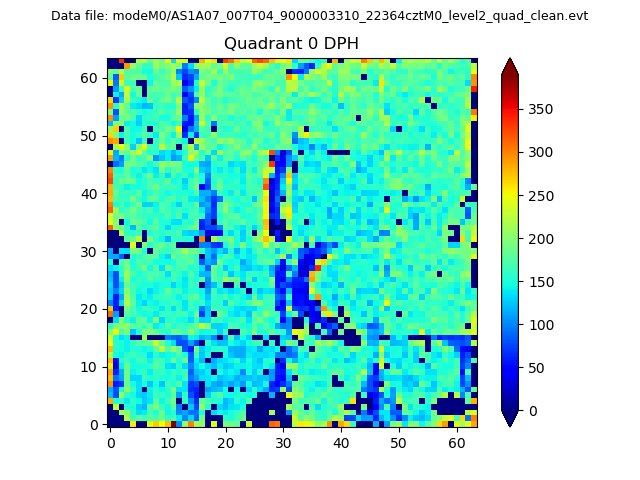 |
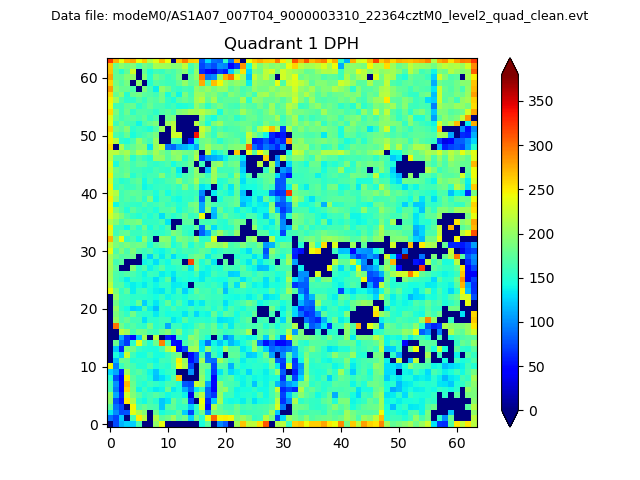 |
Quadrant B |
|---|---|---|---|
| Quadrant D | 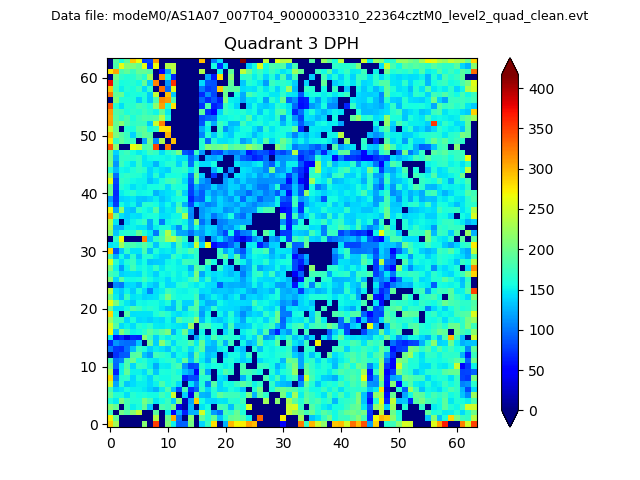 |
 |
Quadrant C |
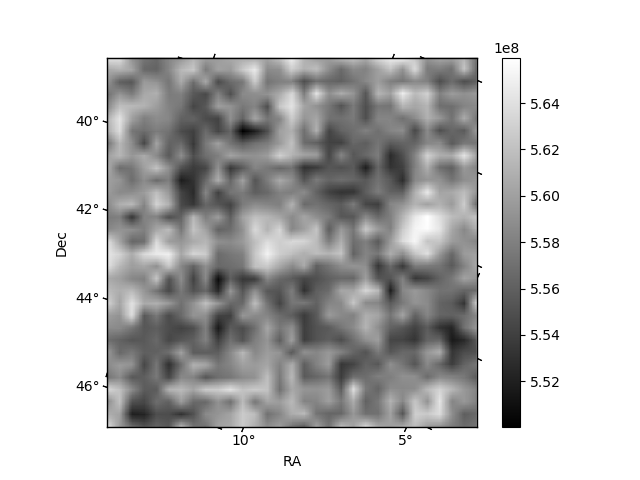
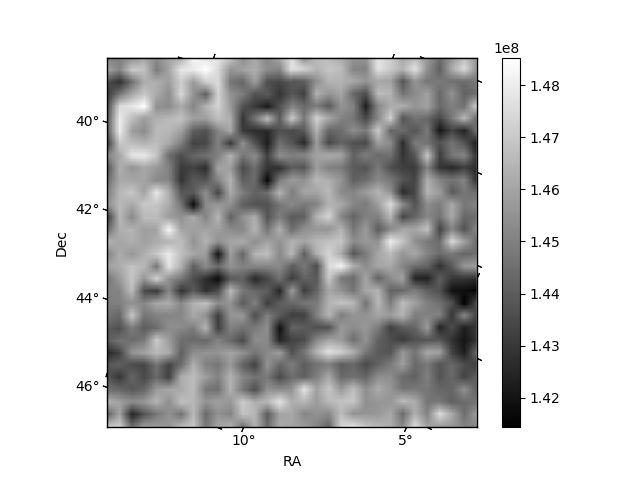
| Plot type | Count rate plots | Images |
|---|---|---|
| Comparison with Poisson distribution Blue bars denote a histogram of data divided into 1 sec bins. Red curve is a Poisson curve with rate = median count rate of data. |
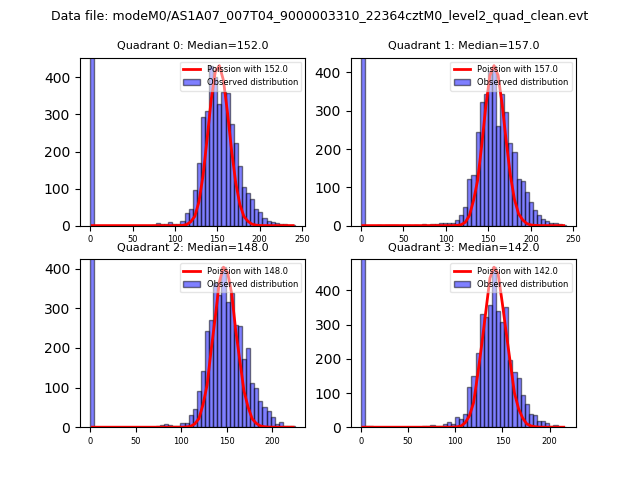 |
 |
| Quadrant-wise count rates Data is divided into 100 sec bins |
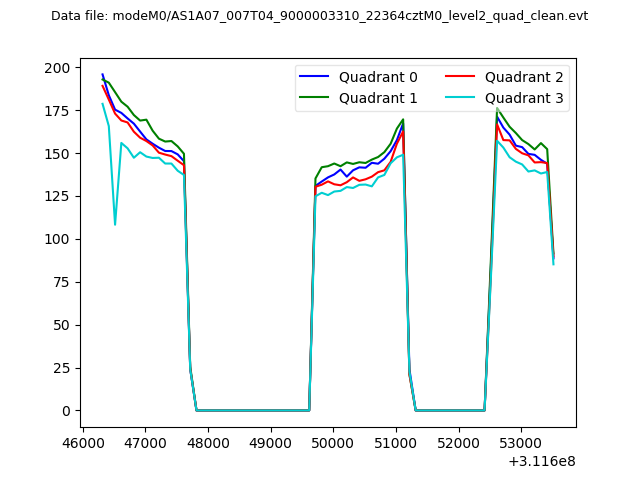 |
|
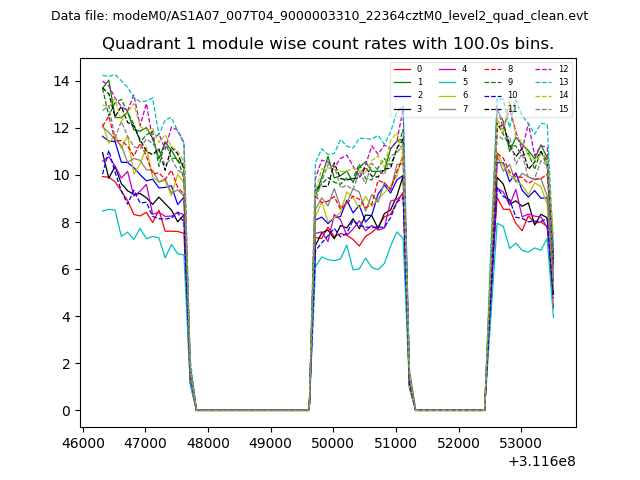
| Module-wise count rates for Quadrant A Data is divided into 100 sec bins |
 |
 |
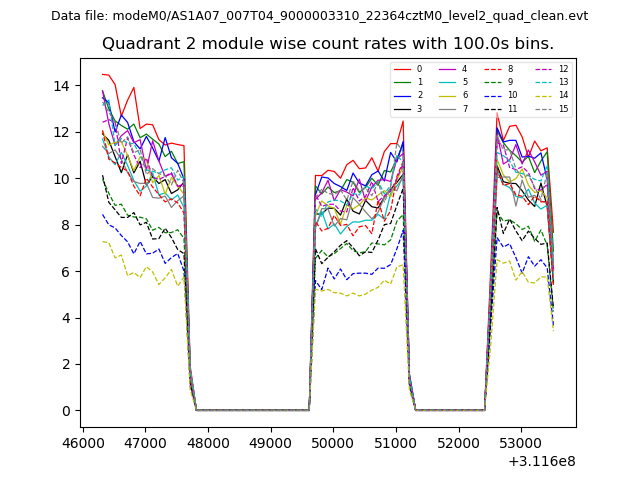
| Module-wise count rates for Quadrant B Data is divided into 100 sec bins |
 |
 |
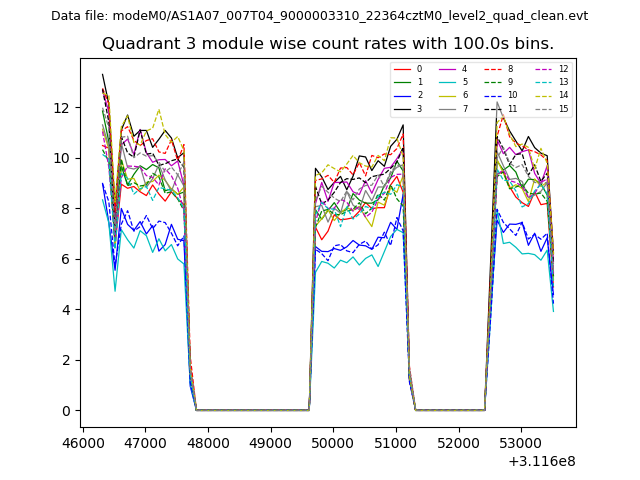
| Module-wise count rates for Quadrant C Data is divided into 100 sec bins |
 |
 |
| Module-wise count rates for Quadrant D Data is divided into 100 sec bins |
 |
 |
| Parameter | Plot |
|---|---|
| CZT HV Monitor | 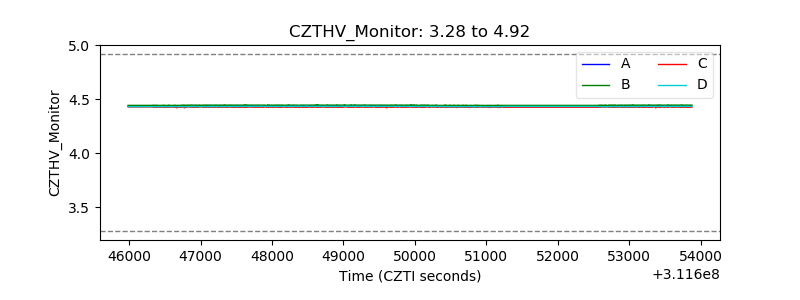 |
| D_VDD | 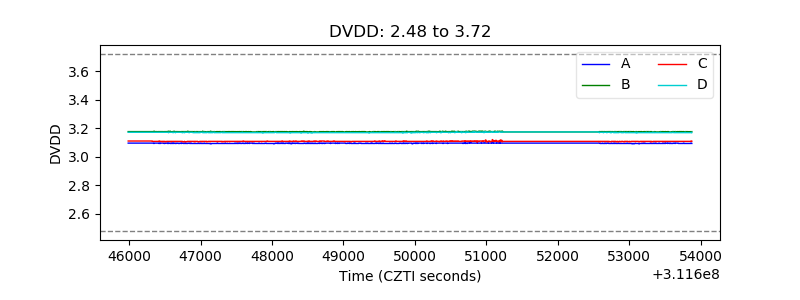 |
| Temperature 1 | 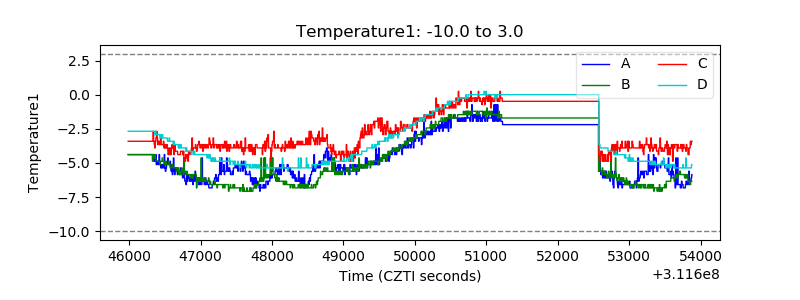 |
| Veto HV Monitor | 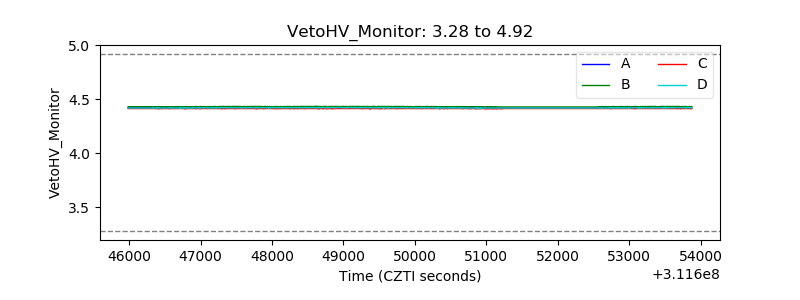 |
| Veto LLD | 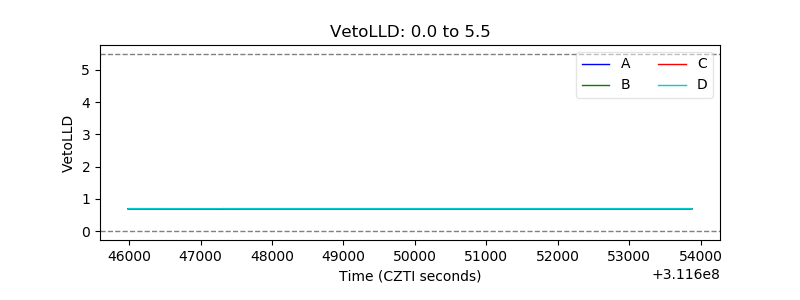 |
| Alpha Counter | 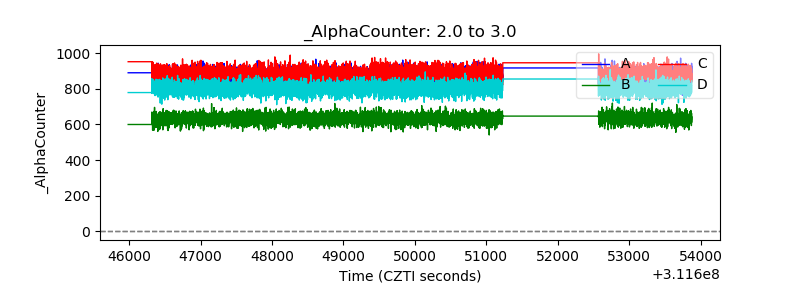 |
| _CPM_Rate | 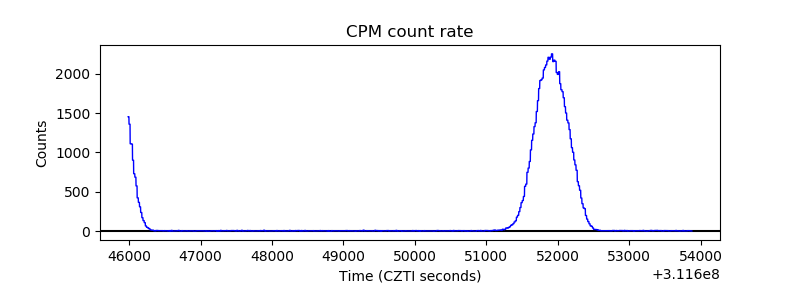 |
| CZT Counter | 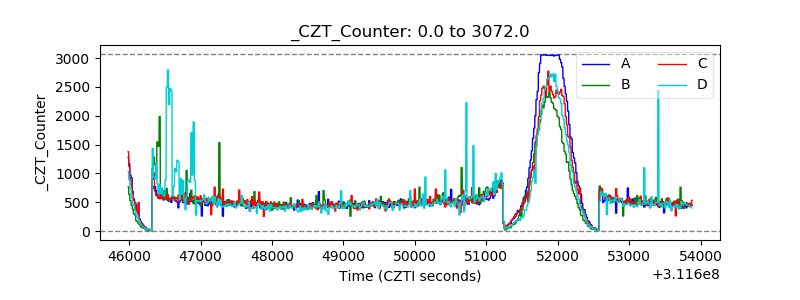 |
| +2.5 Volts monitor |  |
| +5 Volts monitor |  |
| _ROLL_ROT | 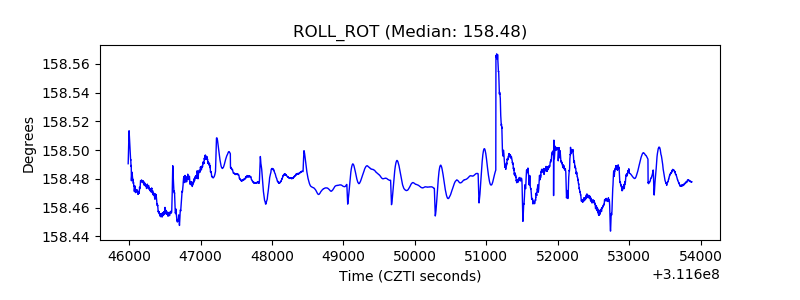 |
| _Roll_DEC | 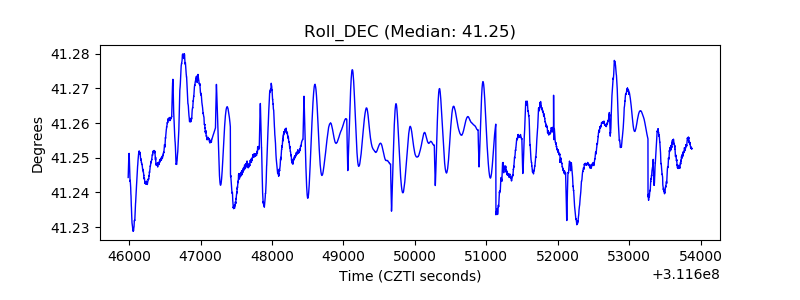 |
| _Roll_RA | 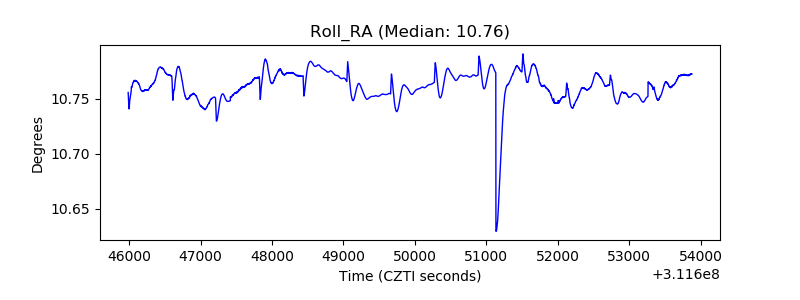 |
| Veto Counter | 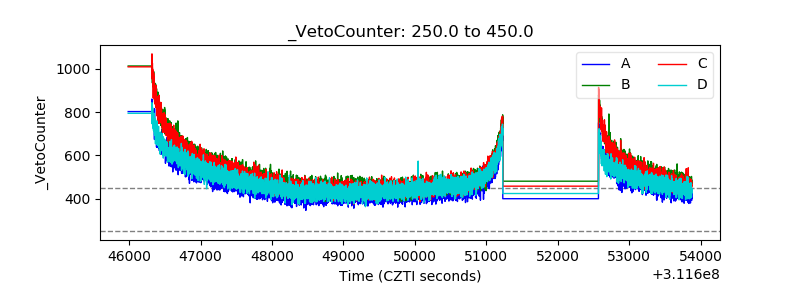 |