| Param | Original file | Final file |
|---|---|---|
| Filename | modeM0/AS1A07_007T04_9000003310_22368cztM0_level2.evt | modeM0/AS1A07_007T04_9000003310_22368cztM0_level2_quad_clean.evt |
| Size (bytes) | 621,112,320 | 105,001,920 |
| Size | 592.3 MB | 100.1 MB |
| Events in quadrant A | 4,237,939 | 651,477 |
| Events in quadrant B | 4,386,526 | 657,937 |
| Events in quadrant C | 4,318,553 | 632,606 |
| Events in quadrant D | 5,261,157 | 618,108 |
| Mode M0 | |||
|---|---|---|---|
| Quadrant | BADHDUFLAG | Total packets | Discarded packets |
| A | 0 | 18520 | 3 |
| B | 0 | 18766 | 3 |
| C | 0 | 18554 | 3 |
| D | 0 | 21540 | 3 |
| Mode SS | |||
|---|---|---|---|
| Quadrant | BADHDUFLAG | Total packets | Discarded packets |
| A | 0 | 184 | 0 |
| B | 0 | 184 | 0 |
| C | 0 | 184 | 0 |
| D | 0 | 184 | 0 |
| Mode M9 | |||
|---|---|---|---|
| Quadrant | BADHDUFLAG | Total packets | Discarded packets |
| A | 0 | 3 | 0 |
| B | 0 | 3 | 0 |
| C | 0 | 3 | 0 |
| D | 0 | 3 | 0 |
| Quadrant | Total seconds | Saturated seconds | Saturation percentage |
|---|---|---|---|
| A | 8924 | 305 | 3.417750% |
| B | 8925 | 363 | 4.067227% |
| C | 8925 | 325 | 3.641457% |
| D | 8925 | 350 | 3.921569% |
Noise dominated data is calculated using 1-second bins in cleaned event files. If a bin has >2000 counts, and if more than 50% of those come from <1% of pixels, then it is considered to be noise-dominated and hence unusable.
| Quadrant | # 1 sec bins | Bins with >0 counts | Bins with >2000 counts | High rate bins dominated by noise | Noise dominated (total time) | Noise dominated (detector-on time) | Marked lightcurve |
|---|---|---|---|---|---|---|---|
| A | 9324 | 8926 | 0 | 0 | 0.00% | 0.00% | 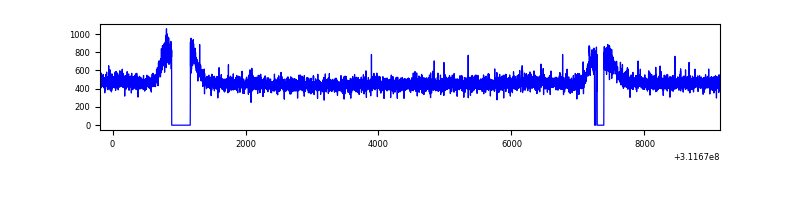 |
| B | 9325 | 8927 | 11 | 11 | 0.12% | 0.12% | 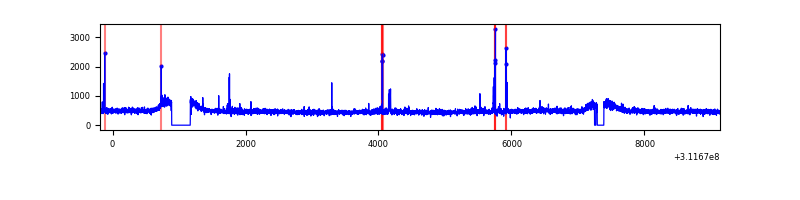 |
| C | 9325 | 8927 | 0 | 0 | 0.00% | 0.00% | 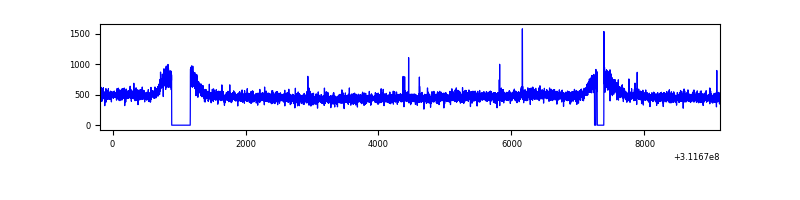 |
| D | 9325 | 8928 | 121 | 121 | 1.30% | 1.36% | 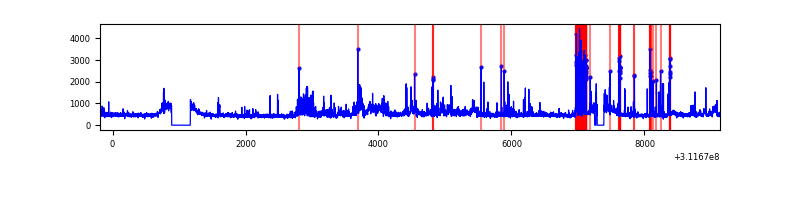 |
Top three noisy pixels from each quadrant. If the there are fewer than three noisy pixels in the level2.evt file, extra rows are filled as -1
| Pixel properties | Quadrant properties | ||||||
|---|---|---|---|---|---|---|---|
| Quadrant | DetID | PixID | Counts | Sigma | Mean | Median | Sigma |
| A | 13 | 254 | 12718 | 52.45 | 1095 | 1068 | 222.1 |
| A | 3 | 137 | 10072 | 40.53 | 1095 | 1068 | 222.1 |
| A | 14 | 254 | 10004 | 40.23 | 1095 | 1068 | 222.1 |
| B | 0 | 190 | 32478 | 148.43 | 1096 | 1066 | 211.6 |
| B | 12 | 111 | 26688 | 121.07 | 1096 | 1066 | 211.6 |
| B | 4 | 52 | 26636 | 120.83 | 1096 | 1066 | 211.6 |
| C | 14 | 238 | 163077 | 651.12 | 1060 | 1065 | 248.8 |
| C | 13 | 61 | 7365 | 25.32 | 1060 | 1065 | 248.8 |
| C | 7 | 245 | 6414 | 21.5 | 1060 | 1065 | 248.8 |
| D | 1 | 52 | 1021031 | 3944.08 | 1063 | 1028 | 258.6 |
| D | 10 | 103 | 123535 | 473.7 | 1063 | 1028 | 258.6 |
| D | 2 | 234 | 37589 | 141.37 | 1063 | 1028 | 258.6 |
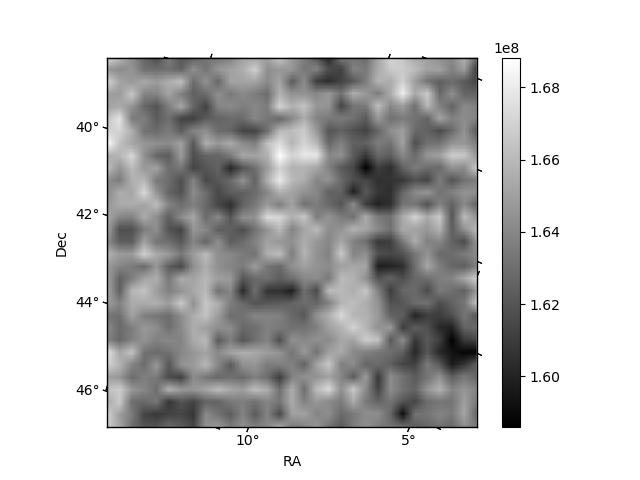
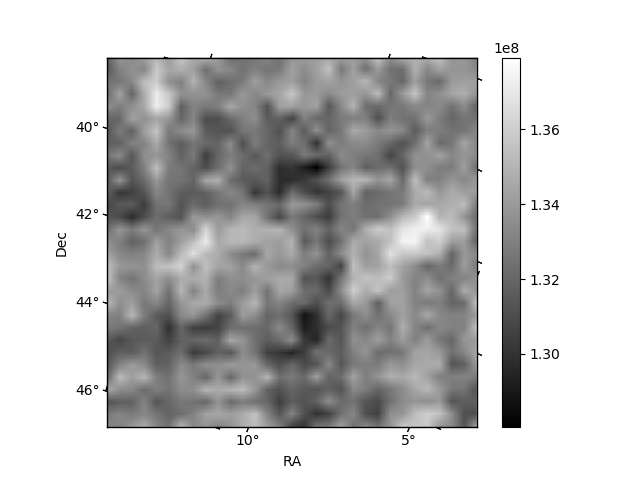
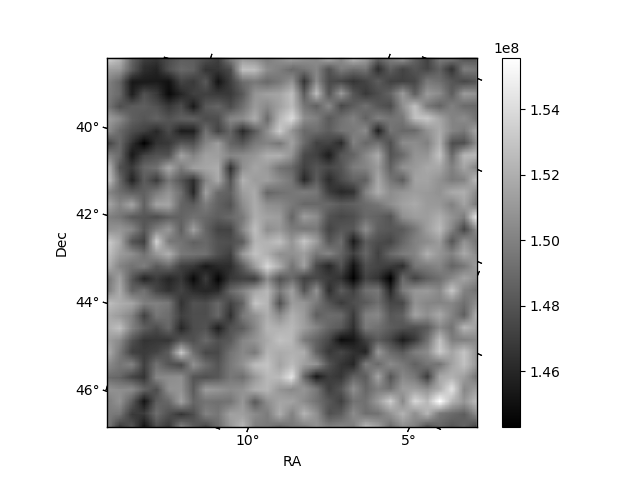
Histogram calculated using DETX and DETY for each event in the final _common_clean file
| Quadrant A | 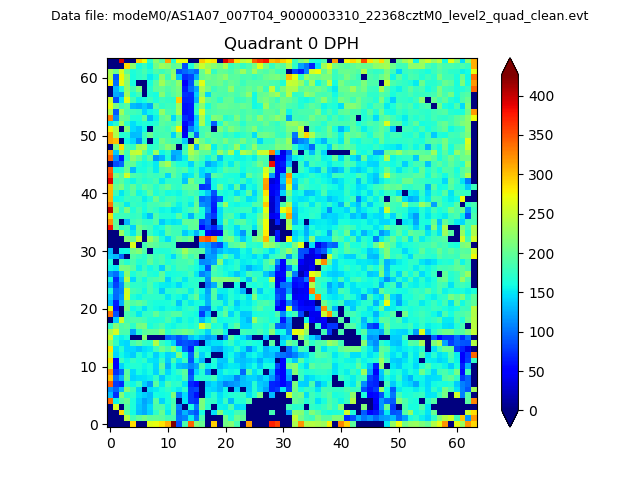 |
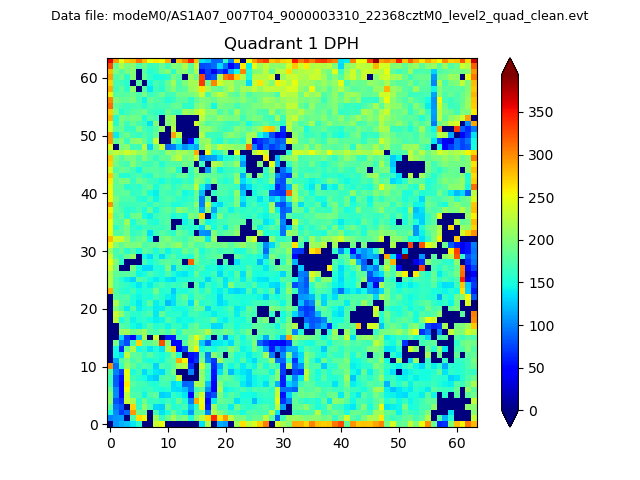 |
Quadrant B |
|---|---|---|---|
| Quadrant D | 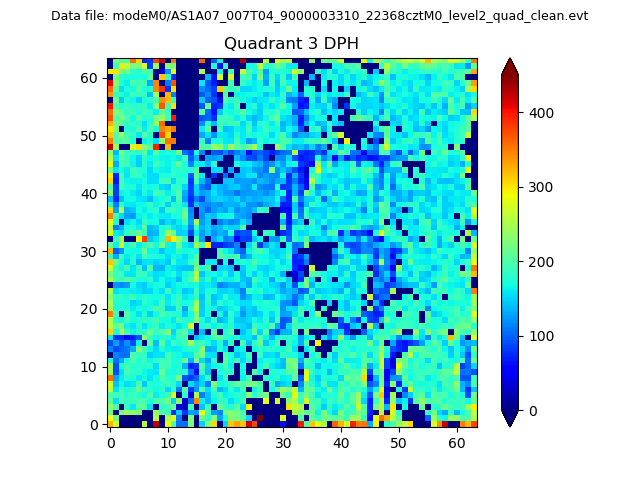 |
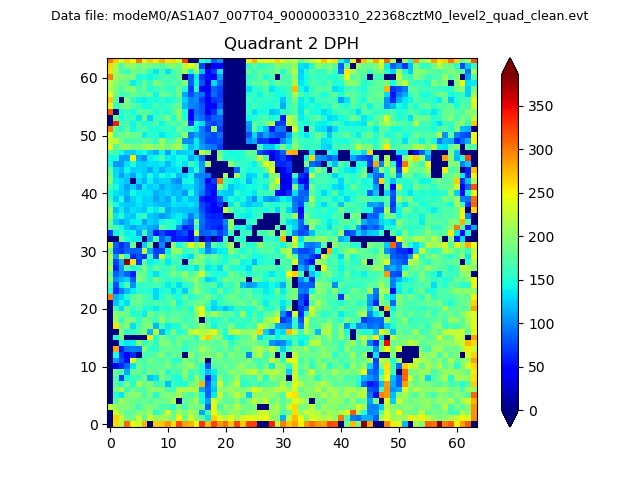 |
Quadrant C |
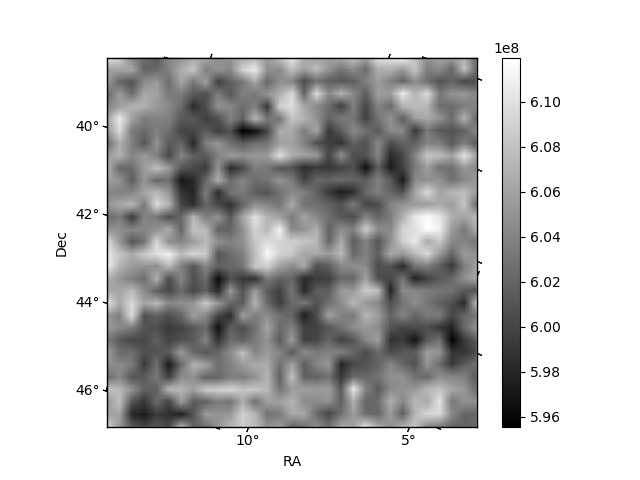
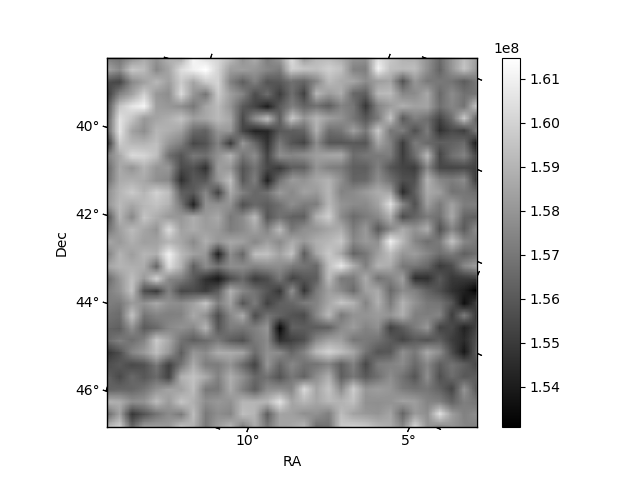
| Plot type | Count rate plots | Images |
|---|---|---|
| Comparison with Poisson distribution Blue bars denote a histogram of data divided into 1 sec bins. Red curve is a Poisson curve with rate = median count rate of data. |
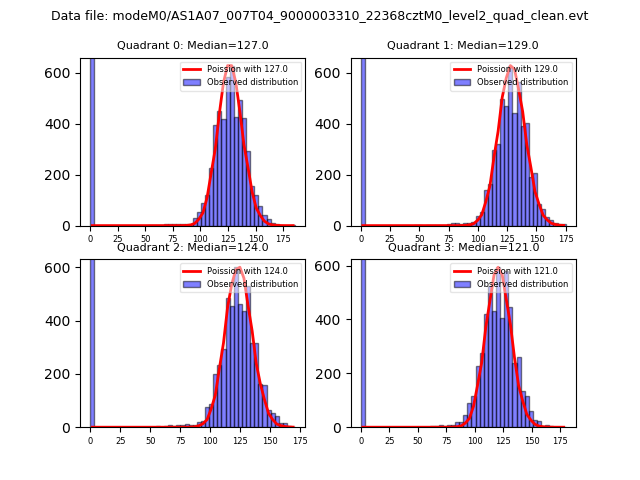 |
 |
| Quadrant-wise count rates Data is divided into 100 sec bins |
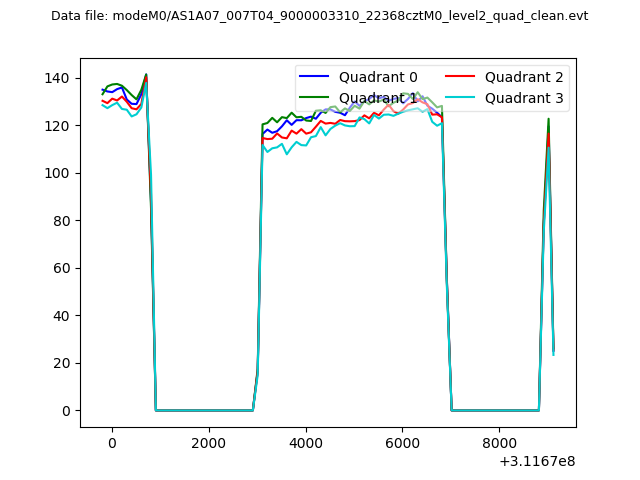 |
|
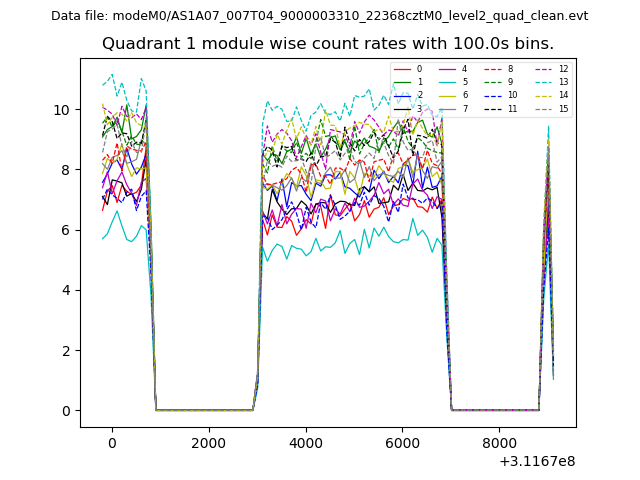
| Module-wise count rates for Quadrant A Data is divided into 100 sec bins |
 |
 |
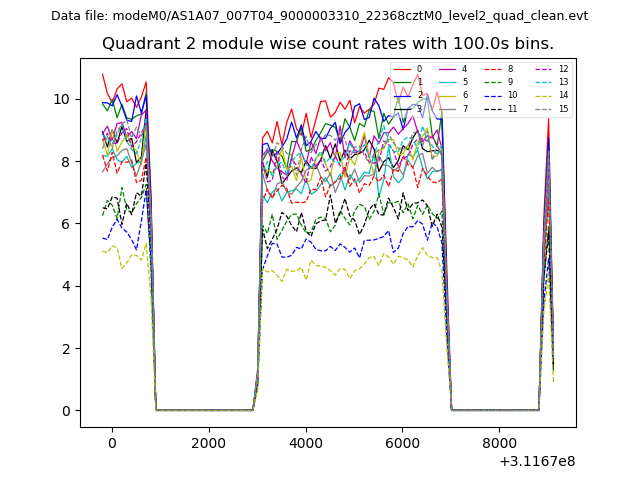
| Module-wise count rates for Quadrant B Data is divided into 100 sec bins |
 |
 |
| Module-wise count rates for Quadrant C Data is divided into 100 sec bins |
 |
 |
| Module-wise count rates for Quadrant D Data is divided into 100 sec bins |
 |
 |
| Parameter | Plot |
|---|---|
| CZT HV Monitor | 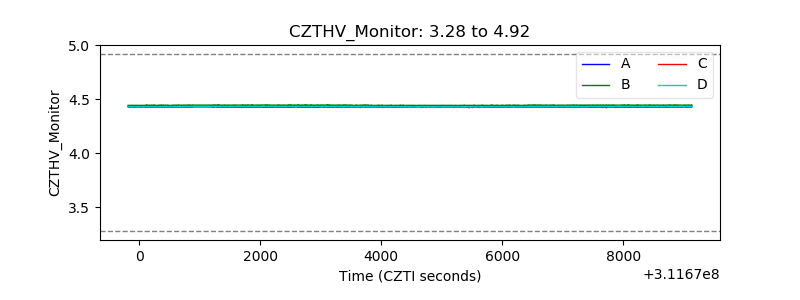 |
| D_VDD | 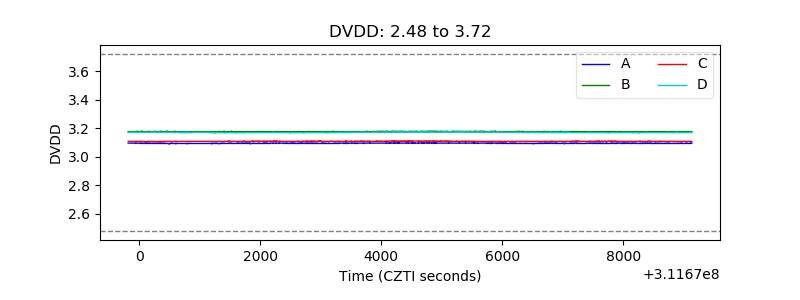 |
| Temperature 1 | 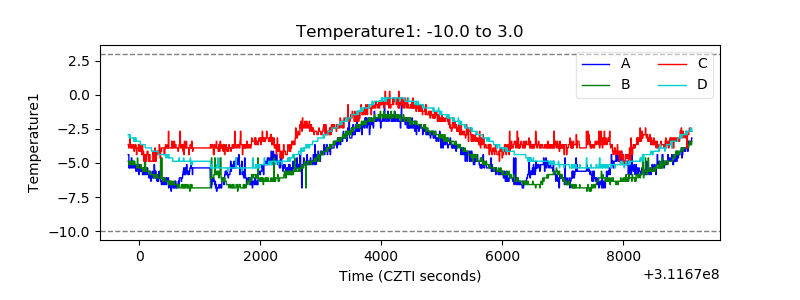 |
| Veto HV Monitor | 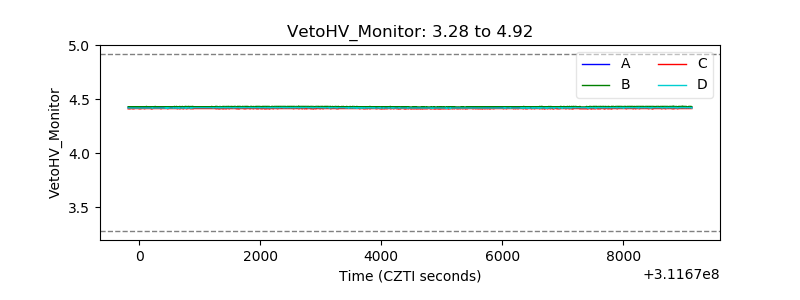 |
| Veto LLD | 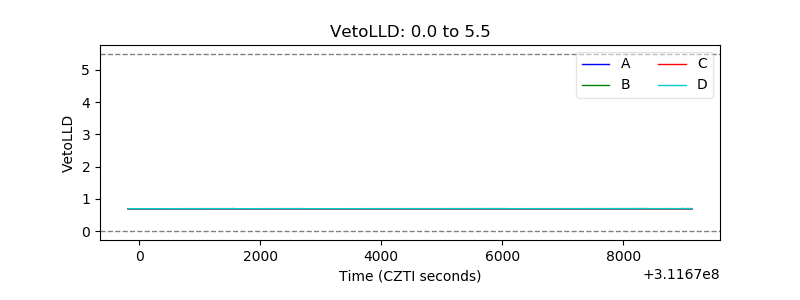 |
| Alpha Counter | 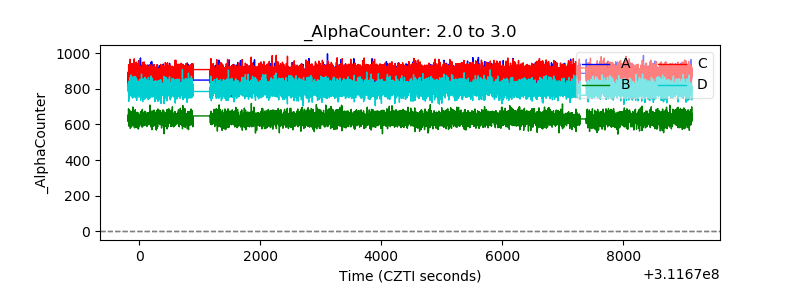 |
| _CPM_Rate | 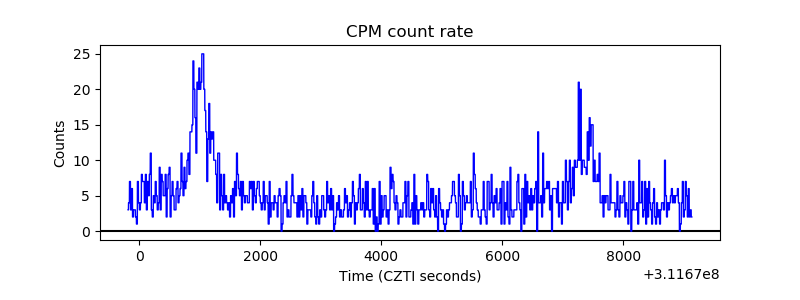 |
| CZT Counter | 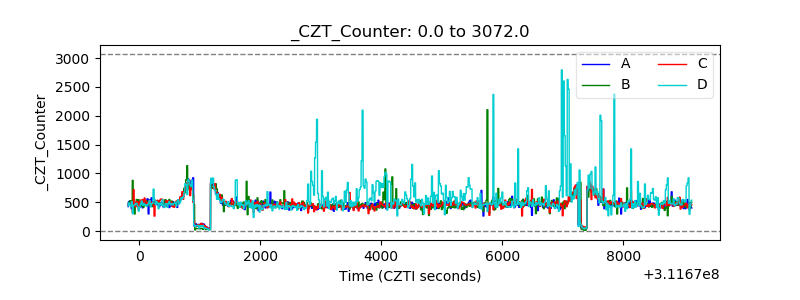 |
| +2.5 Volts monitor |  |
| +5 Volts monitor |  |
| _ROLL_ROT | 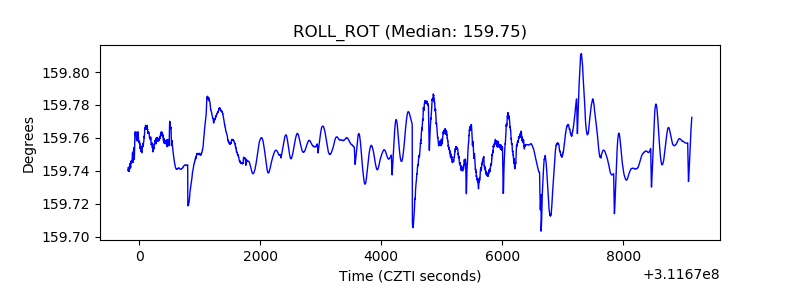 |
| _Roll_DEC | 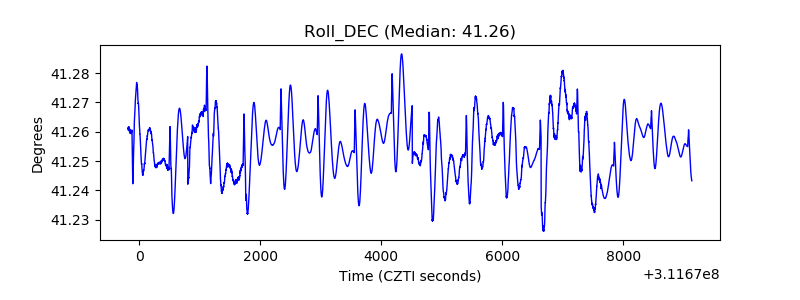 |
| _Roll_RA | 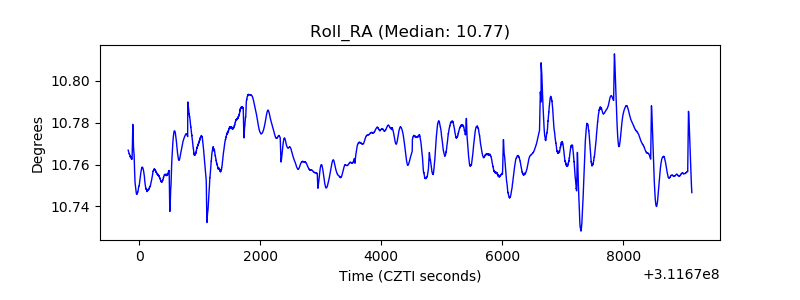 |
| Veto Counter | 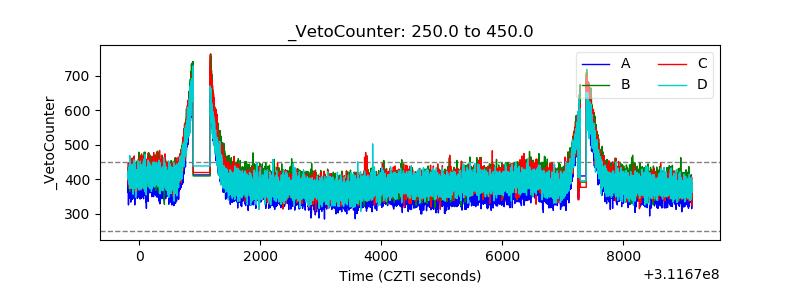 |