| Param | Original file | Final file |
|---|---|---|
| Filename | modeM0/AS1A07_007T04_9000003310_22369cztM0_level2.evt | modeM0/AS1A07_007T04_9000003310_22369cztM0_level2_quad_clean.evt |
| Size (bytes) | 616,815,360 | 99,132,480 |
| Size | 588.2 MB | 94.5 MB |
| Events in quadrant A | 4,048,818 | 615,475 |
| Events in quadrant B | 4,096,851 | 627,219 |
| Events in quadrant C | 4,078,155 | 599,220 |
| Events in quadrant D | 5,877,033 | 567,248 |
| Mode M0 | |||
|---|---|---|---|
| Quadrant | BADHDUFLAG | Total packets | Discarded packets |
| A | 0 | 17645 | 3 |
| B | 0 | 17660 | 3 |
| C | 0 | 17632 | 3 |
| D | 0 | 23118 | 3 |
| Mode SS | |||
|---|---|---|---|
| Quadrant | BADHDUFLAG | Total packets | Discarded packets |
| A | 0 | 176 | 0 |
| B | 0 | 176 | 0 |
| C | 0 | 176 | 0 |
| D | 0 | 176 | 0 |
| Mode M9 | |||
|---|---|---|---|
| Quadrant | BADHDUFLAG | Total packets | Discarded packets |
| A | 0 | 4 | 0 |
| B | 0 | 4 | 0 |
| C | 0 | 4 | 0 |
| D | 0 | 4 | 0 |
| Quadrant | Total seconds | Saturated seconds | Saturation percentage |
|---|---|---|---|
| A | 8531 | 265 | 3.106318% |
| B | 8532 | 288 | 3.375527% |
| C | 8532 | 280 | 3.281763% |
| D | 8532 | 610 | 7.149555% |
Noise dominated data is calculated using 1-second bins in cleaned event files. If a bin has >2000 counts, and if more than 50% of those come from <1% of pixels, then it is considered to be noise-dominated and hence unusable.
| Quadrant | # 1 sec bins | Bins with >0 counts | Bins with >2000 counts | High rate bins dominated by noise | Noise dominated (total time) | Noise dominated (detector-on time) | Marked lightcurve |
|---|---|---|---|---|---|---|---|
| A | 8946 | 8533 | 0 | 0 | 0.00% | 0.00% | 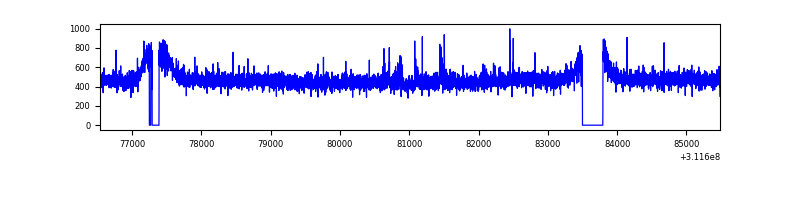 |
| B | 8947 | 8534 | 0 | 0 | 0.00% | 0.00% | 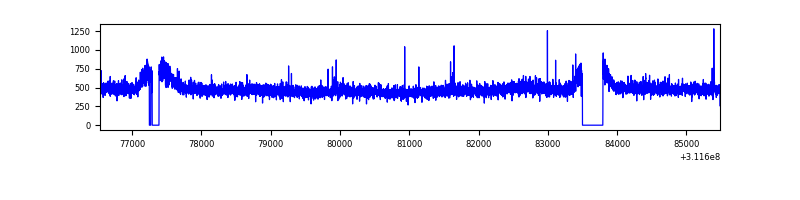 |
| C | 8947 | 8533 | 2 | 2 | 0.02% | 0.02% | 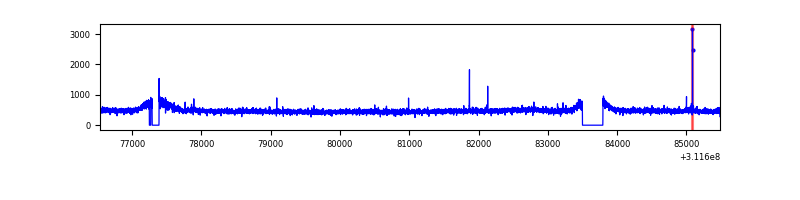 |
| D | 8947 | 8534 | 388 | 388 | 4.34% | 4.55% | 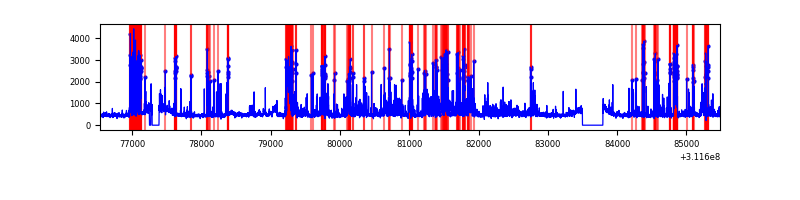 |
Top three noisy pixels from each quadrant. If the there are fewer than three noisy pixels in the level2.evt file, extra rows are filled as -1
| Pixel properties | Quadrant properties | ||||||
|---|---|---|---|---|---|---|---|
| Quadrant | DetID | PixID | Counts | Sigma | Mean | Median | Sigma |
| A | 3 | 1 | 49315 | 229.69 | 1037 | 1012 | 210.3 |
| A | 13 | 254 | 12035 | 52.42 | 1037 | 1012 | 210.3 |
| A | 3 | 137 | 9393 | 39.85 | 1037 | 1012 | 210.3 |
| B | 12 | 111 | 25045 | 120.57 | 1036 | 1007 | 199.4 |
| B | 11 | 111 | 22088 | 105.74 | 1036 | 1007 | 199.4 |
| B | 14 | 111 | 19425 | 92.38 | 1036 | 1007 | 199.4 |
| C | 14 | 238 | 157052 | 667.65 | 997 | 999 | 233.7 |
| C | 10 | 22 | 19061 | 77.28 | 997 | 999 | 233.7 |
| C | 7 | 245 | 7335 | 27.11 | 997 | 999 | 233.7 |
| D | 1 | 52 | 2009827 | 8293.41 | 988 | 955 | 242.2 |
| D | 15 | 145 | 67327 | 274.01 | 988 | 955 | 242.2 |
| D | 2 | 234 | 35565 | 142.88 | 988 | 955 | 242.2 |
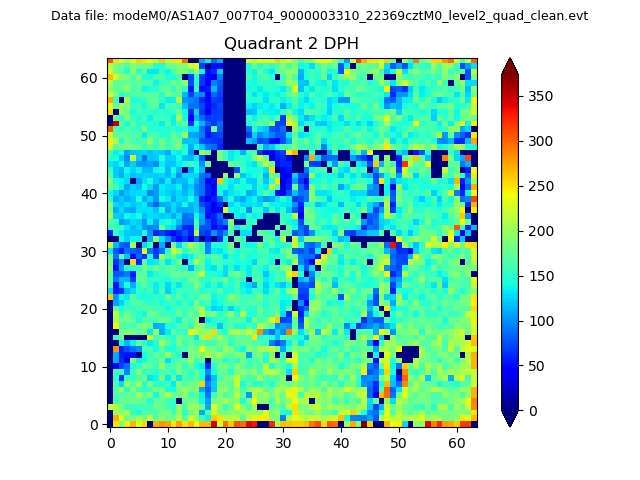
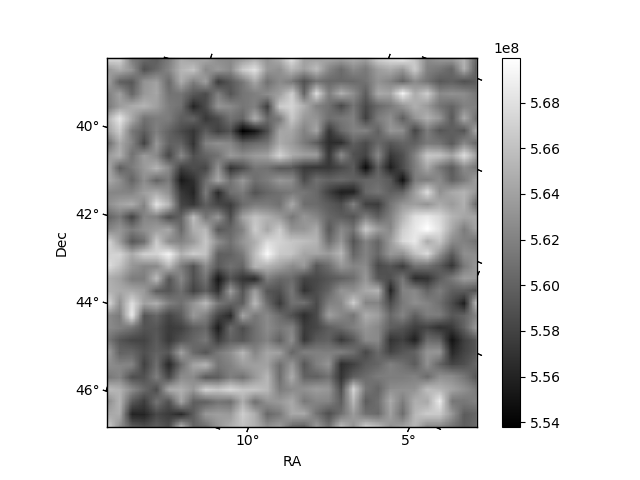
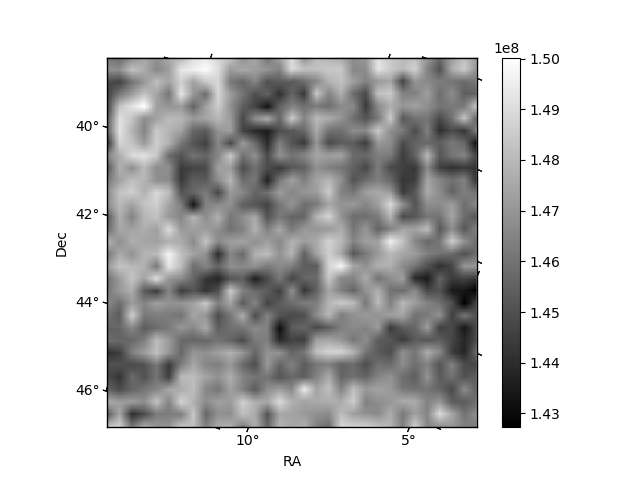
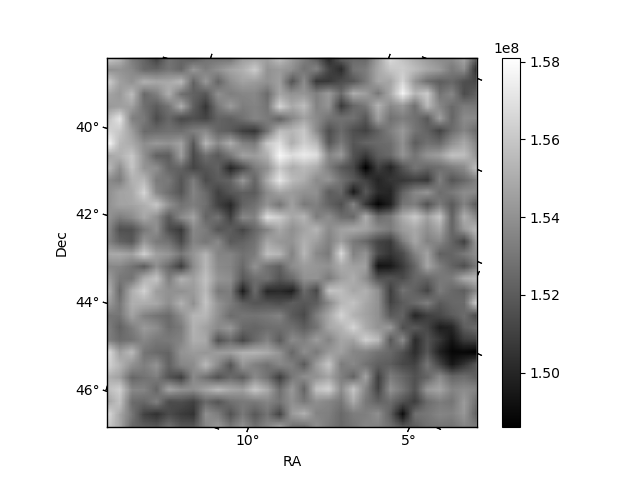
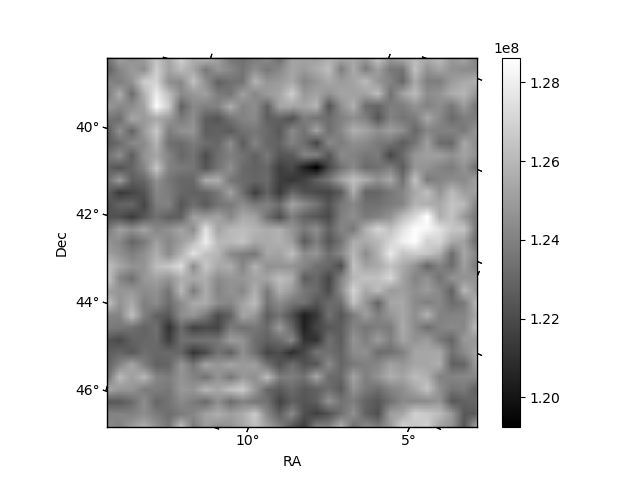
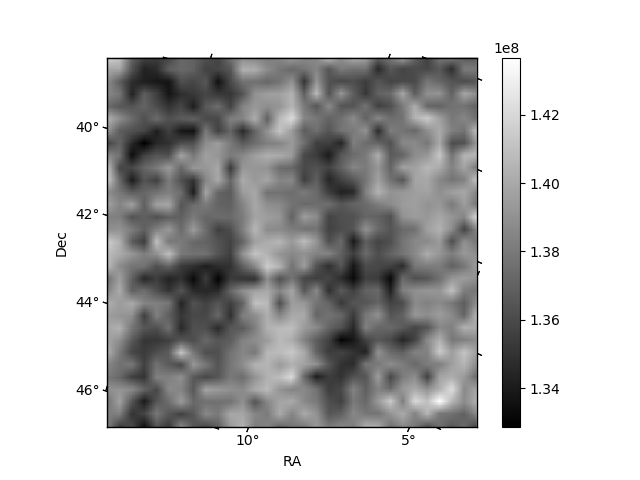
Histogram calculated using DETX and DETY for each event in the final _common_clean file
| Quadrant A | 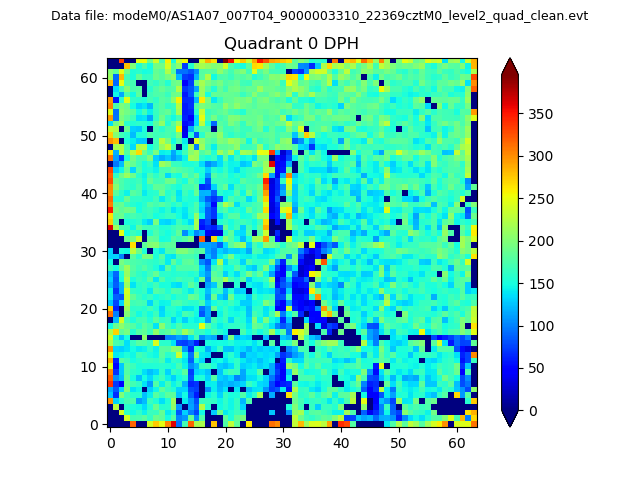 |
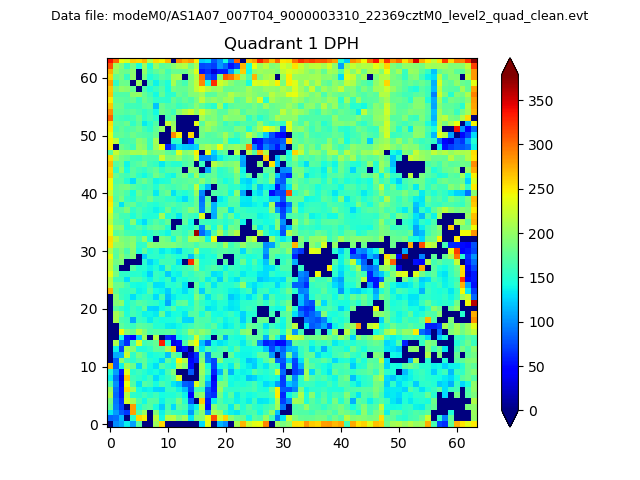 |
Quadrant B |
|---|---|---|---|
| Quadrant D | 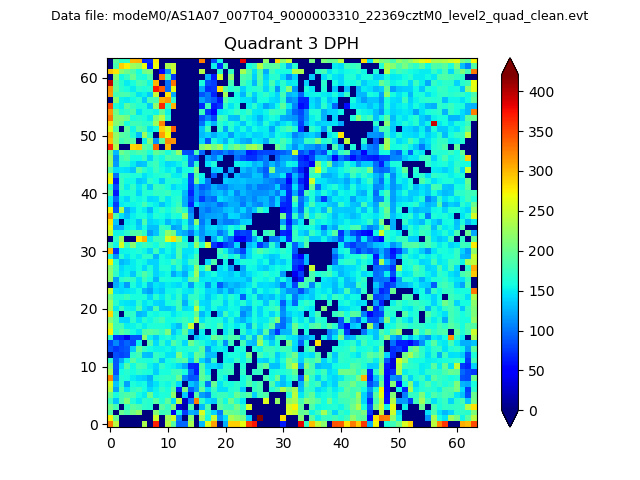 |
 |
Quadrant C |
| Plot type | Count rate plots | Images |
|---|---|---|
| Comparison with Poisson distribution Blue bars denote a histogram of data divided into 1 sec bins. Red curve is a Poisson curve with rate = median count rate of data. |
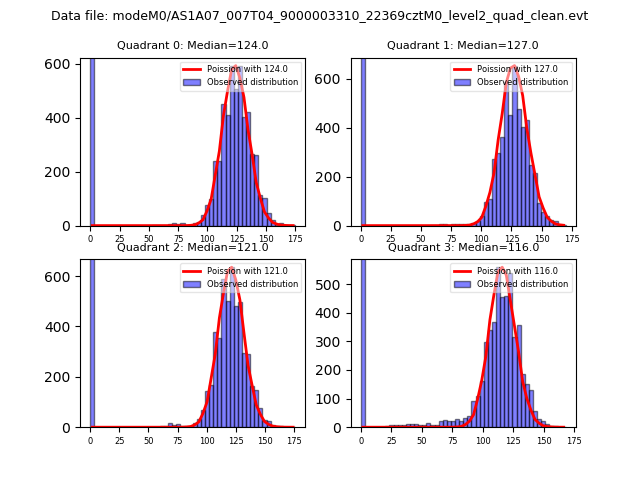 |
 |
| Quadrant-wise count rates Data is divided into 100 sec bins |
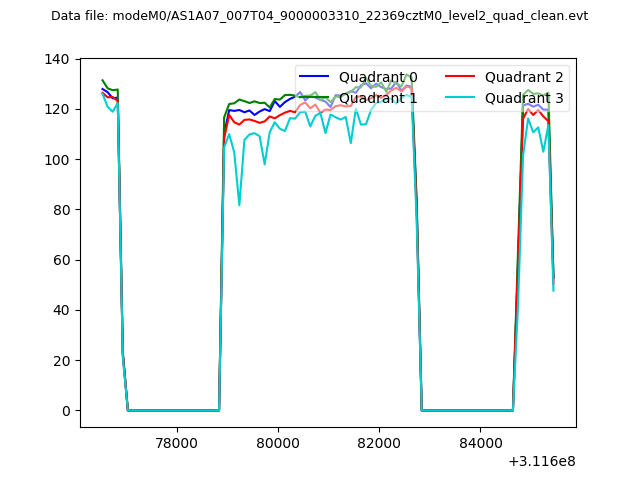 |
|
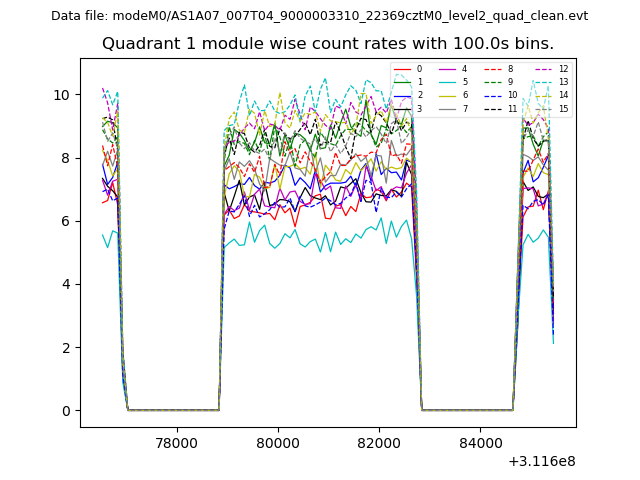
| Module-wise count rates for Quadrant A Data is divided into 100 sec bins |
 |
 |
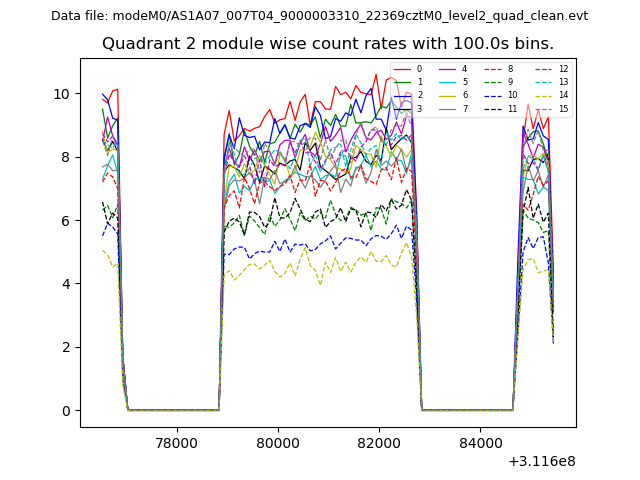
| Module-wise count rates for Quadrant B Data is divided into 100 sec bins |
 |
 |
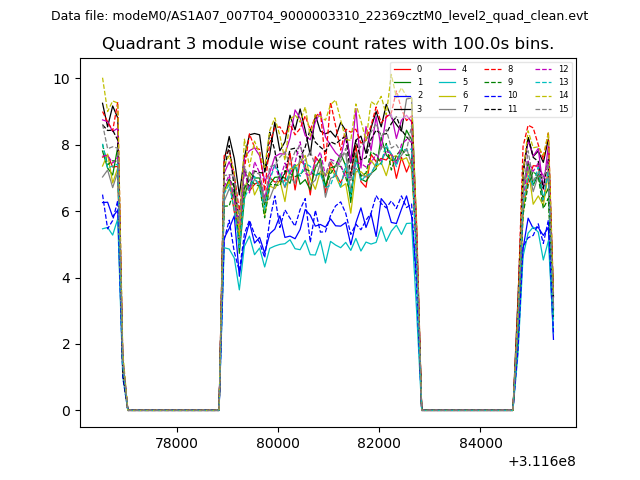
| Module-wise count rates for Quadrant C Data is divided into 100 sec bins |
 |
 |
| Module-wise count rates for Quadrant D Data is divided into 100 sec bins |
 |
 |
| Parameter | Plot |
|---|---|
| CZT HV Monitor | 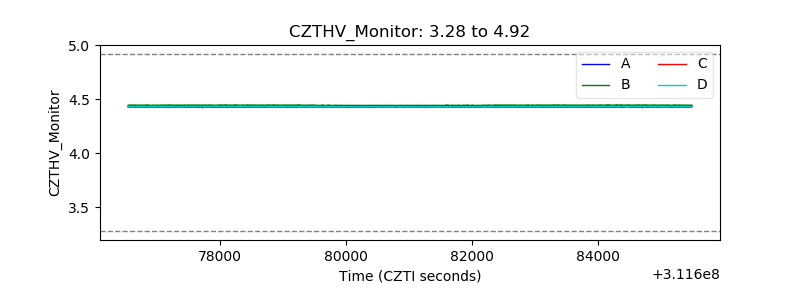 |
| D_VDD | 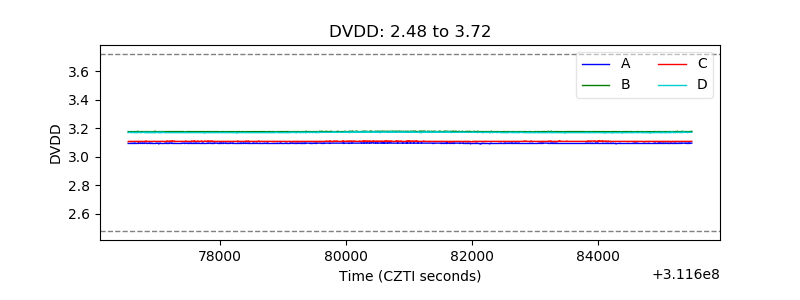 |
| Temperature 1 | 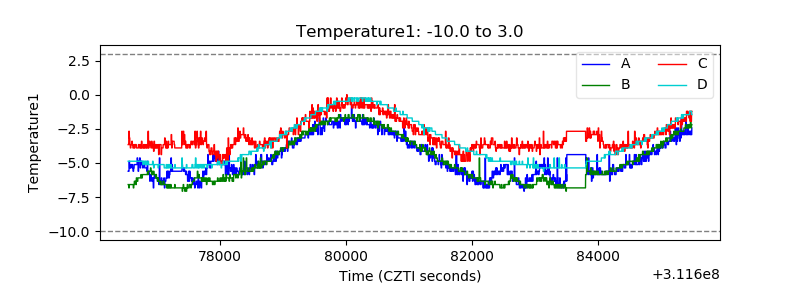 |
| Veto HV Monitor | 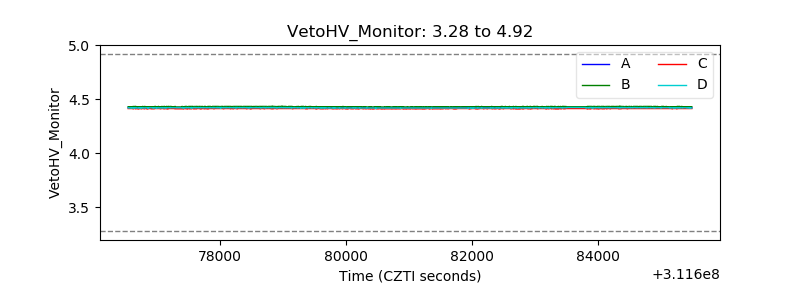 |
| Veto LLD |  |
| Alpha Counter | 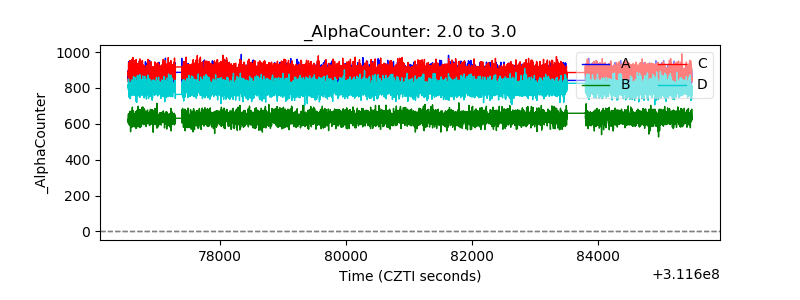 |
| _CPM_Rate | 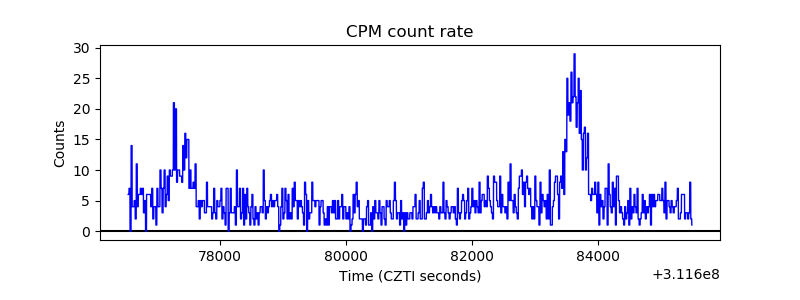 |
| CZT Counter | 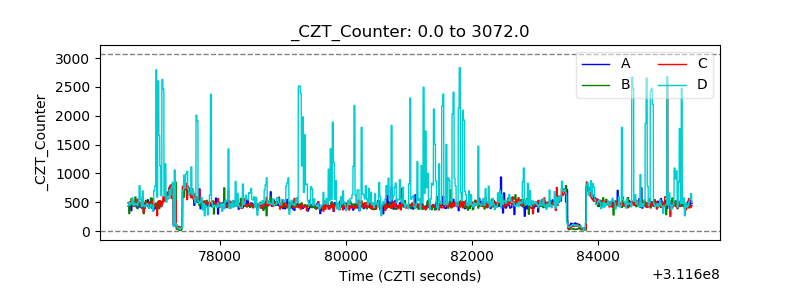 |
| +2.5 Volts monitor |  |
| +5 Volts monitor |  |
| _ROLL_ROT |  |
| _Roll_DEC | 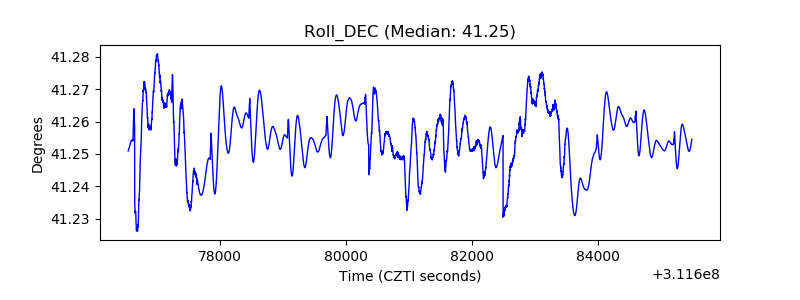 |
| _Roll_RA | 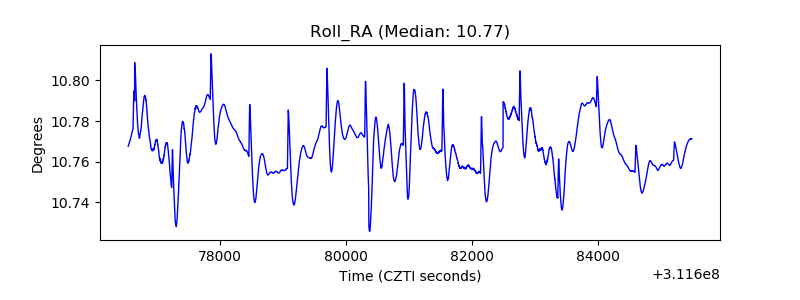 |
| Veto Counter | 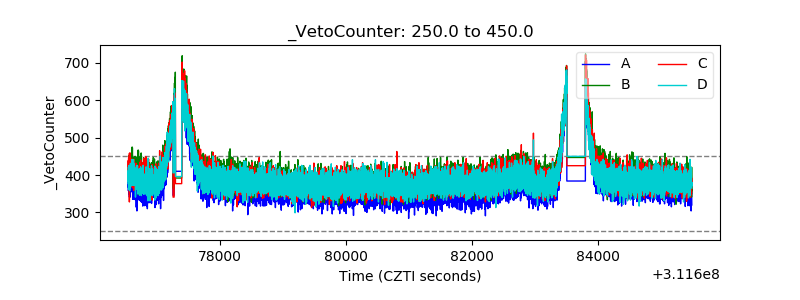 |