| Param | Original file | Final file |
|---|---|---|
| Filename | modeM0/AS1A07_007T04_9000003310_22373cztM0_level2.evt | modeM0/AS1A07_007T04_9000003310_22373cztM0_level2_quad_clean.evt |
| Size (bytes) | 468,103,680 | 97,470,720 |
| Size | 446.4 MB | 93.0 MB |
| Events in quadrant A | 3,116,472 | 637,562 |
| Events in quadrant B | 3,219,783 | 644,071 |
| Events in quadrant C | 3,166,632 | 616,161 |
| Events in quadrant D | 4,227,441 | 595,987 |
| Mode M0 | |||
|---|---|---|---|
| Quadrant | BADHDUFLAG | Total packets | Discarded packets |
| A | 0 | 13688 | 2 |
| B | 0 | 13848 | 2 |
| C | 0 | 13705 | 2 |
| D | 0 | 17044 | 2 |
| Mode SS | |||
|---|---|---|---|
| Quadrant | BADHDUFLAG | Total packets | Discarded packets |
| A | 0 | 136 | 0 |
| B | 0 | 136 | 0 |
| C | 0 | 136 | 0 |
| D | 0 | 136 | 0 |
| Mode M9 | |||
|---|---|---|---|
| Quadrant | BADHDUFLAG | Total packets | Discarded packets |
| A | 0 | 17 | 0 |
| B | 0 | 18 | 0 |
| C | 0 | 18 | 0 |
| D | 0 | 18 | 0 |
| Quadrant | Total seconds | Saturated seconds | Saturation percentage |
|---|---|---|---|
| A | 6566 | 48 | 0.731039% |
| B | 6566 | 56 | 0.852878% |
| C | 6566 | 87 | 1.325008% |
| D | 6566 | 186 | 2.832775% |
Noise dominated data is calculated using 1-second bins in cleaned event files. If a bin has >2000 counts, and if more than 50% of those come from <1% of pixels, then it is considered to be noise-dominated and hence unusable.
| Quadrant | # 1 sec bins | Bins with >0 counts | Bins with >2000 counts | High rate bins dominated by noise | Noise dominated (total time) | Noise dominated (detector-on time) | Marked lightcurve |
|---|---|---|---|---|---|---|---|
| A | 7601 | 6566 | 0 | 0 | 0.00% | 0.00% | 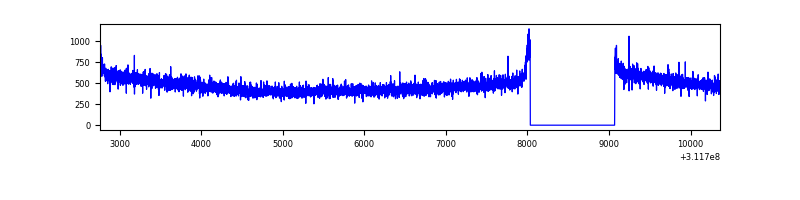 |
| B | 7601 | 6566 | 1 | 1 | 0.01% | 0.02% | 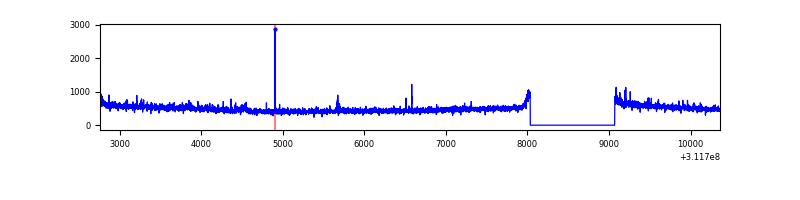 |
| C | 7601 | 6566 | 1 | 1 | 0.01% | 0.02% | 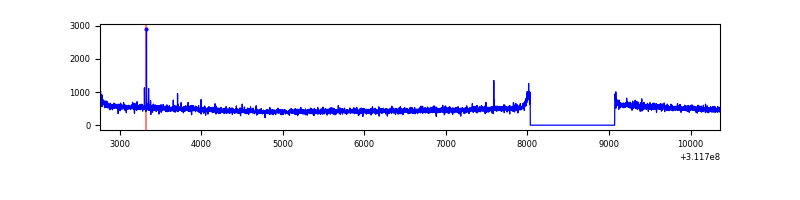 |
| D | 7601 | 6566 | 127 | 127 | 1.67% | 1.93% | 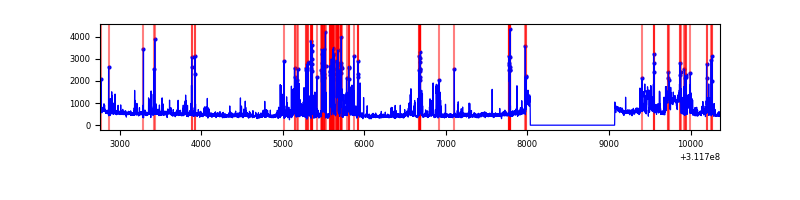 |
Top three noisy pixels from each quadrant. If the there are fewer than three noisy pixels in the level2.evt file, extra rows are filled as -1
| Pixel properties | Quadrant properties | ||||||
|---|---|---|---|---|---|---|---|
| Quadrant | DetID | PixID | Counts | Sigma | Mean | Median | Sigma |
| A | 13 | 254 | 9554 | 54.11 | 808 | 791 | 162.0 |
| A | 0 | 226 | 7067 | 38.75 | 808 | 791 | 162.0 |
| A | 3 | 137 | 6888 | 37.65 | 808 | 791 | 162.0 |
| B | 0 | 229 | 23064 | 146.69 | 804 | 783 | 151.9 |
| B | 0 | 190 | 18584 | 117.19 | 804 | 783 | 151.9 |
| B | 12 | 111 | 18093 | 113.96 | 804 | 783 | 151.9 |
| C | 14 | 238 | 120230 | 658.36 | 777 | 781 | 181.4 |
| C | 0 | 207 | 11784 | 60.64 | 777 | 781 | 181.4 |
| C | 13 | 61 | 5355 | 25.21 | 777 | 781 | 181.4 |
| D | 1 | 52 | 1200230 | 6312.7 | 784 | 758 | 190.0 |
| D | 13 | 172 | 38867 | 200.56 | 784 | 758 | 190.0 |
| D | 2 | 234 | 29490 | 151.21 | 784 | 758 | 190.0 |
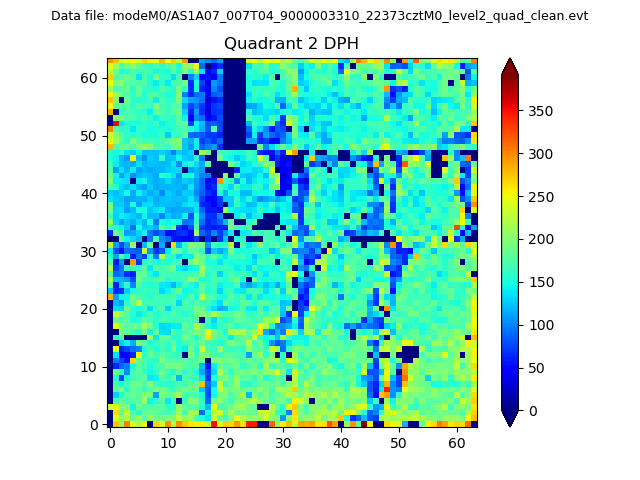
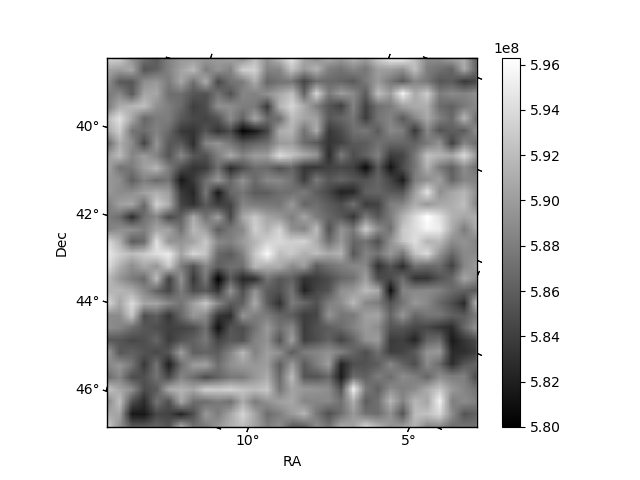
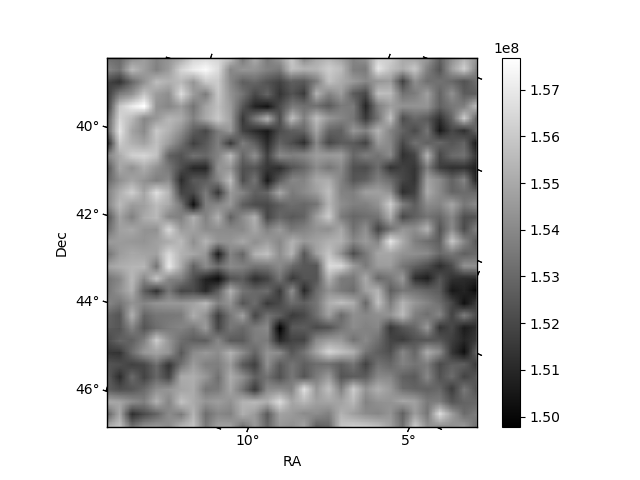
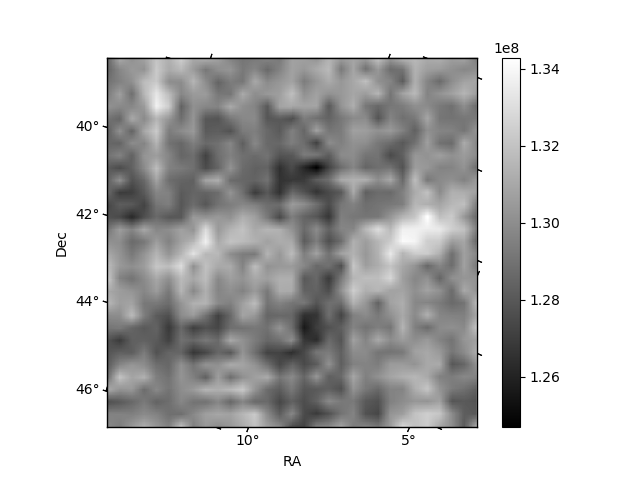
Histogram calculated using DETX and DETY for each event in the final _common_clean file
| Quadrant A | 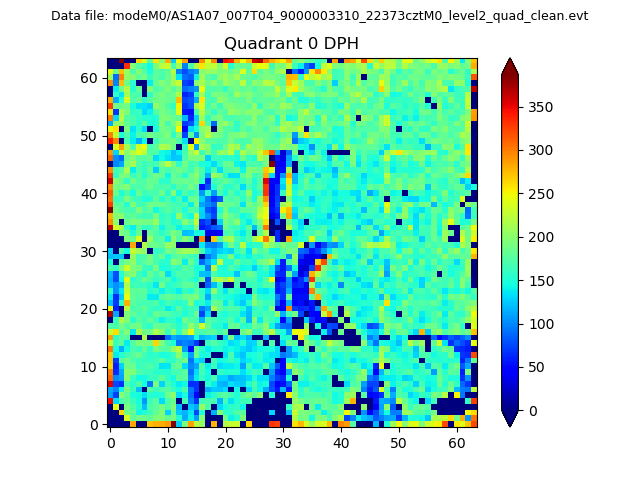 |
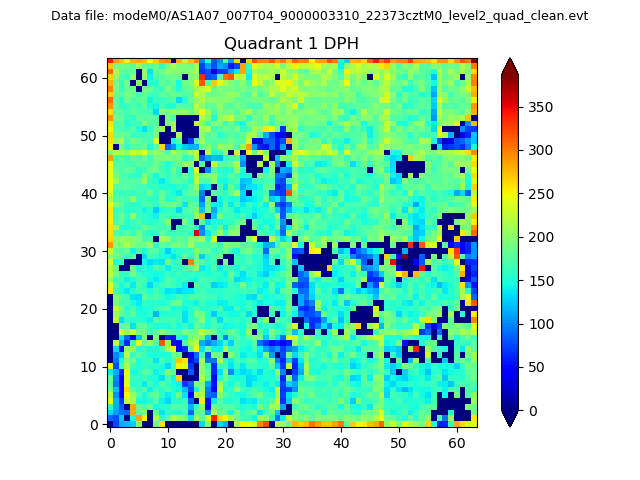 |
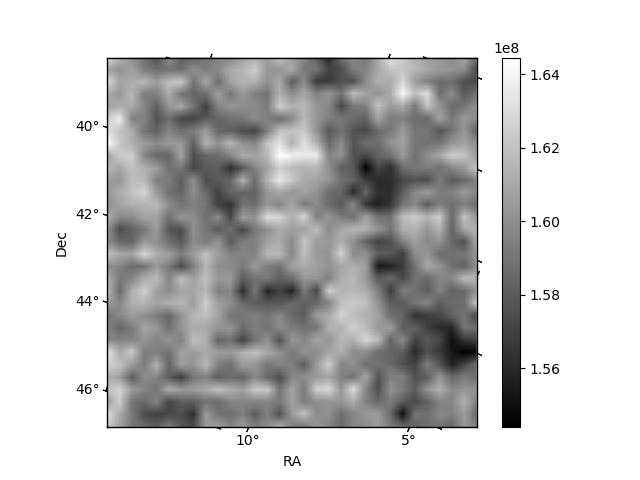
Quadrant B |
|---|---|---|---|
| Quadrant D | 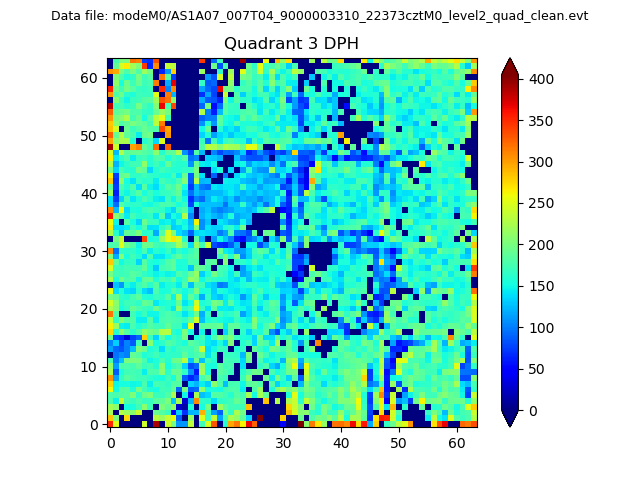 |
 |
Quadrant C |
| Plot type | Count rate plots | Images |
|---|---|---|
| Comparison with Poisson distribution Blue bars denote a histogram of data divided into 1 sec bins. Red curve is a Poisson curve with rate = median count rate of data. |
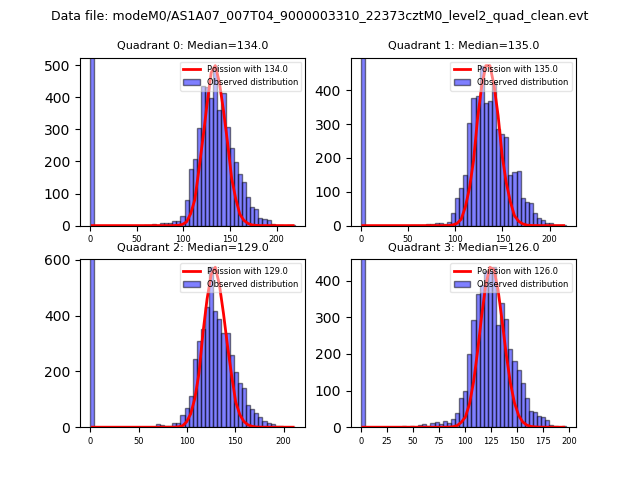 |
 |
| Quadrant-wise count rates Data is divided into 100 sec bins |
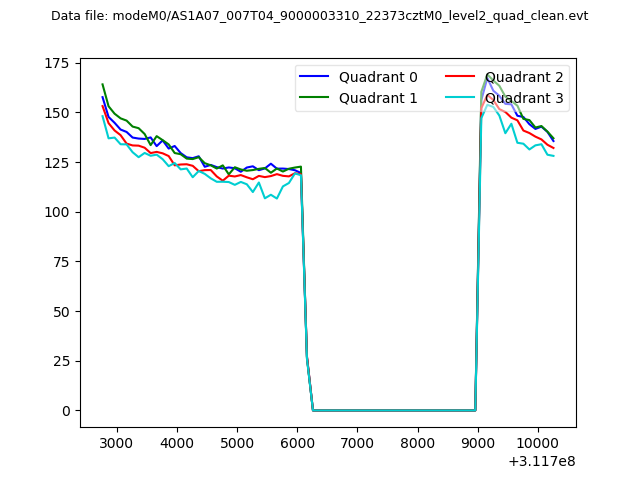 |
|
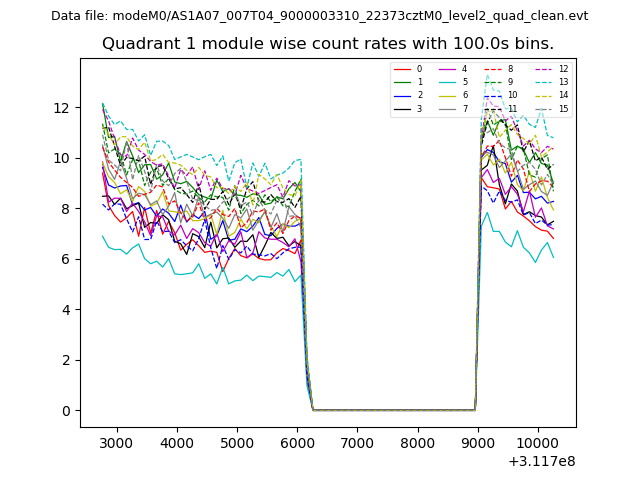
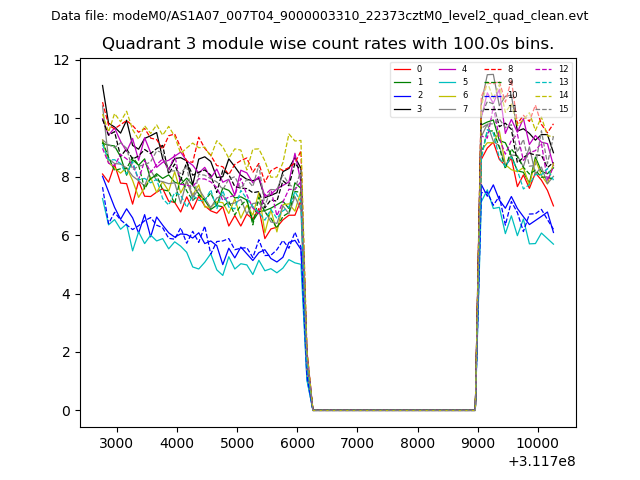
| Module-wise count rates for Quadrant A Data is divided into 100 sec bins |
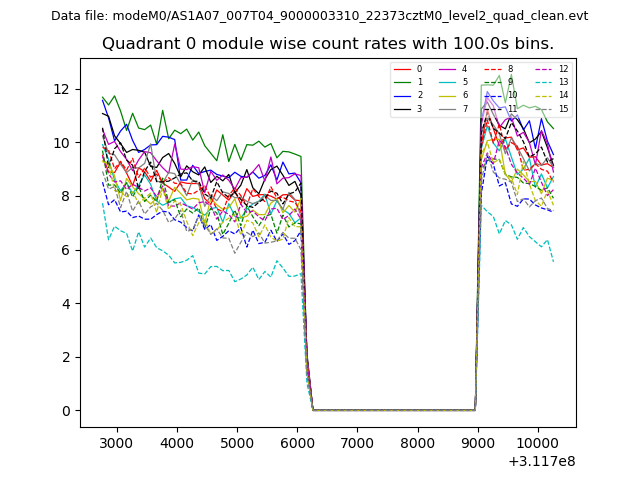 |
 |
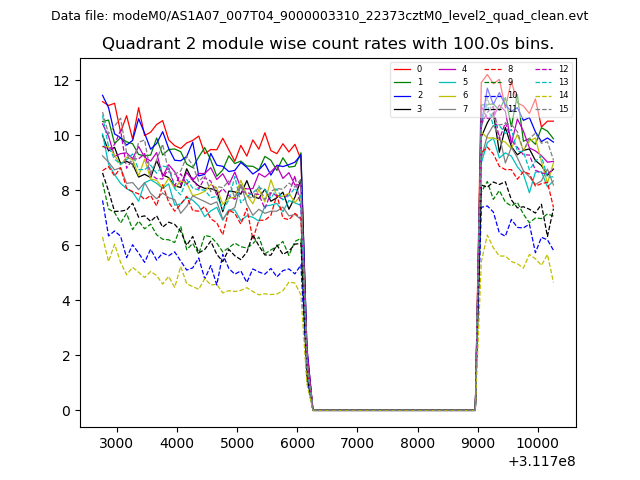
| Module-wise count rates for Quadrant B Data is divided into 100 sec bins |
 |
 |
| Module-wise count rates for Quadrant C Data is divided into 100 sec bins |
 |
 |
| Module-wise count rates for Quadrant D Data is divided into 100 sec bins |
 |
 |
| Parameter | Plot |
|---|---|
| CZT HV Monitor | 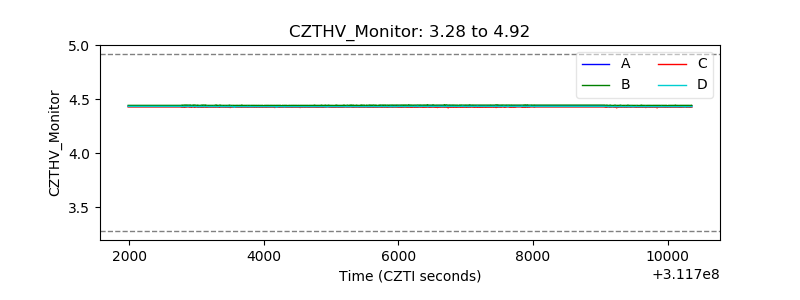 |
| D_VDD | 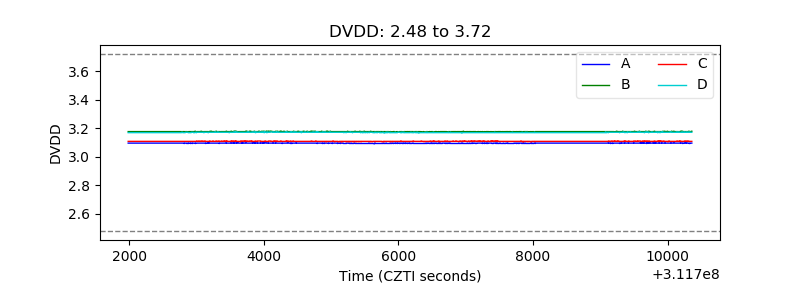 |
| Temperature 1 | 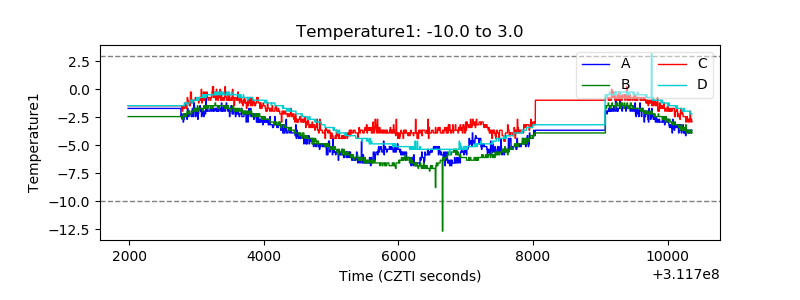 |
| Veto HV Monitor | 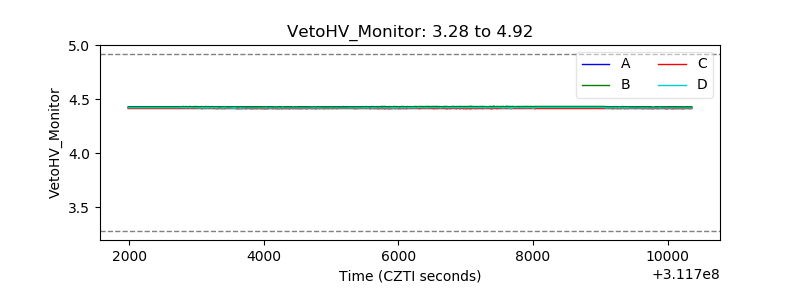 |
| Veto LLD | 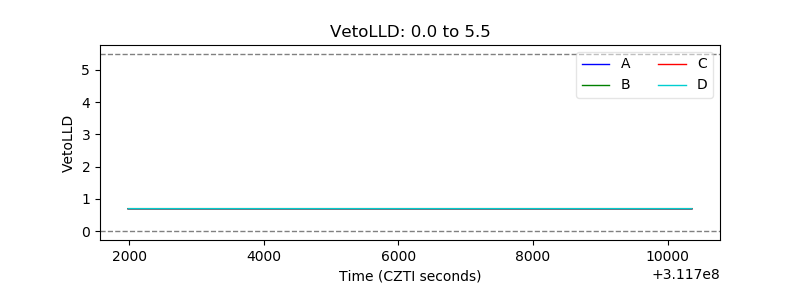 |
| Alpha Counter | 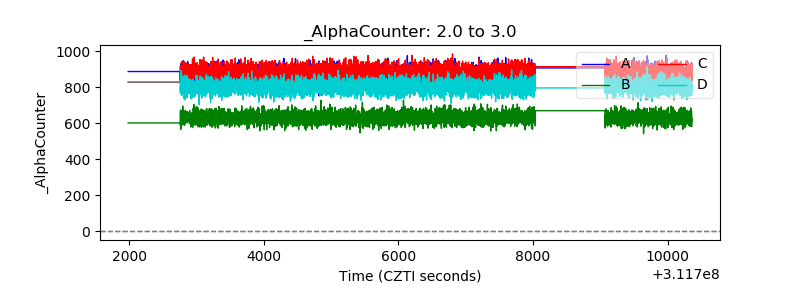 |
| _CPM_Rate | 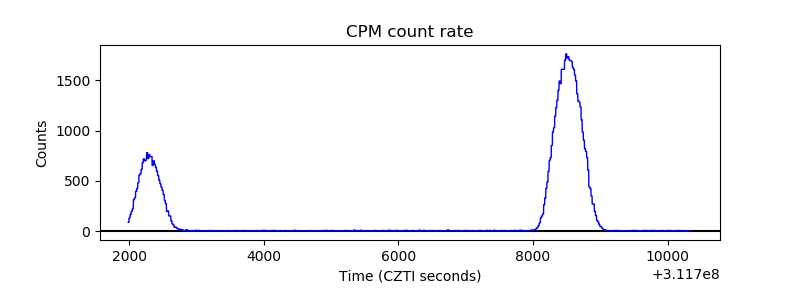 |
| CZT Counter | 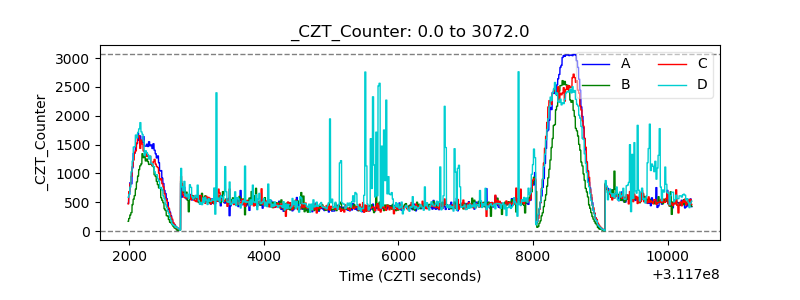 |
| +2.5 Volts monitor |  |
| +5 Volts monitor | 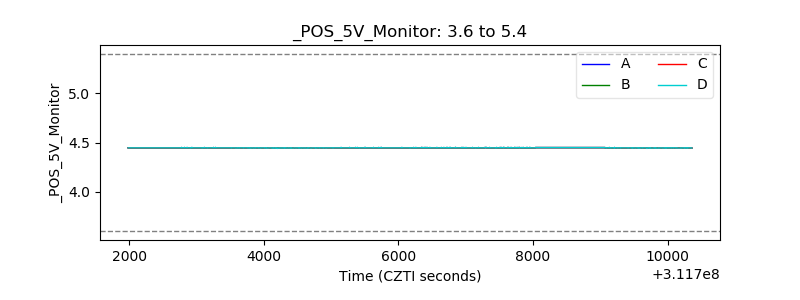 |
| _ROLL_ROT |  |
| _Roll_DEC |  |
| _Roll_RA | 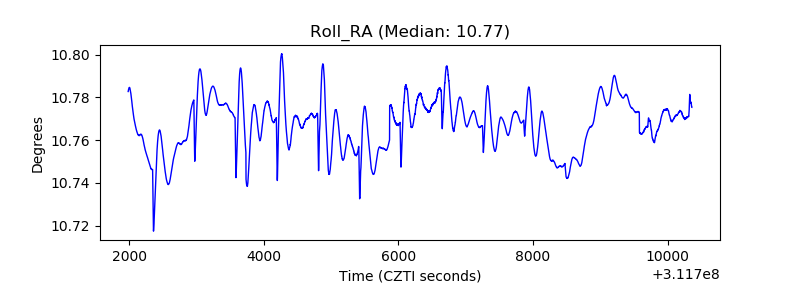 |
| Veto Counter | 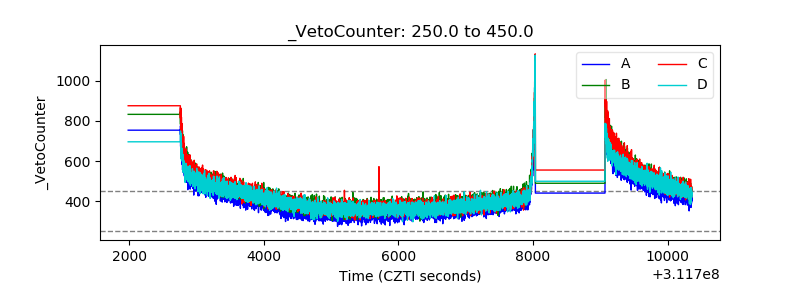 |