| Param | Original file | Final file |
|---|---|---|
| Filename | modeM0/AS1A07_007T04_9000003310_22377cztM0_level2.evt | modeM0/AS1A07_007T04_9000003310_22377cztM0_level2_quad_clean.evt |
| Size (bytes) | 633,093,120 | 93,479,040 |
| Size | 603.8 MB | 89.1 MB |
| Events in quadrant A | 3,062,530 | 653,724 |
| Events in quadrant B | 3,178,079 | 678,064 |
| Events in quadrant C | 3,180,080 | 639,653 |
| Events in quadrant D | 9,338,633 | 432,102 |
| Mode M0 | |||
|---|---|---|---|
| Quadrant | BADHDUFLAG | Total packets | Discarded packets |
| A | 0 | 12916 | 2 |
| B | 0 | 13190 | 2 |
| C | 0 | 13223 | 2 |
| D | 0 | 31856 | 2 |
| Mode SS | |||
|---|---|---|---|
| Quadrant | BADHDUFLAG | Total packets | Discarded packets |
| A | 0 | 126 | 0 |
| B | 0 | 126 | 0 |
| C | 0 | 126 | 0 |
| D | 0 | 126 | 0 |
| Mode M9 | |||
|---|---|---|---|
| Quadrant | BADHDUFLAG | Total packets | Discarded packets |
| A | 0 | 24 | 0 |
| B | 0 | 25 | 0 |
| C | 0 | 25 | 0 |
| D | 0 | 25 | 0 |
| Quadrant | Total seconds | Saturated seconds | Saturation percentage |
|---|---|---|---|
| A | 6102 | 21 | 0.344149% |
| B | 6102 | 35 | 0.573582% |
| C | 6102 | 65 | 1.065225% |
| D | 6102 | 2497 | 40.921010% |
Noise dominated data is calculated using 1-second bins in cleaned event files. If a bin has >2000 counts, and if more than 50% of those come from <1% of pixels, then it is considered to be noise-dominated and hence unusable.
| Quadrant | # 1 sec bins | Bins with >0 counts | Bins with >2000 counts | High rate bins dominated by noise | Noise dominated (total time) | Noise dominated (detector-on time) | Marked lightcurve |
|---|---|---|---|---|---|---|---|
| A | 7472 | 6103 | 0 | 0 | 0.00% | 0.00% | 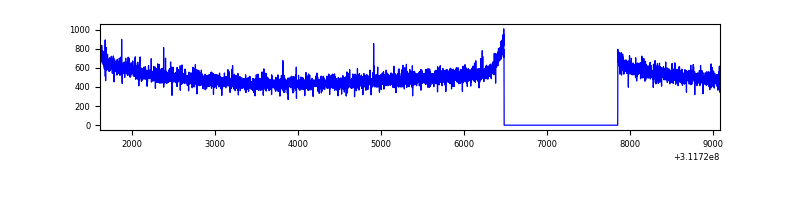 |
| B | 7472 | 6103 | 0 | 0 | 0.00% | 0.00% | 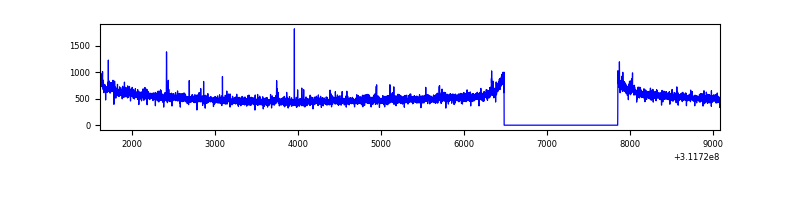 |
| C | 7472 | 6103 | 0 | 0 | 0.00% | 0.00% | 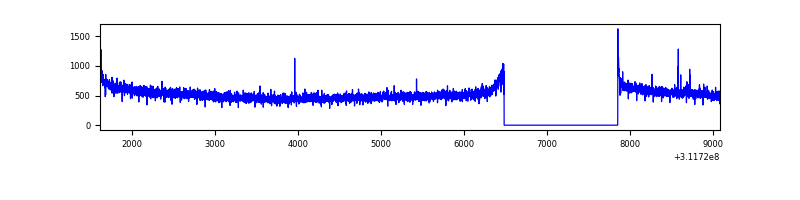 |
| D | 7472 | 6102 | 2421 | 2421 | 32.40% | 39.68% | 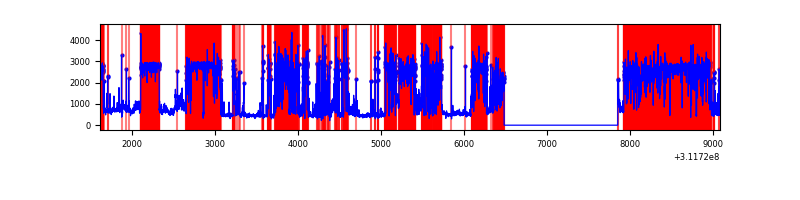 |
Top three noisy pixels from each quadrant. If the there are fewer than three noisy pixels in the level2.evt file, extra rows are filled as -1
| Pixel properties | Quadrant properties | ||||||
|---|---|---|---|---|---|---|---|
| Quadrant | DetID | PixID | Counts | Sigma | Mean | Median | Sigma |
| A | 13 | 254 | 9289 | 53.74 | 794 | 777 | 158.4 |
| A | 0 | 226 | 6732 | 37.6 | 794 | 777 | 158.4 |
| A | 3 | 137 | 6248 | 34.54 | 794 | 777 | 158.4 |
| B | 3 | 64 | 18604 | 120.67 | 801 | 782 | 147.7 |
| B | 0 | 245 | 17465 | 112.96 | 801 | 782 | 147.7 |
| B | 12 | 111 | 17056 | 110.19 | 801 | 782 | 147.7 |
| C | 14 | 238 | 123517 | 684.63 | 776 | 784 | 179.3 |
| C | 0 | 10 | 17191 | 91.52 | 776 | 784 | 179.3 |
| C | 10 | 22 | 8224 | 41.5 | 776 | 784 | 179.3 |
| D | 1 | 52 | 6913815 | 47849.1 | 605 | 589 | 144.5 |
| D | 13 | 172 | 69781 | 478.9 | 605 | 589 | 144.5 |
| D | 7 | 223 | 29611 | 200.87 | 605 | 589 | 144.5 |
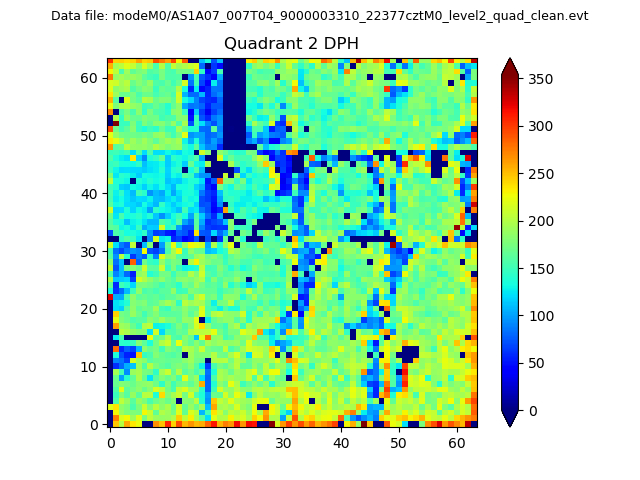
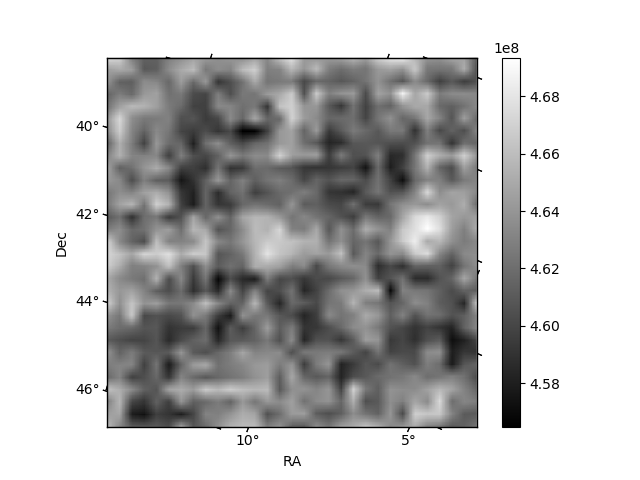
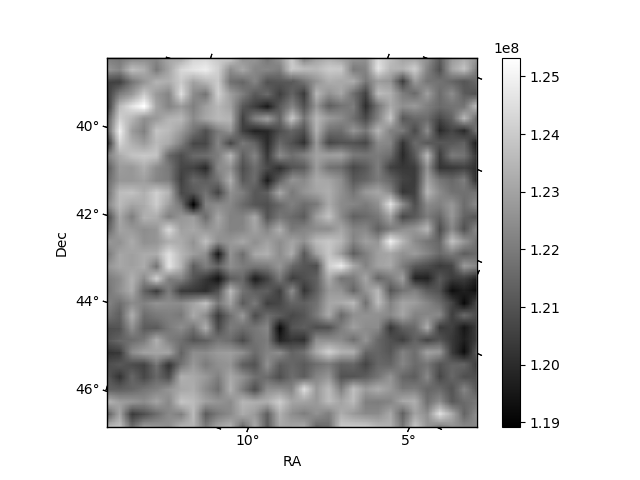
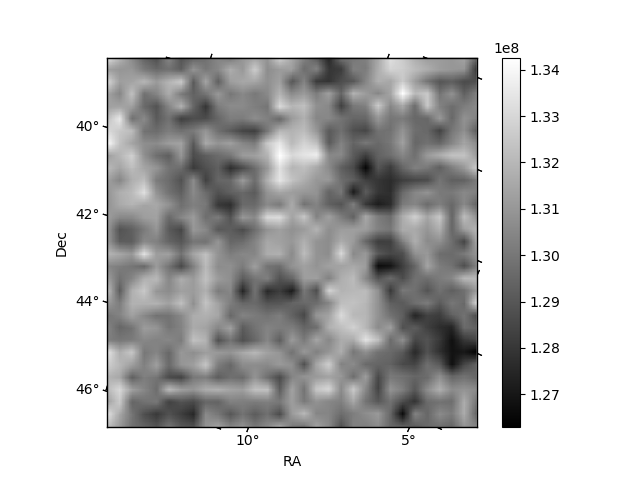
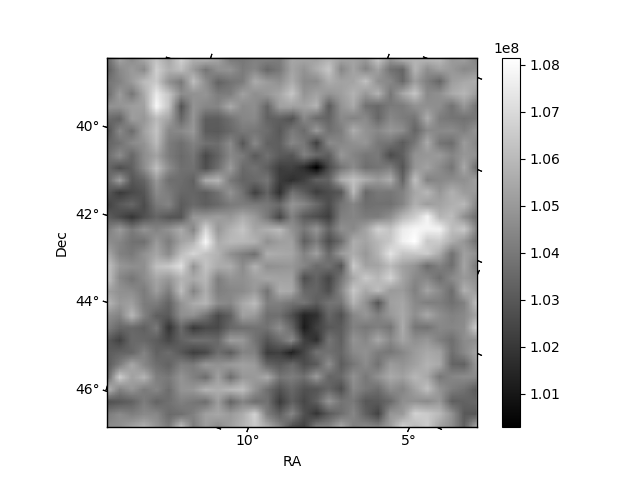
Histogram calculated using DETX and DETY for each event in the final _common_clean file
| Quadrant A | 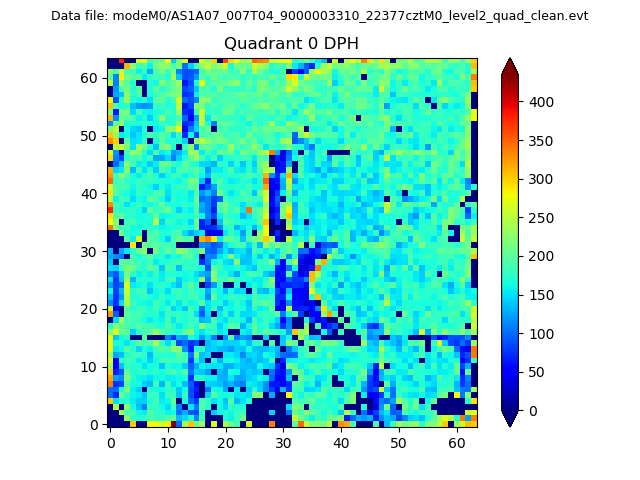 |
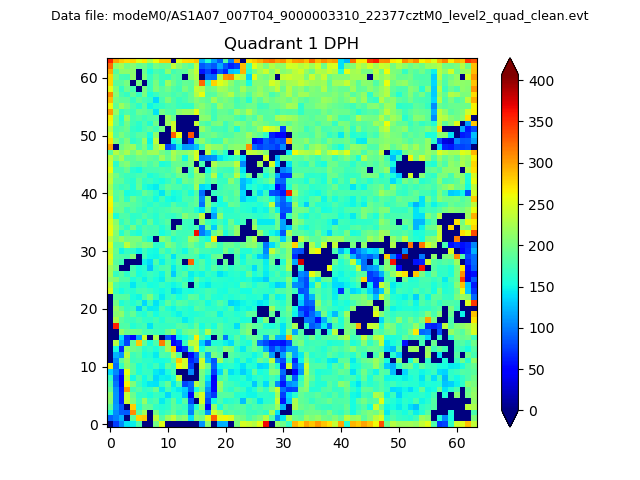 |
Quadrant B |
|---|---|---|---|
| Quadrant D | 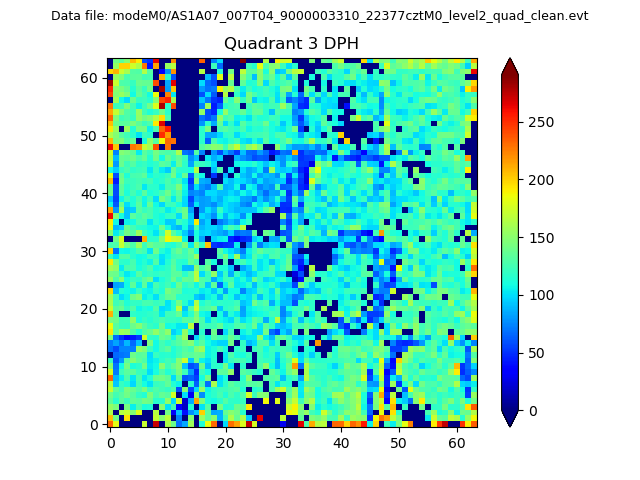 |
 |
Quadrant C |
| Plot type | Count rate plots | Images |
|---|---|---|
| Comparison with Poisson distribution Blue bars denote a histogram of data divided into 1 sec bins. Red curve is a Poisson curve with rate = median count rate of data. |
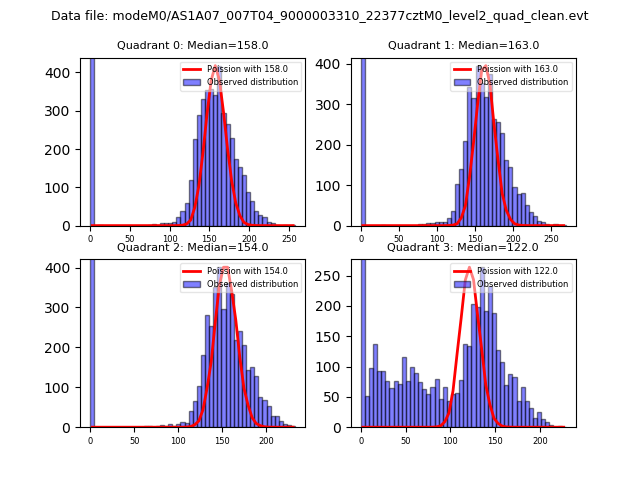 |
 |
| Quadrant-wise count rates Data is divided into 100 sec bins |
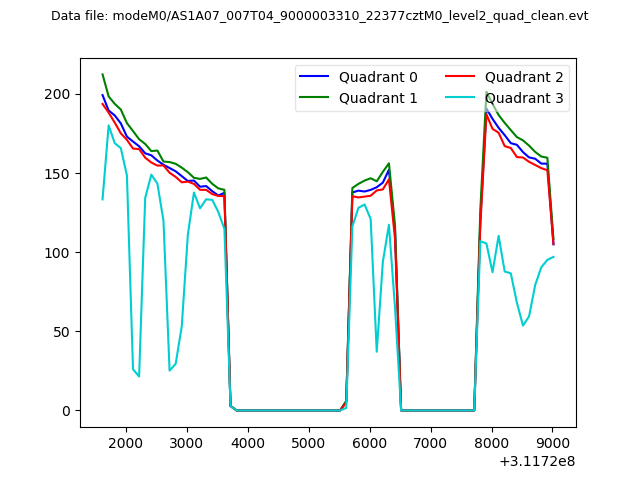 |
|
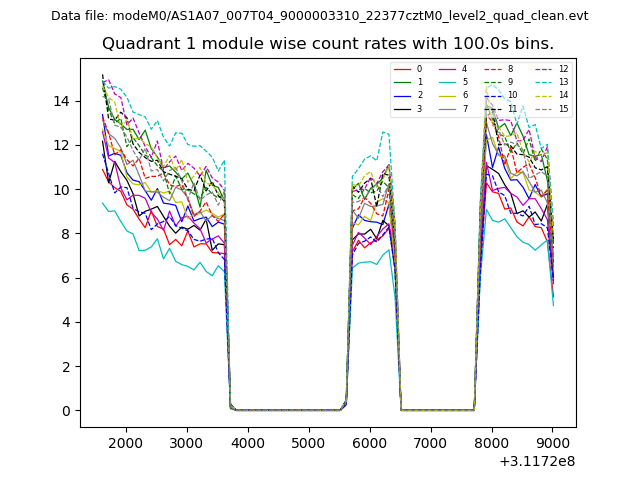
| Module-wise count rates for Quadrant A Data is divided into 100 sec bins |
 |
 |
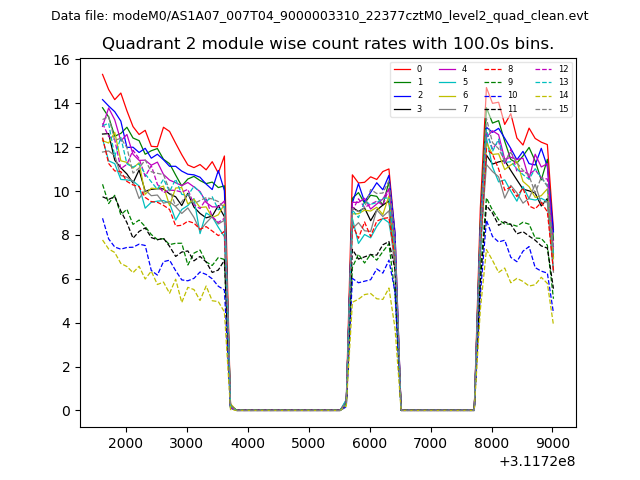
| Module-wise count rates for Quadrant B Data is divided into 100 sec bins |
 |
 |
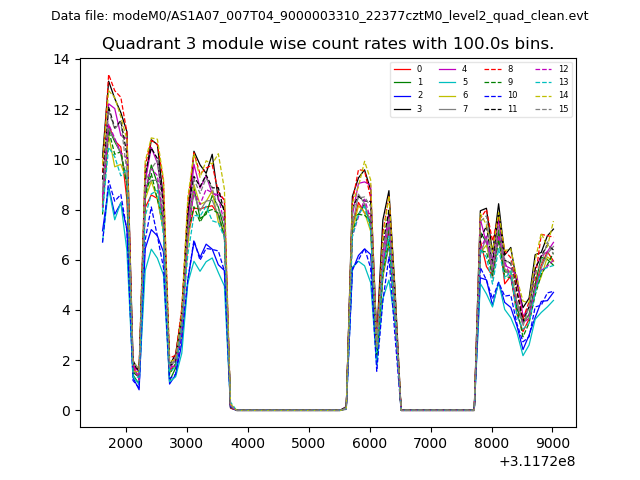
| Module-wise count rates for Quadrant C Data is divided into 100 sec bins |
 |
 |
| Module-wise count rates for Quadrant D Data is divided into 100 sec bins |
 |
 |
| Parameter | Plot |
|---|---|
| CZT HV Monitor | 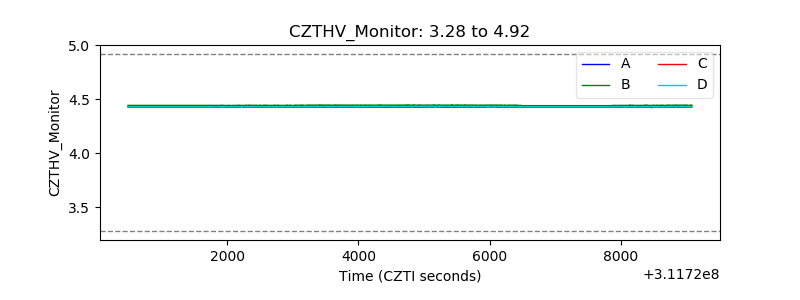 |
| D_VDD | 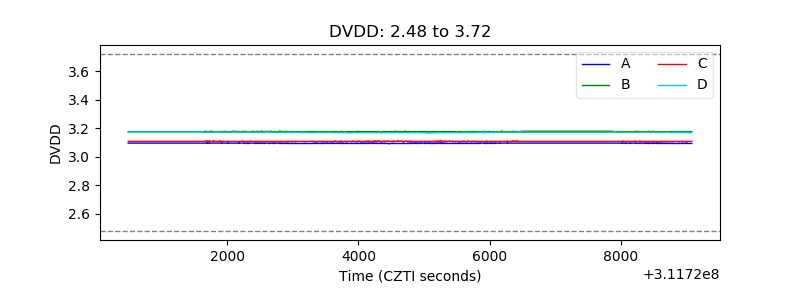 |
| Temperature 1 | 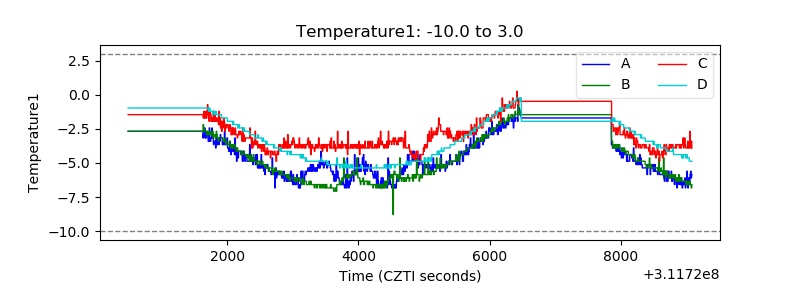 |
| Veto HV Monitor | 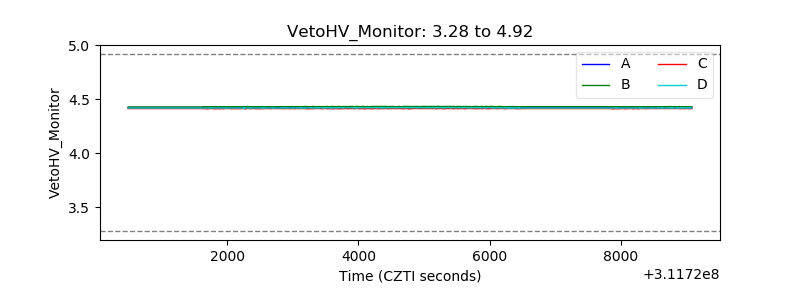 |
| Veto LLD |  |
| Alpha Counter | 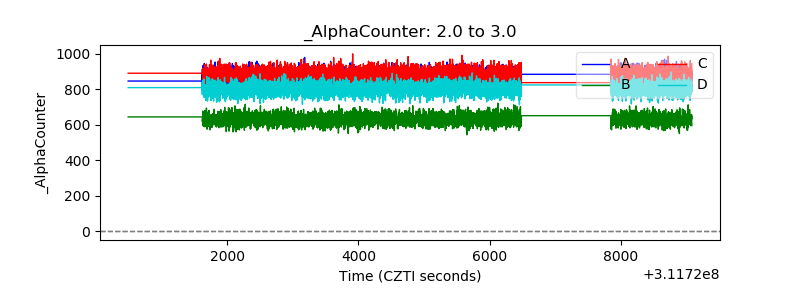 |
| _CPM_Rate | 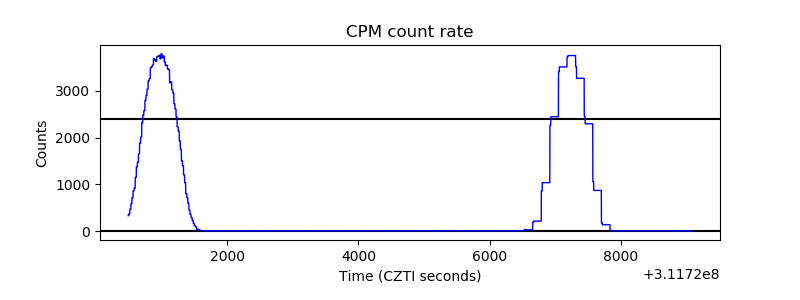 |
| CZT Counter | 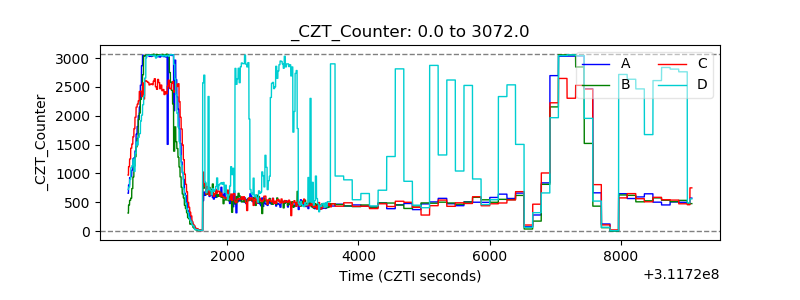 |
| +2.5 Volts monitor |  |
| +5 Volts monitor |  |
| _ROLL_ROT |  |
| _Roll_DEC | 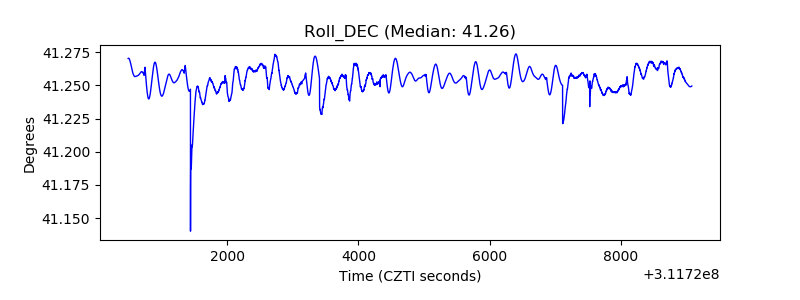 |
| _Roll_RA | 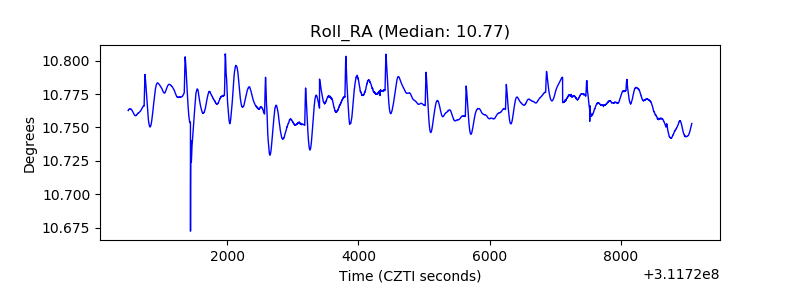 |
| Veto Counter |  |