| Param | Original file | Final file |
|---|---|---|
| Filename | modeM0/AS1A07_007T04_9000003310_22380cztM0_level2.evt | modeM0/AS1A07_007T04_9000003310_22380cztM0_level2_quad_clean.evt |
| Size (bytes) | 472,530,240 | 82,877,760 |
| Size | 450.6 MB | 79.0 MB |
| Events in quadrant A | 3,123,211 | 524,839 |
| Events in quadrant B | 3,260,985 | 538,444 |
| Events in quadrant C | 3,166,253 | 508,790 |
| Events in quadrant D | 4,314,447 | 479,999 |
| Mode M0 | |||
|---|---|---|---|
| Quadrant | BADHDUFLAG | Total packets | Discarded packets |
| A | 0 | 13465 | 2 |
| B | 0 | 13779 | 2 |
| C | 0 | 13530 | 2 |
| D | 0 | 17424 | 2 |
| Mode SS | |||
|---|---|---|---|
| Quadrant | BADHDUFLAG | Total packets | Discarded packets |
| A | 0 | 134 | 0 |
| B | 0 | 134 | 0 |
| C | 0 | 134 | 0 |
| D | 0 | 134 | 0 |
| Mode M9 | |||
|---|---|---|---|
| Quadrant | BADHDUFLAG | Total packets | Discarded packets |
| A | 0 | 17 | 0 |
| B | 0 | 18 | 0 |
| C | 0 | 18 | 0 |
| D | 0 | 18 | 0 |
| Quadrant | Total seconds | Saturated seconds | Saturation percentage |
|---|---|---|---|
| A | 6560 | 35 | 0.533537% |
| B | 6560 | 59 | 0.899390% |
| C | 6560 | 65 | 0.990854% |
| D | 6560 | 249 | 3.795732% |
Noise dominated data is calculated using 1-second bins in cleaned event files. If a bin has >2000 counts, and if more than 50% of those come from <1% of pixels, then it is considered to be noise-dominated and hence unusable.
| Quadrant | # 1 sec bins | Bins with >0 counts | Bins with >2000 counts | High rate bins dominated by noise | Noise dominated (total time) | Noise dominated (detector-on time) | Marked lightcurve |
|---|---|---|---|---|---|---|---|
| A | 7575 | 6561 | 0 | 0 | 0.00% | 0.00% | 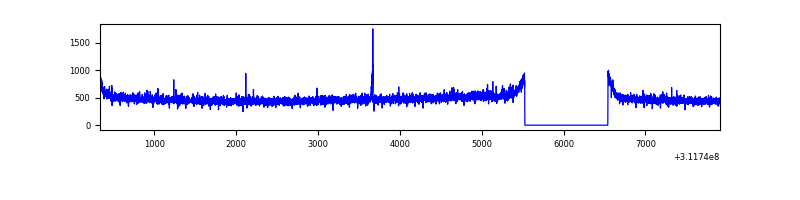 |
| B | 7575 | 6561 | 1 | 1 | 0.01% | 0.02% | 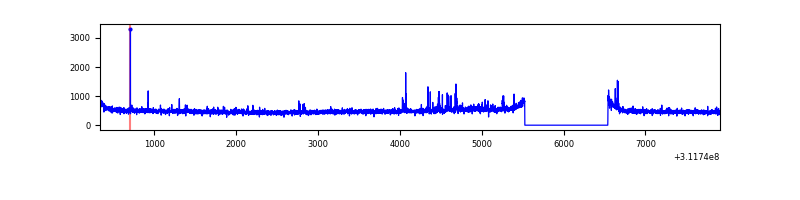 |
| C | 7575 | 6561 | 0 | 0 | 0.00% | 0.00% | 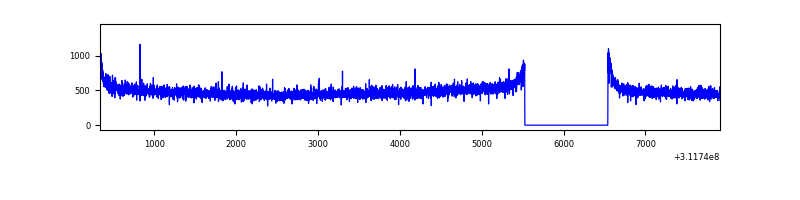 |
| D | 7575 | 6561 | 197 | 197 | 2.60% | 3.00% | 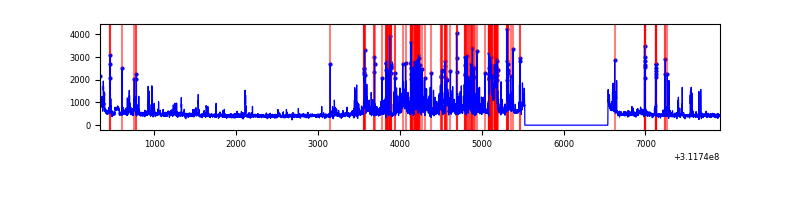 |
Top three noisy pixels from each quadrant. If the there are fewer than three noisy pixels in the level2.evt file, extra rows are filled as -1
| Pixel properties | Quadrant properties | ||||||
|---|---|---|---|---|---|---|---|
| Quadrant | DetID | PixID | Counts | Sigma | Mean | Median | Sigma |
| A | 3 | 1 | 9579 | 54.45 | 807 | 790 | 161.4 |
| A | 13 | 254 | 9578 | 54.45 | 807 | 790 | 161.4 |
| A | 15 | 174 | 7224 | 39.86 | 807 | 790 | 161.4 |
| B | 0 | 190 | 44240 | 285.41 | 810 | 788 | 152.2 |
| B | 12 | 111 | 18242 | 114.64 | 810 | 788 | 152.2 |
| B | 11 | 111 | 16499 | 103.2 | 810 | 788 | 152.2 |
| C | 14 | 238 | 123408 | 677.6 | 778 | 786 | 181.0 |
| C | 0 | 10 | 7003 | 34.35 | 778 | 786 | 181.0 |
| C | 13 | 61 | 5535 | 26.24 | 778 | 786 | 181.0 |
| D | 1 | 52 | 1162154 | 6221.32 | 770 | 749 | 186.7 |
| D | 7 | 38 | 171674 | 915.6 | 770 | 749 | 186.7 |
| D | 13 | 172 | 36892 | 193.61 | 770 | 749 | 186.7 |
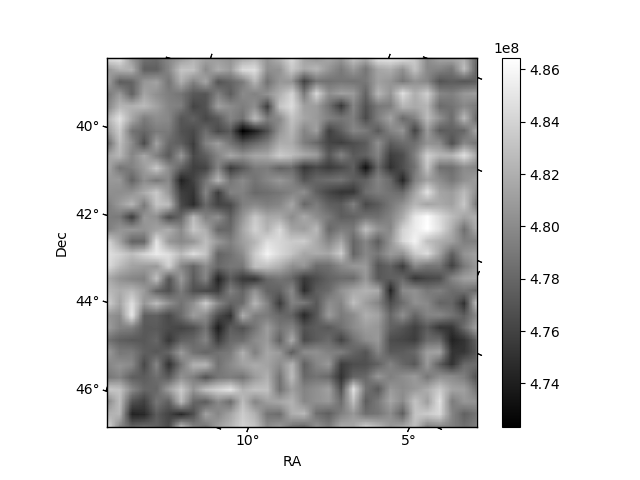
Histogram calculated using DETX and DETY for each event in the final _common_clean file
| Quadrant A | 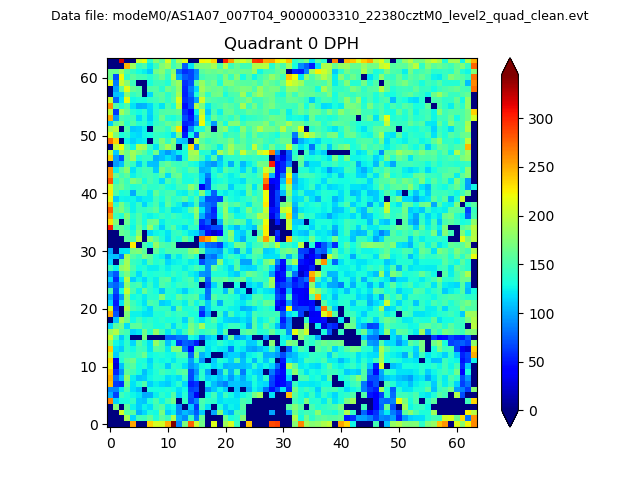 |
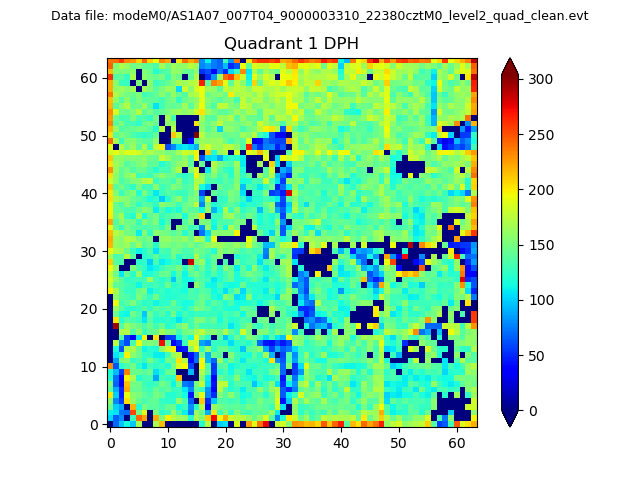 |
Quadrant B |
|---|---|---|---|
| Quadrant D | 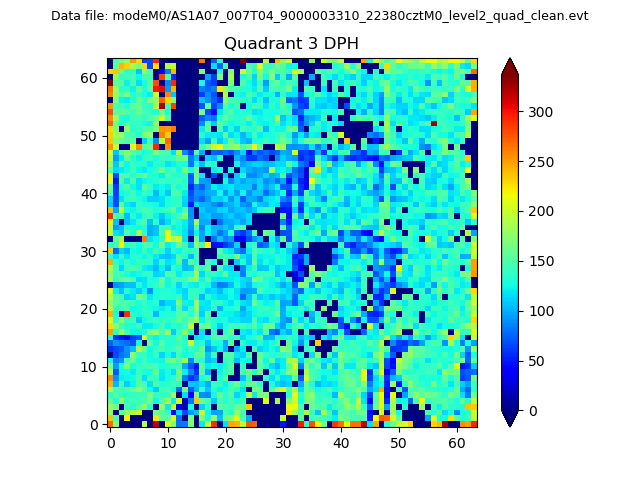 |
 |
Quadrant C |
| Plot type | Count rate plots | Images |
|---|---|---|
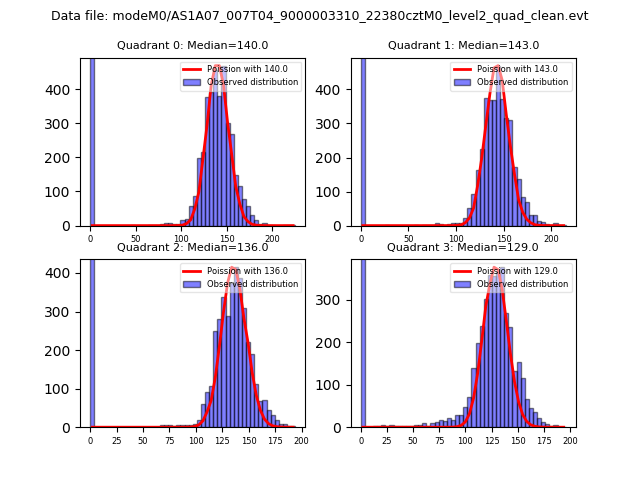
| Comparison with Poisson distribution Blue bars denote a histogram of data divided into 1 sec bins. Red curve is a Poisson curve with rate = median count rate of data. |
 |
 |
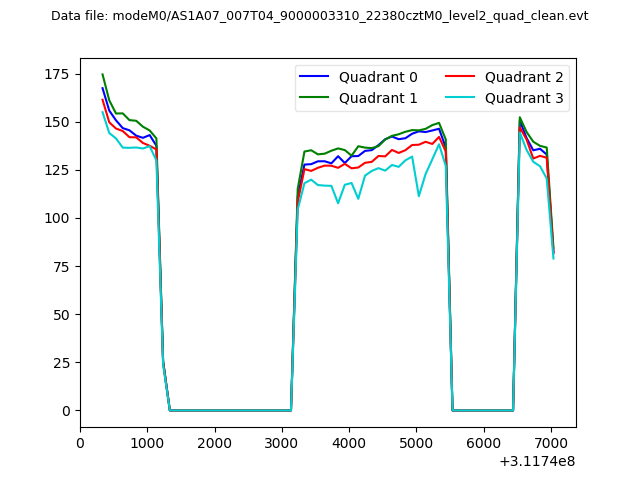
| Quadrant-wise count rates Data is divided into 100 sec bins |
 |
|
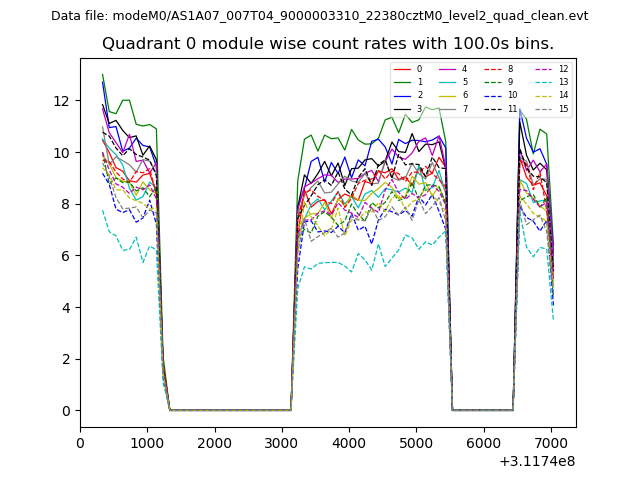
| Module-wise count rates for Quadrant A Data is divided into 100 sec bins |
 |
 |
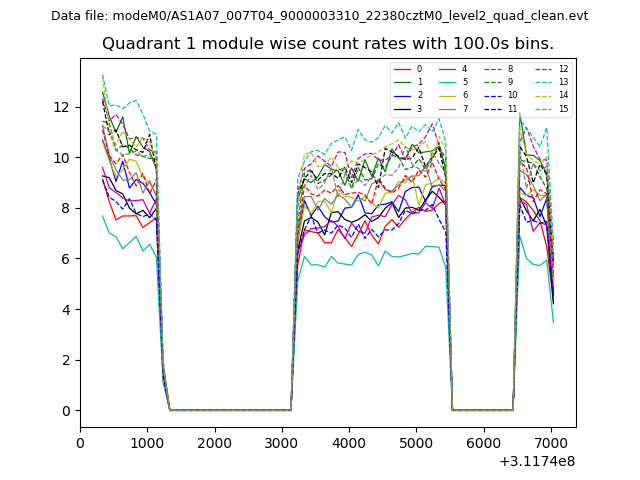
| Module-wise count rates for Quadrant B Data is divided into 100 sec bins |
 |
 |
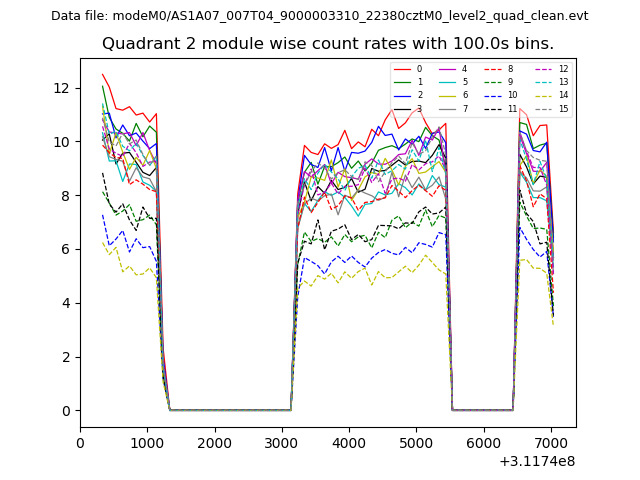
| Module-wise count rates for Quadrant C Data is divided into 100 sec bins |
 |
 |
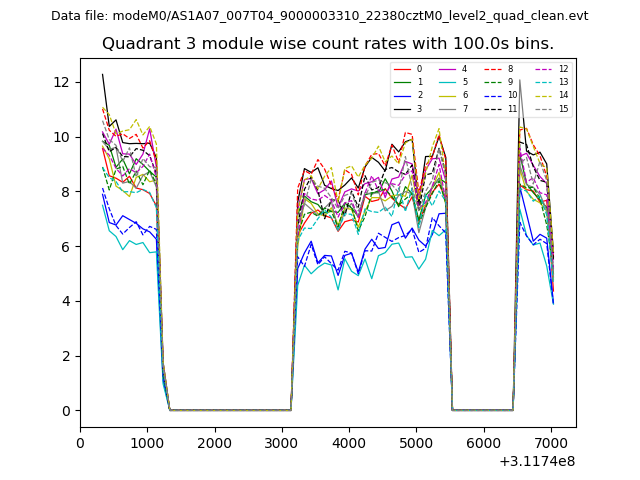
| Module-wise count rates for Quadrant D Data is divided into 100 sec bins |
 |
 |
| Parameter | Plot |
|---|---|
| CZT HV Monitor | 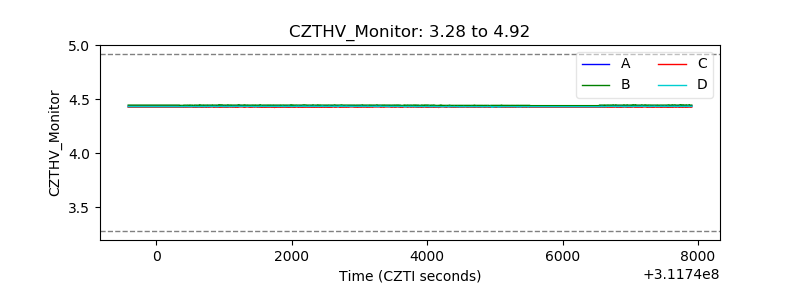 |
| D_VDD | 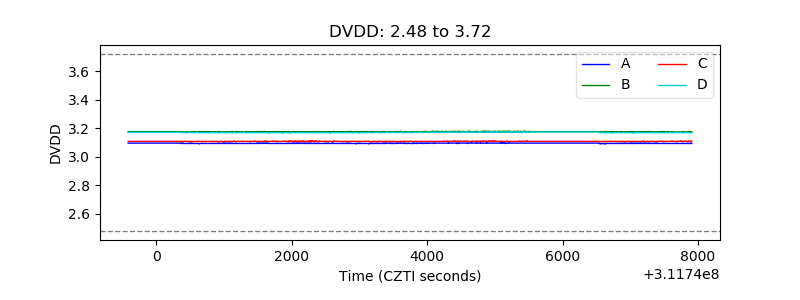 |
| Temperature 1 | 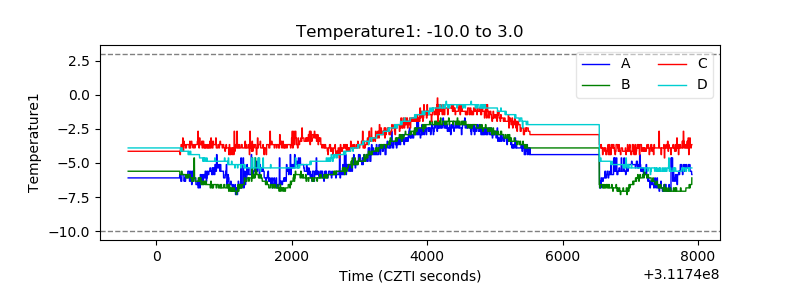 |
| Veto HV Monitor | 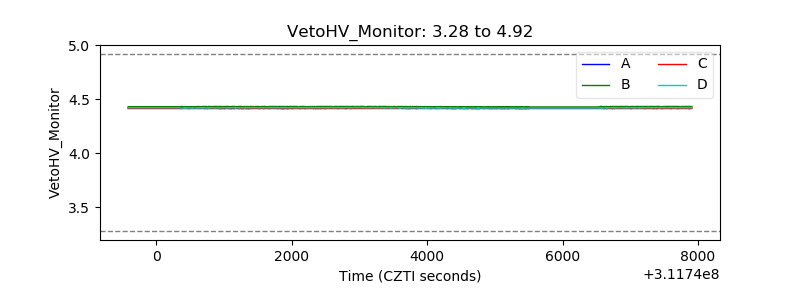 |
| Veto LLD | 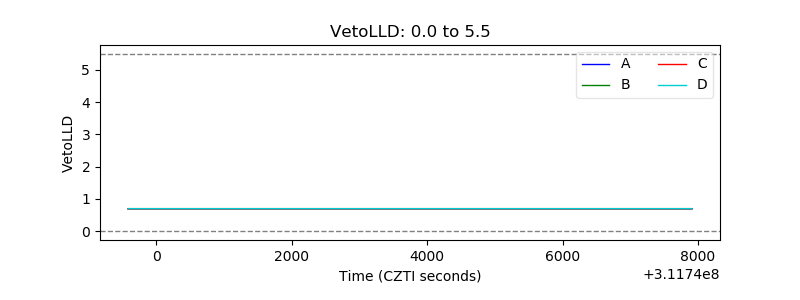 |
| Alpha Counter | 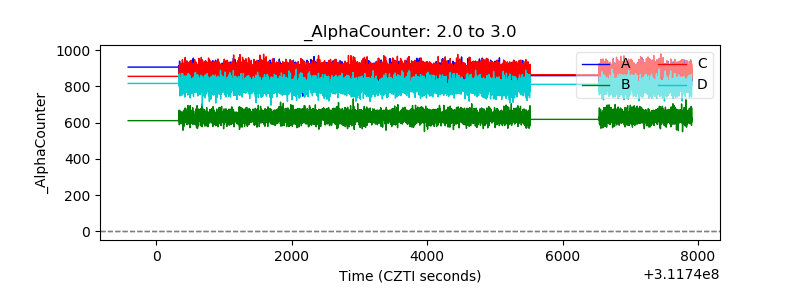 |
| _CPM_Rate | 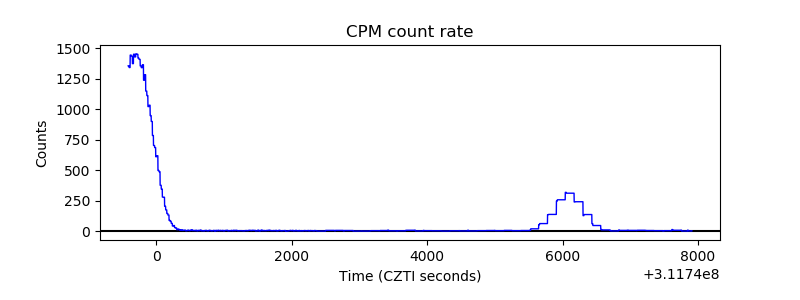 |
| CZT Counter | 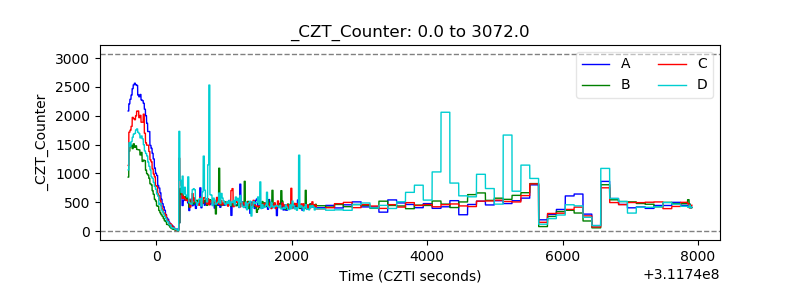 |
| +2.5 Volts monitor |  |
| +5 Volts monitor |  |
| _ROLL_ROT | 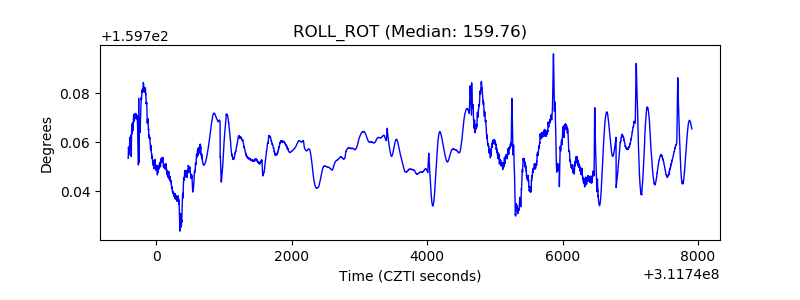 |
| _Roll_DEC | 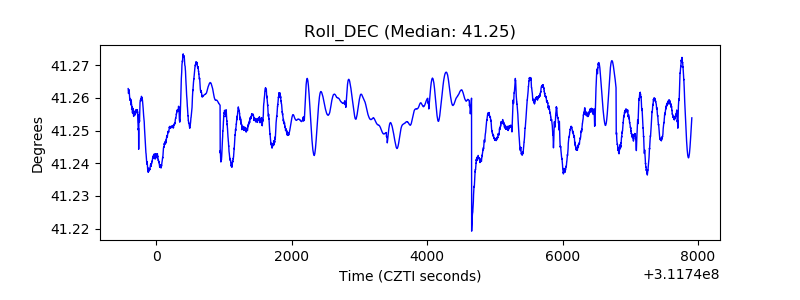 |
| _Roll_RA | 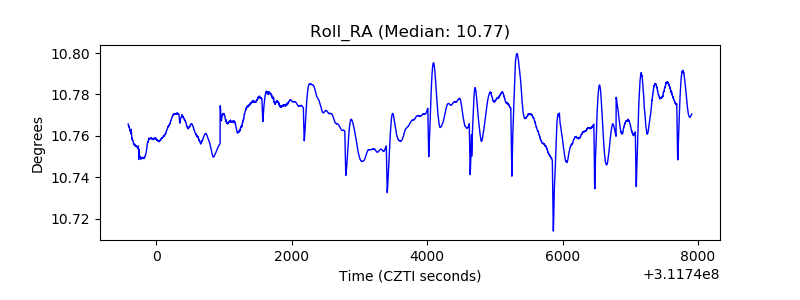 |
| Veto Counter | 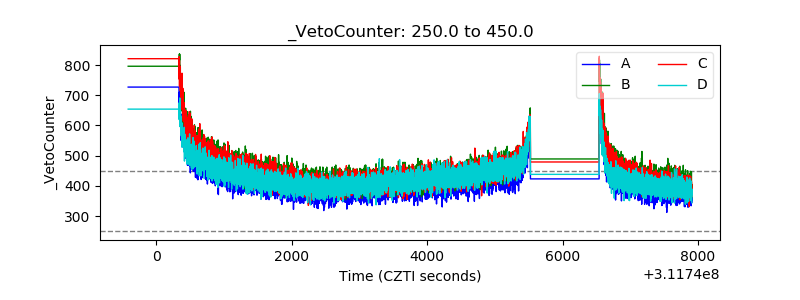 |