| Param | Original file | Final file |
|---|---|---|
| Filename | modeM0/AS1A07_007T04_9000003310_22381cztM0_level2.evt | modeM0/AS1A07_007T04_9000003310_22381cztM0_level2_quad_clean.evt |
| Size (bytes) | 494,657,280 | 83,367,360 |
| Size | 471.7 MB | 79.5 MB |
| Events in quadrant A | 3,435,097 | 513,343 |
| Events in quadrant B | 3,589,829 | 520,029 |
| Events in quadrant C | 3,493,674 | 498,086 |
| Events in quadrant D | 3,962,527 | 481,171 |
| Mode M0 | |||
|---|---|---|---|
| Quadrant | BADHDUFLAG | Total packets | Discarded packets |
| A | 0 | 15068 | 2 |
| B | 0 | 15397 | 2 |
| C | 0 | 15138 | 2 |
| D | 0 | 16941 | 2 |
| Mode SS | |||
|---|---|---|---|
| Quadrant | BADHDUFLAG | Total packets | Discarded packets |
| A | 0 | 148 | 0 |
| B | 0 | 148 | 0 |
| C | 0 | 148 | 0 |
| D | 0 | 148 | 0 |
| Mode M9 | |||
|---|---|---|---|
| Quadrant | BADHDUFLAG | Total packets | Discarded packets |
| A | 0 | 6 | 0 |
| B | 0 | 6 | 0 |
| C | 0 | 6 | 0 |
| D | 0 | 6 | 0 |
| Quadrant | Total seconds | Saturated seconds | Saturation percentage |
|---|---|---|---|
| A | 7355 | 69 | 0.938137% |
| B | 7356 | 118 | 1.604133% |
| C | 7356 | 122 | 1.658510% |
| D | 7356 | 128 | 1.740076% |
Noise dominated data is calculated using 1-second bins in cleaned event files. If a bin has >2000 counts, and if more than 50% of those come from <1% of pixels, then it is considered to be noise-dominated and hence unusable.
| Quadrant | # 1 sec bins | Bins with >0 counts | Bins with >2000 counts | High rate bins dominated by noise | Noise dominated (total time) | Noise dominated (detector-on time) | Marked lightcurve |
|---|---|---|---|---|---|---|---|
| A | 7920 | 7356 | 0 | 0 | 0.00% | 0.00% | 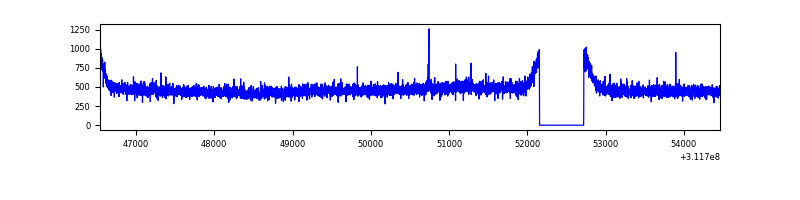 |
| B | 7921 | 7357 | 1 | 1 | 0.01% | 0.01% | 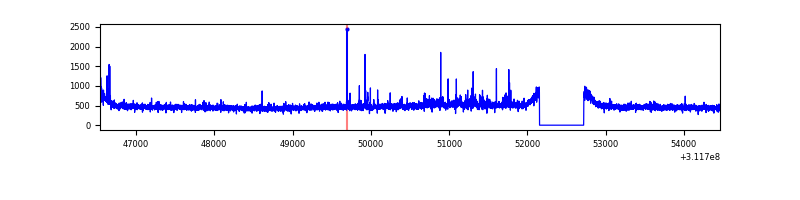 |
| C | 7921 | 7357 | 0 | 0 | 0.00% | 0.00% |  |
| D | 7921 | 7357 | 77 | 77 | 0.97% | 1.05% | 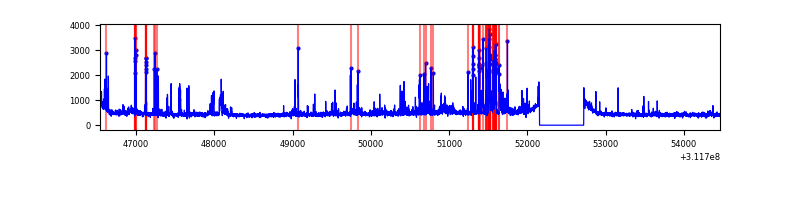 |
Top three noisy pixels from each quadrant. If the there are fewer than three noisy pixels in the level2.evt file, extra rows are filled as -1
| Pixel properties | Quadrant properties | ||||||
|---|---|---|---|---|---|---|---|
| Quadrant | DetID | PixID | Counts | Sigma | Mean | Median | Sigma |
| A | 13 | 254 | 10523 | 53.79 | 888 | 868 | 179.5 |
| A | 13 | 170 | 9725 | 49.35 | 888 | 868 | 179.5 |
| A | 0 | 226 | 7787 | 38.55 | 888 | 868 | 179.5 |
| B | 0 | 245 | 55274 | 322.32 | 890 | 866 | 168.8 |
| B | 0 | 190 | 22929 | 130.7 | 890 | 866 | 168.8 |
| B | 12 | 111 | 20710 | 117.56 | 890 | 866 | 168.8 |
| C | 14 | 238 | 135669 | 670.2 | 859 | 863 | 201.1 |
| C | 13 | 61 | 6135 | 26.21 | 859 | 863 | 201.1 |
| C | 10 | 22 | 5653 | 23.81 | 859 | 863 | 201.1 |
| D | 1 | 52 | 648932 | 3078.83 | 862 | 836 | 210.5 |
| D | 2 | 234 | 30437 | 140.62 | 862 | 836 | 210.5 |
| D | 13 | 172 | 24524 | 112.53 | 862 | 836 | 210.5 |
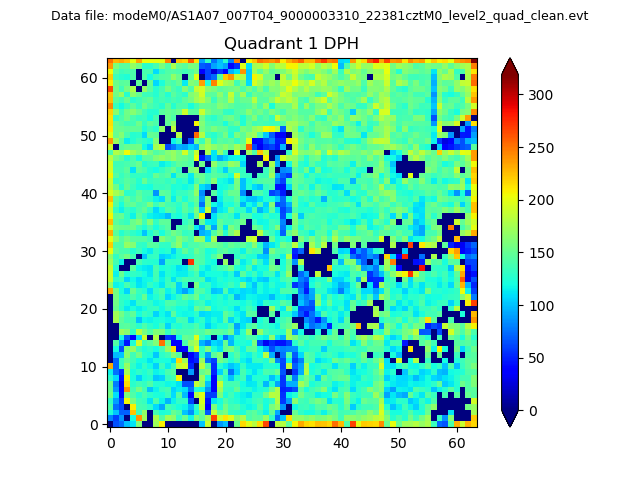
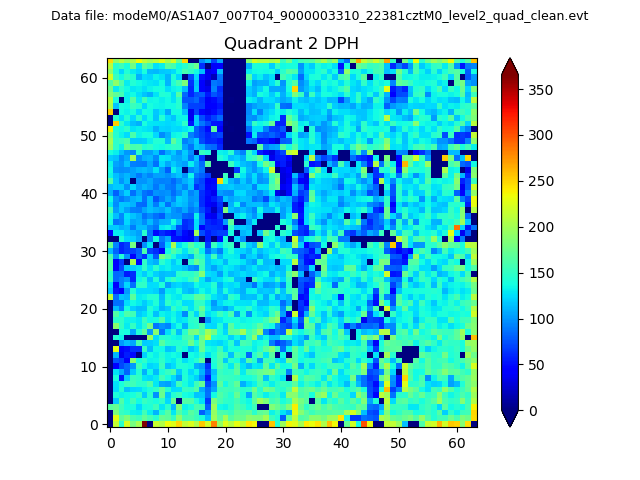
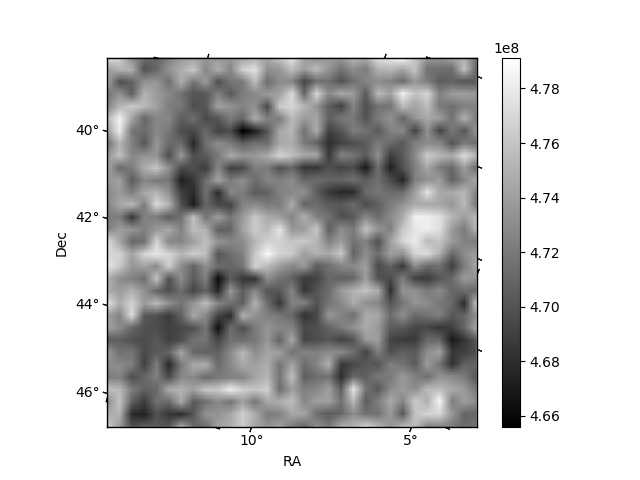
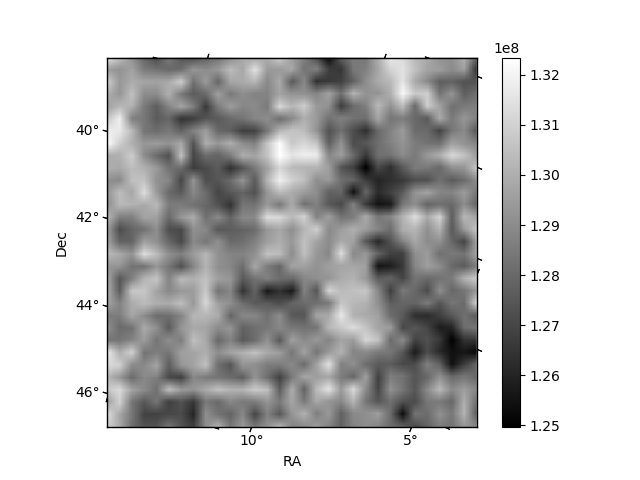
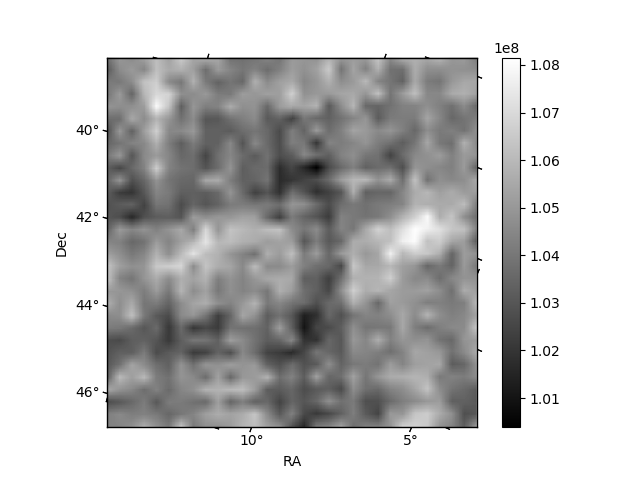
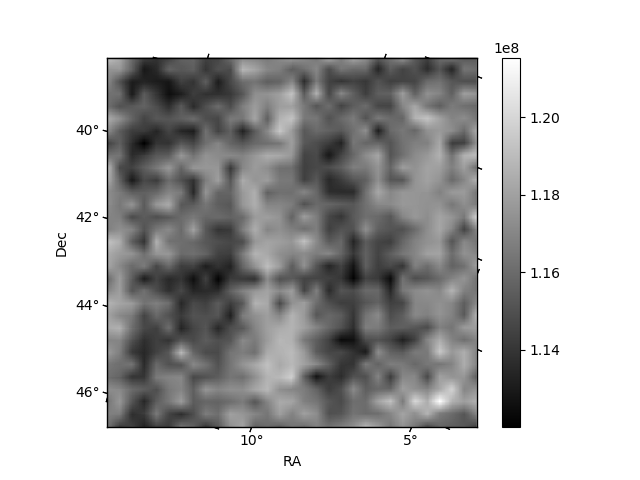
Histogram calculated using DETX and DETY for each event in the final _common_clean file
| Quadrant A | 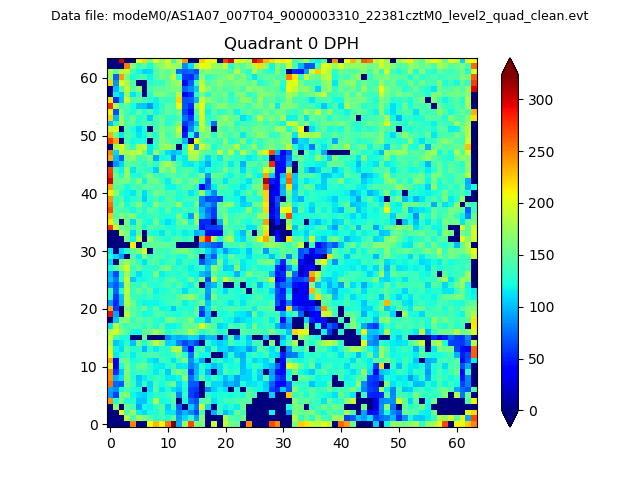 |
 |
Quadrant B |
|---|---|---|---|
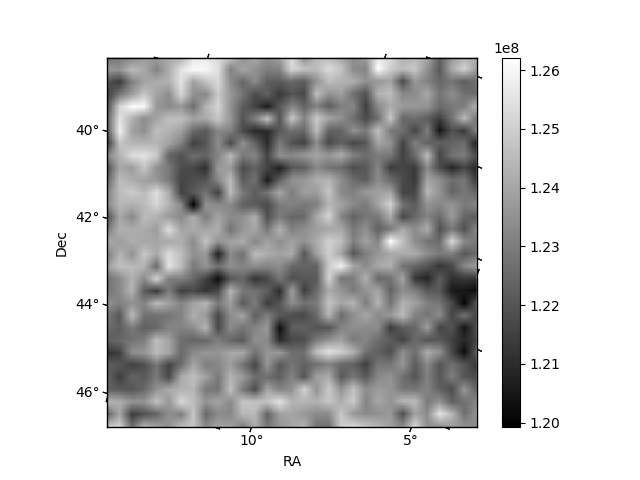
| Quadrant D | 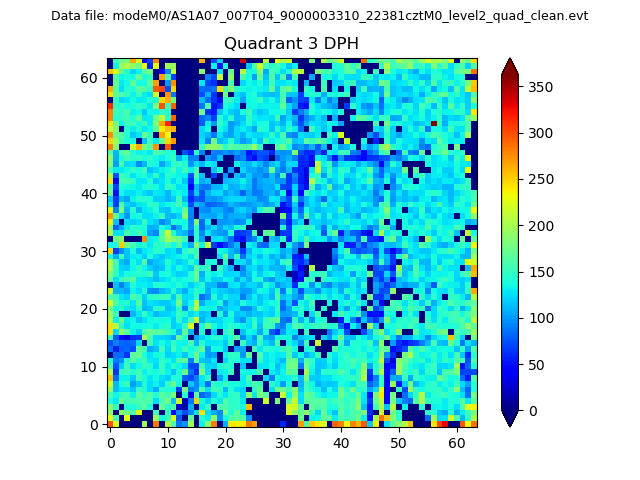 |
 |
Quadrant C |
| Plot type | Count rate plots | Images |
|---|---|---|
| Comparison with Poisson distribution Blue bars denote a histogram of data divided into 1 sec bins. Red curve is a Poisson curve with rate = median count rate of data. |
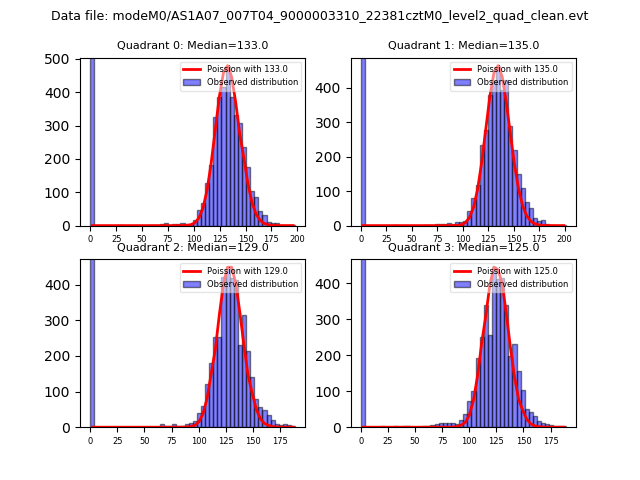 |
 |
| Quadrant-wise count rates Data is divided into 100 sec bins |
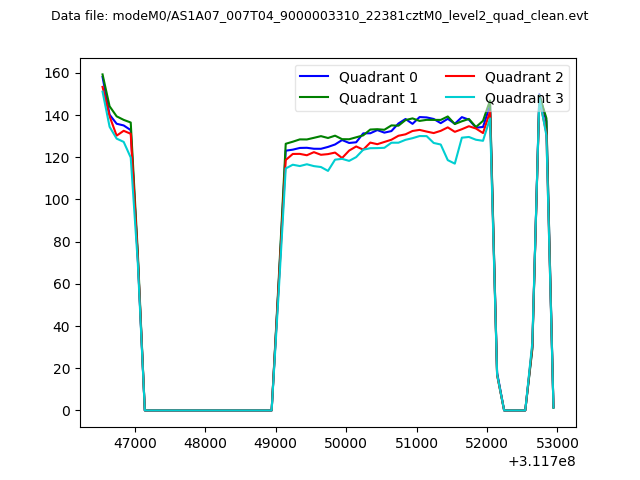 |
|
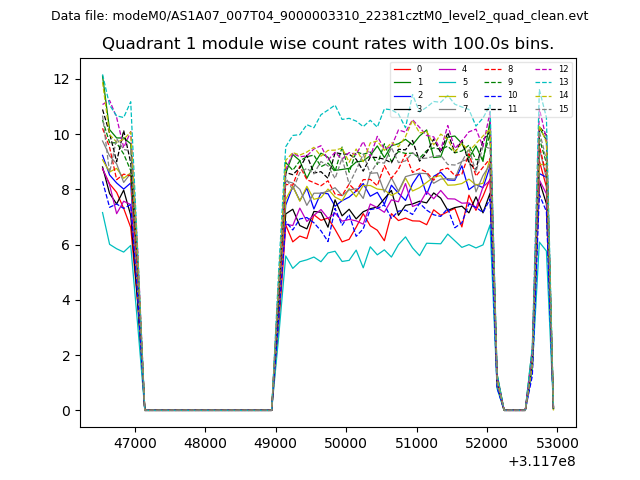
| Module-wise count rates for Quadrant A Data is divided into 100 sec bins |
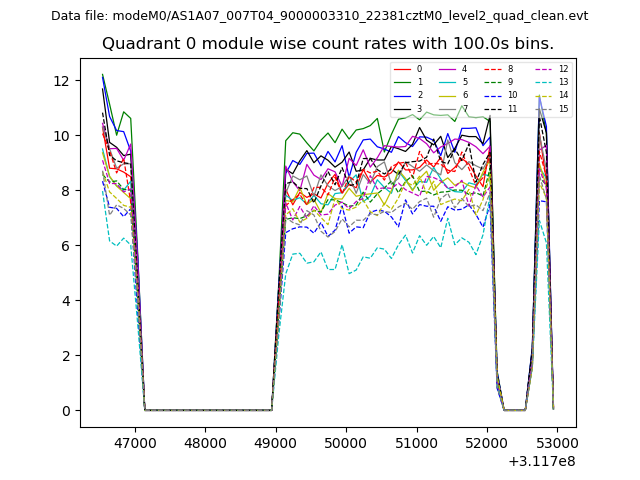 |
 |
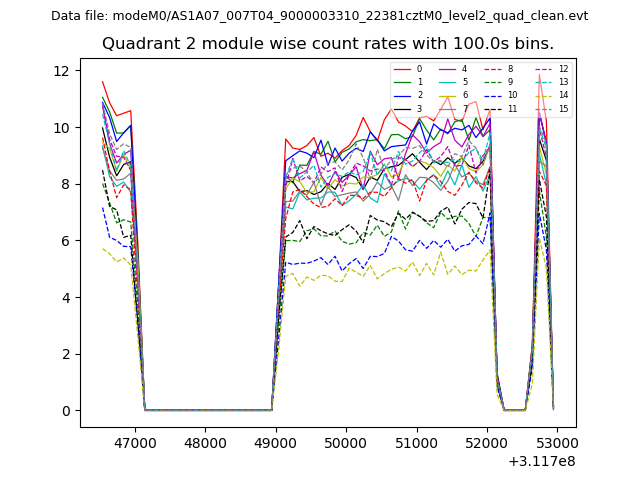
| Module-wise count rates for Quadrant B Data is divided into 100 sec bins |
 |
 |
| Module-wise count rates for Quadrant C Data is divided into 100 sec bins |
 |
 |
| Module-wise count rates for Quadrant D Data is divided into 100 sec bins |
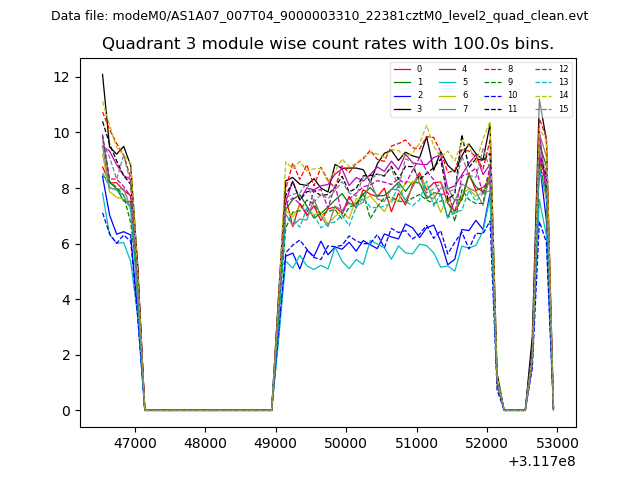 |
 |
| Parameter | Plot |
|---|---|
| CZT HV Monitor | 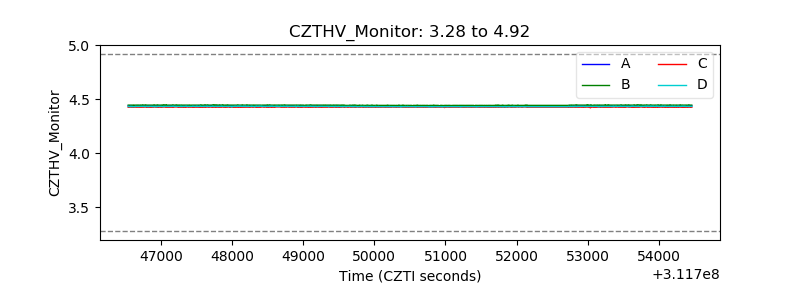 |
| D_VDD | 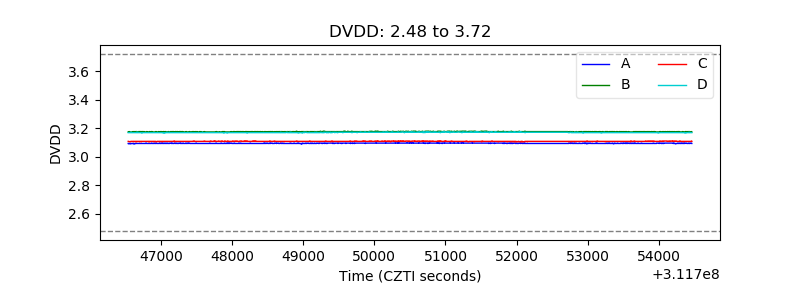 |
| Temperature 1 | 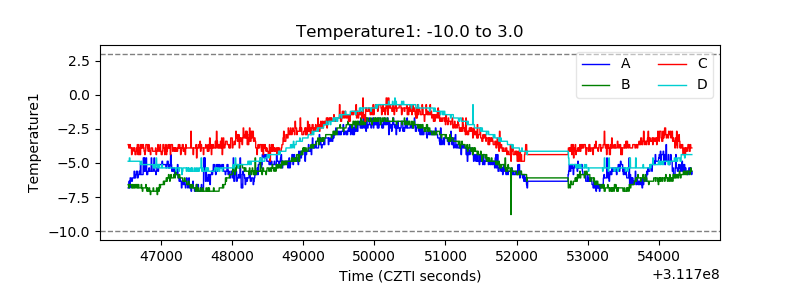 |
| Veto HV Monitor |  |
| Veto LLD | 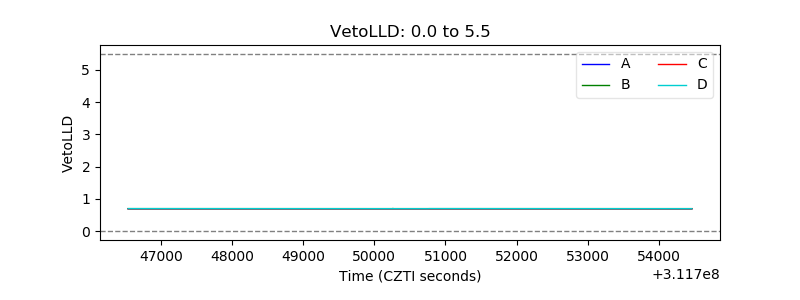 |
| Alpha Counter | 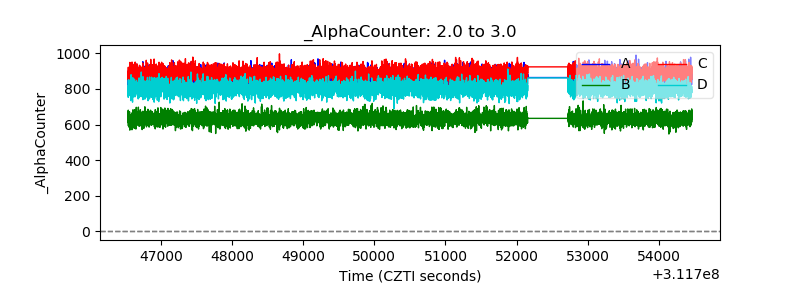 |
| _CPM_Rate | 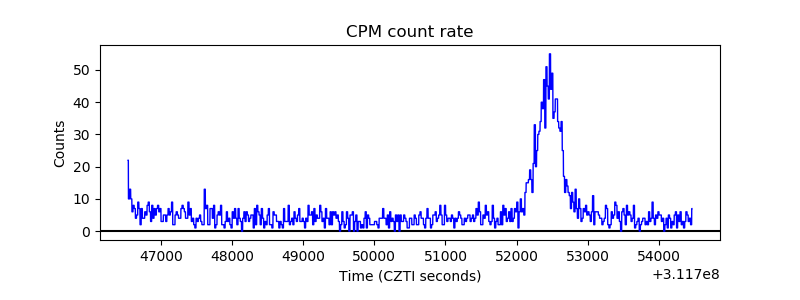 |
| CZT Counter | 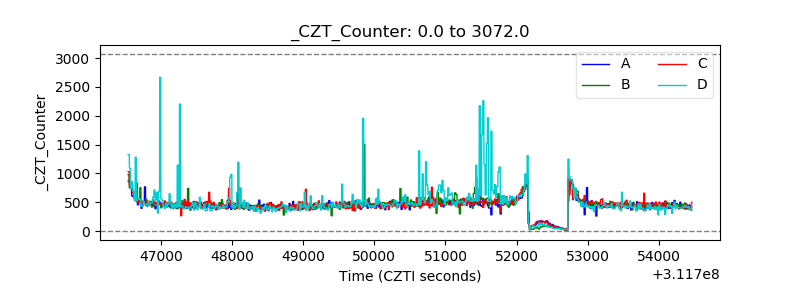 |
| +2.5 Volts monitor |  |
| +5 Volts monitor |  |
| _ROLL_ROT | 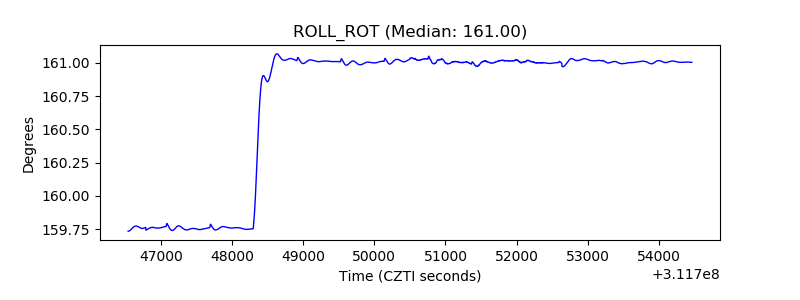 |
| _Roll_DEC | 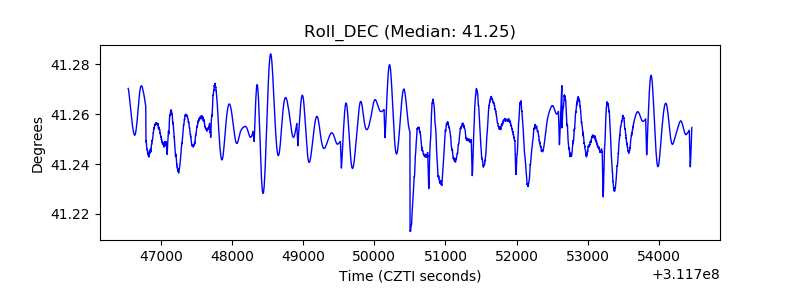 |
| _Roll_RA | 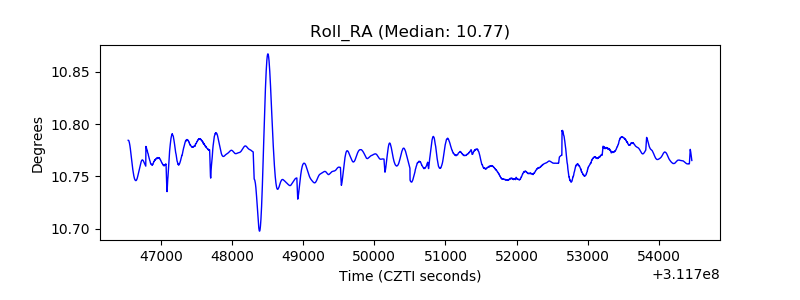 |
| Veto Counter | 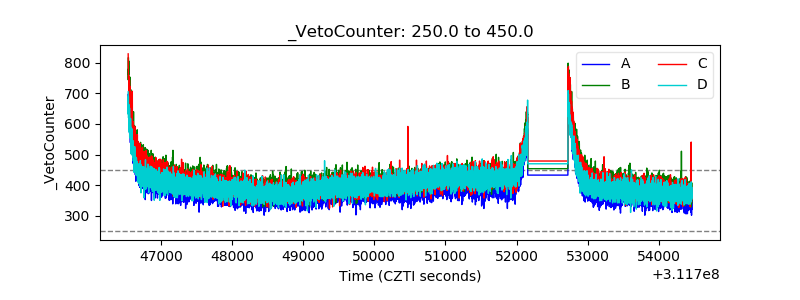 |