| Param | Original file | Final file |
|---|---|---|
| Filename | modeM0/AS1A07_007T04_9000003310_22387cztM0_level2.evt | modeM0/AS1A07_007T04_9000003310_22387cztM0_level2_quad_clean.evt |
| Size (bytes) | 443,010,240 | 91,566,720 |
| Size | 422.5 MB | 87.3 MB |
| Events in quadrant A | 2,875,335 | 602,920 |
| Events in quadrant B | 2,995,007 | 602,908 |
| Events in quadrant C | 2,905,032 | 578,607 |
| Events in quadrant D | 4,220,531 | 556,504 |
| Mode M0 | |||
|---|---|---|---|
| Quadrant | BADHDUFLAG | Total packets | Discarded packets |
| A | 0 | 12739 | 1 |
| B | 0 | 12972 | 1 |
| C | 0 | 12677 | 1 |
| D | 0 | 16799 | 1 |
| Mode SS | |||
|---|---|---|---|
| Quadrant | BADHDUFLAG | Total packets | Discarded packets |
| A | 0 | 126 | 0 |
| B | 0 | 126 | 0 |
| C | 0 | 126 | 0 |
| D | 0 | 126 | 0 |
| Mode M9 | |||
|---|---|---|---|
| Quadrant | BADHDUFLAG | Total packets | Discarded packets |
| A | 0 | 9 | 0 |
| B | 0 | 9 | 0 |
| C | 0 | 9 | 0 |
| D | 0 | 9 | 0 |
| Quadrant | Total seconds | Saturated seconds | Saturation percentage |
|---|---|---|---|
| A | 6187 | 38 | 0.614191% |
| B | 6188 | 53 | 0.856496% |
| C | 6188 | 76 | 1.228184% |
| D | 6188 | 321 | 5.187460% |
Noise dominated data is calculated using 1-second bins in cleaned event files. If a bin has >2000 counts, and if more than 50% of those come from <1% of pixels, then it is considered to be noise-dominated and hence unusable.
| Quadrant | # 1 sec bins | Bins with >0 counts | Bins with >2000 counts | High rate bins dominated by noise | Noise dominated (total time) | Noise dominated (detector-on time) | Marked lightcurve |
|---|---|---|---|---|---|---|---|
| A | 7152 | 6188 | 0 | 0 | 0.00% | 0.00% | 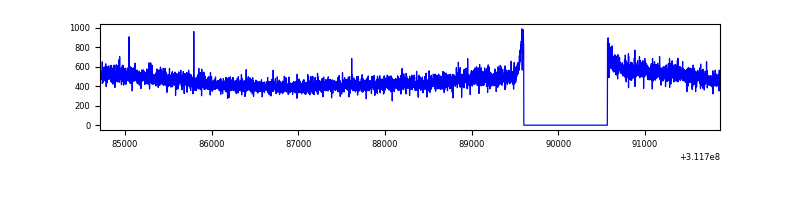 |
| B | 7153 | 6188 | 1 | 1 | 0.01% | 0.02% | 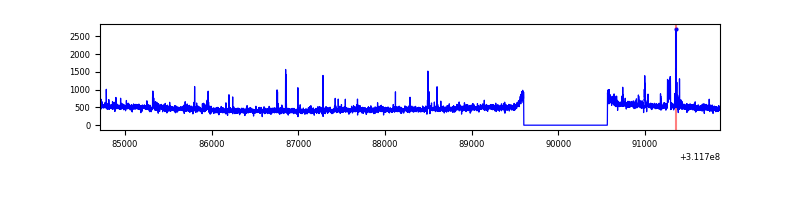 |
| C | 7153 | 6189 | 0 | 0 | 0.00% | 0.00% | 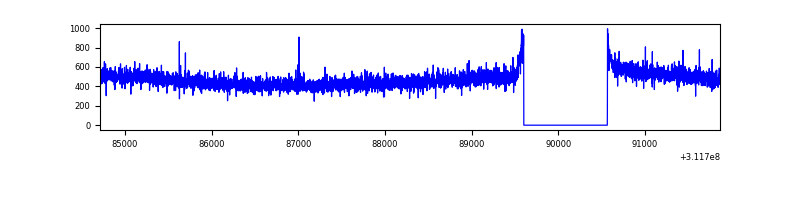 |
| D | 7153 | 6188 | 275 | 275 | 3.84% | 4.44% | 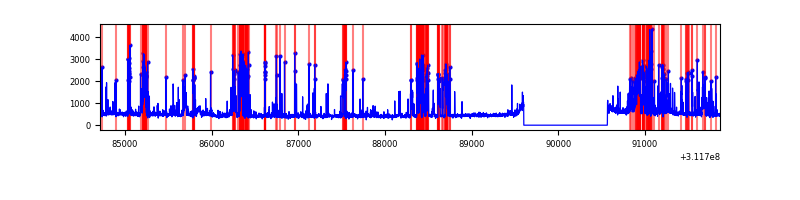 |
Top three noisy pixels from each quadrant. If the there are fewer than three noisy pixels in the level2.evt file, extra rows are filled as -1
| Pixel properties | Quadrant properties | ||||||
|---|---|---|---|---|---|---|---|
| Quadrant | DetID | PixID | Counts | Sigma | Mean | Median | Sigma |
| A | 13 | 254 | 8692 | 52.59 | 745 | 727 | 151.4 |
| A | 3 | 137 | 6464 | 37.88 | 745 | 727 | 151.4 |
| A | 0 | 226 | 6432 | 37.67 | 745 | 727 | 151.4 |
| B | 0 | 190 | 44552 | 310.85 | 740 | 721 | 141.0 |
| B | 0 | 228 | 22691 | 155.81 | 740 | 721 | 141.0 |
| B | 12 | 111 | 16847 | 114.37 | 740 | 721 | 141.0 |
| C | 14 | 238 | 113254 | 668.68 | 715 | 718 | 168.3 |
| C | 13 | 61 | 5045 | 25.71 | 715 | 718 | 168.3 |
| C | 10 | 22 | 4092 | 20.05 | 715 | 718 | 168.3 |
| D | 1 | 52 | 1290621 | 7404.45 | 720 | 700 | 174.2 |
| D | 7 | 38 | 58909 | 334.13 | 720 | 700 | 174.2 |
| D | 12 | 227 | 57910 | 328.4 | 720 | 700 | 174.2 |
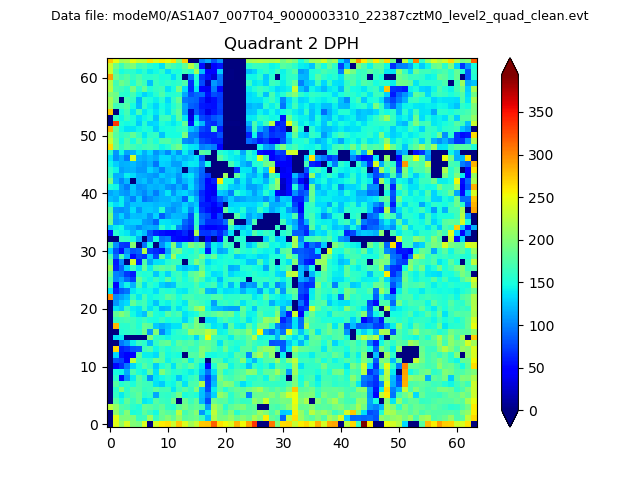
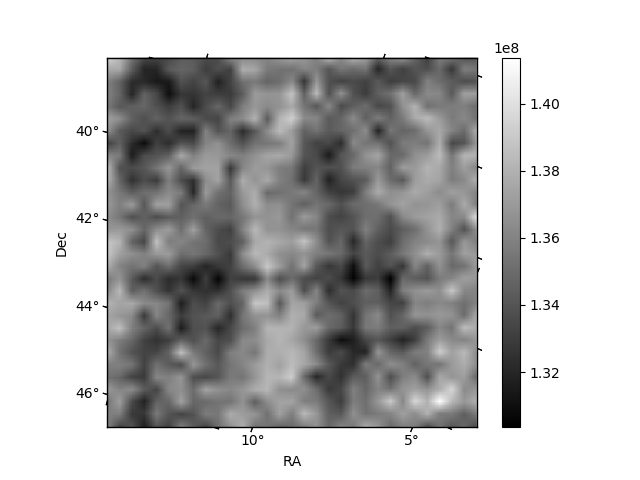
Histogram calculated using DETX and DETY for each event in the final _common_clean file
| Quadrant A |  |
 |
Quadrant B |
|---|---|---|---|
| Quadrant D | 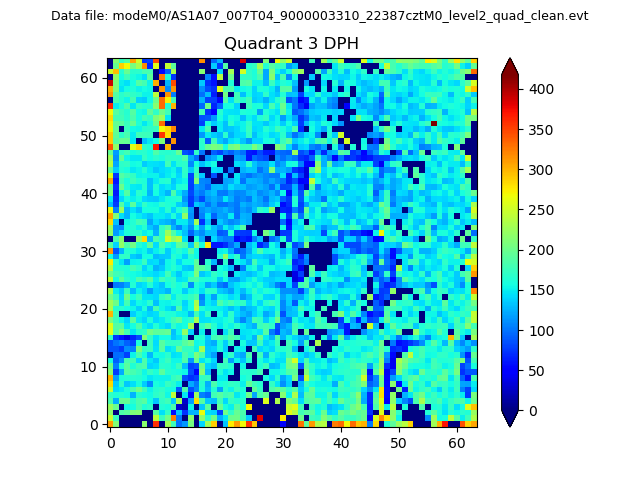 |
 |
Quadrant C |
| Plot type | Count rate plots | Images |
|---|---|---|
| Comparison with Poisson distribution Blue bars denote a histogram of data divided into 1 sec bins. Red curve is a Poisson curve with rate = median count rate of data. |
 |
 |
| Quadrant-wise count rates Data is divided into 100 sec bins |
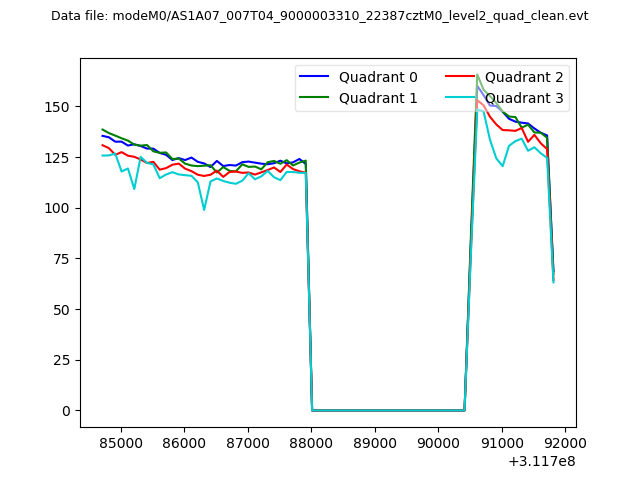 |
|
| Module-wise count rates for Quadrant A Data is divided into 100 sec bins |
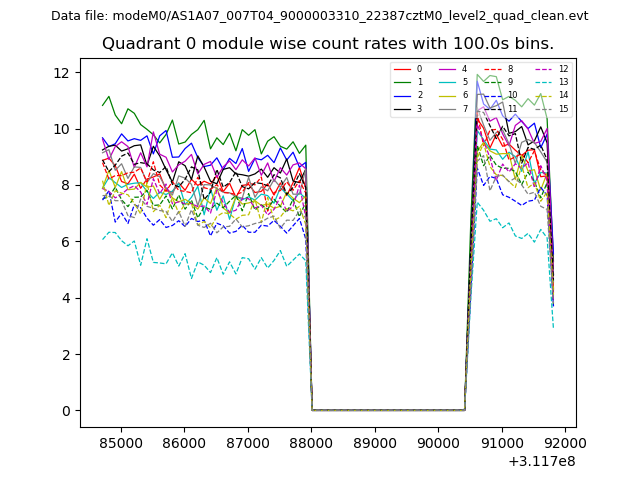 |
 |
| Module-wise count rates for Quadrant B Data is divided into 100 sec bins |
 |
 |
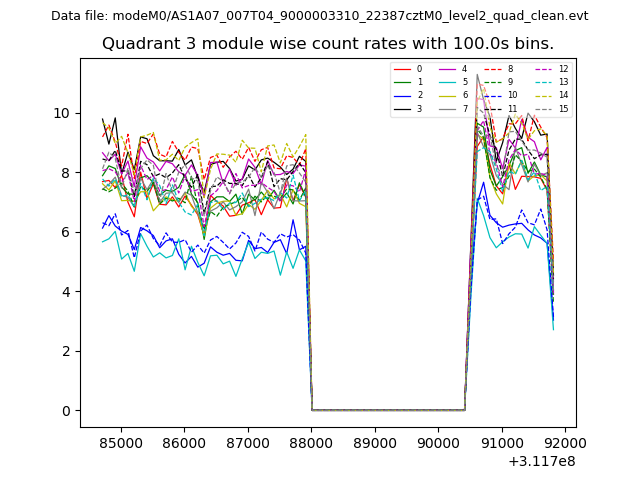
| Module-wise count rates for Quadrant C Data is divided into 100 sec bins |
 |
 |
| Module-wise count rates for Quadrant D Data is divided into 100 sec bins |
 |
 |
| Parameter | Plot |
|---|---|
| CZT HV Monitor |  |
| D_VDD | 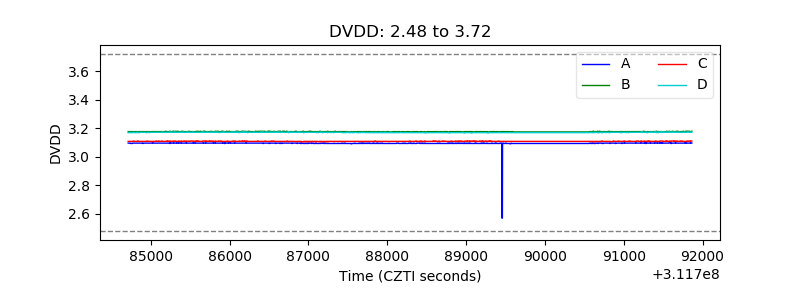 |
| Temperature 1 | 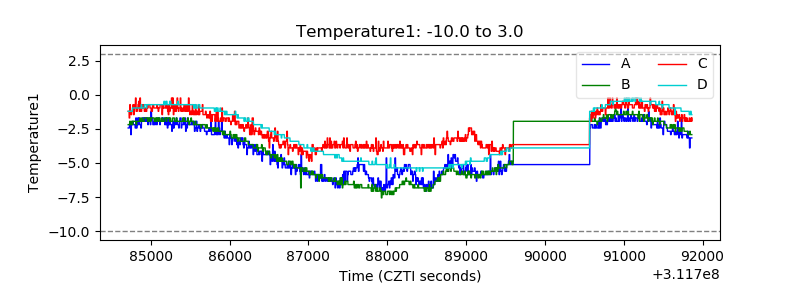 |
| Veto HV Monitor | 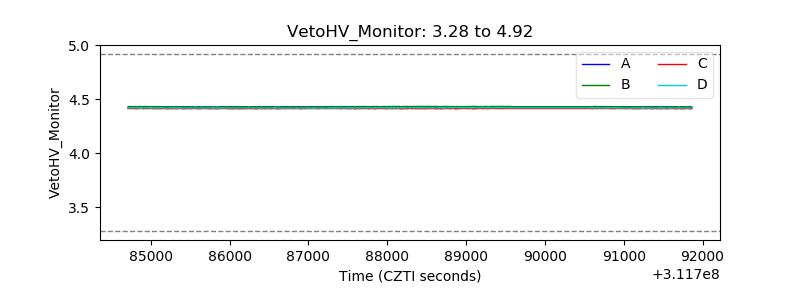 |
| Veto LLD | 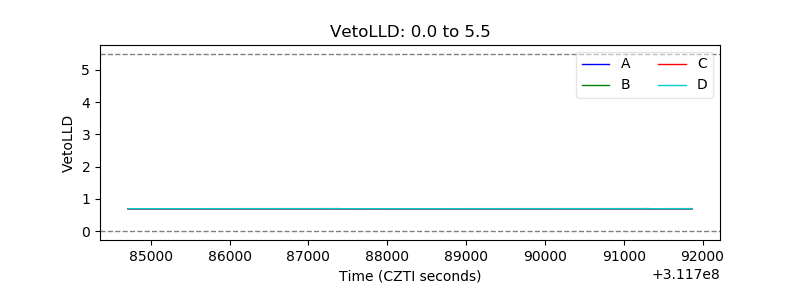 |
| Alpha Counter | 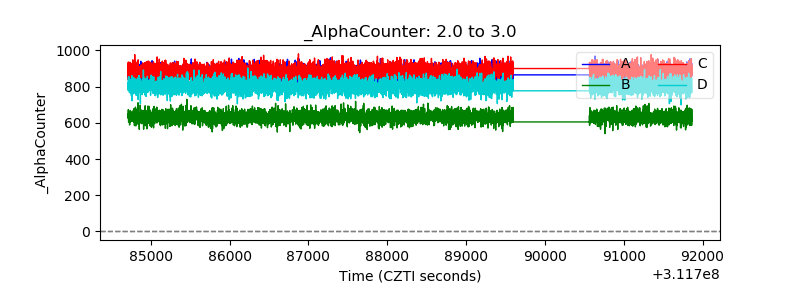 |
| _CPM_Rate | 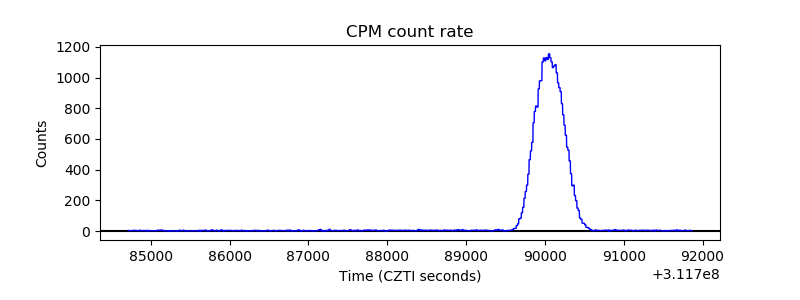 |
| CZT Counter | 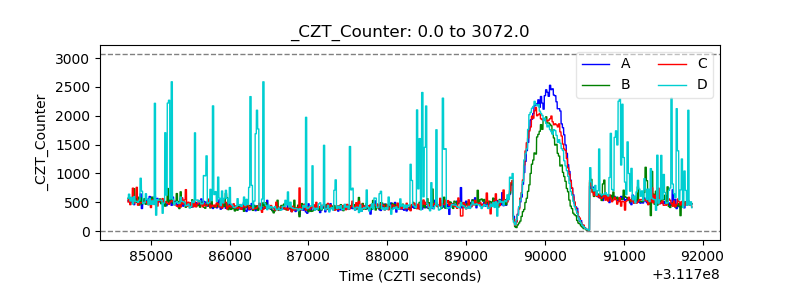 |
| +2.5 Volts monitor |  |
| +5 Volts monitor |  |
| _ROLL_ROT | 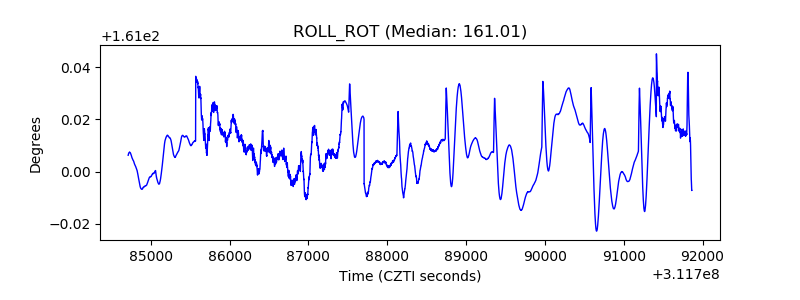 |
| _Roll_DEC | 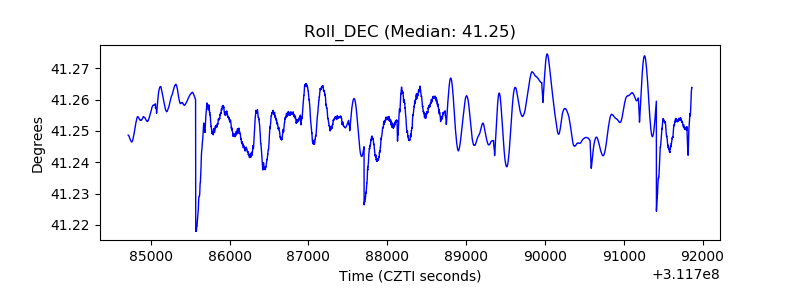 |
| _Roll_RA | 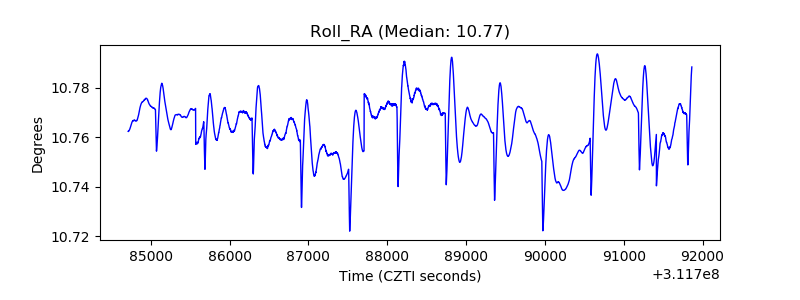 |
| Veto Counter | 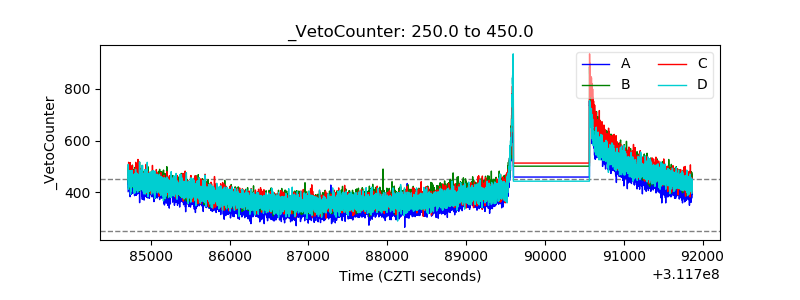 |