| Param | Original file | Final file |
|---|---|---|
| Filename | modeM0/AS1A07_007T04_9000003310_22389cztM0_level2.evt | modeM0/AS1A07_007T04_9000003310_22389cztM0_level2_quad_clean.evt |
| Size (bytes) | 475,387,200 | 97,496,640 |
| Size | 453.4 MB | 93.0 MB |
| Events in quadrant A | 3,115,379 | 641,044 |
| Events in quadrant B | 3,286,333 | 644,540 |
| Events in quadrant C | 3,181,182 | 617,502 |
| Events in quadrant D | 4,374,467 | 597,990 |
| Mode M0 | |||
|---|---|---|---|
| Quadrant | BADHDUFLAG | Total packets | Discarded packets |
| A | 0 | 13663 | 2 |
| B | 0 | 14012 | 2 |
| C | 0 | 13698 | 2 |
| D | 0 | 17559 | 4 |
| Mode SS | |||
|---|---|---|---|
| Quadrant | BADHDUFLAG | Total packets | Discarded packets |
| A | 0 | 132 | 0 |
| B | 0 | 132 | 0 |
| C | 0 | 132 | 0 |
| D | 0 | 132 | 0 |
| Mode M9 | |||
|---|---|---|---|
| Quadrant | BADHDUFLAG | Total packets | Discarded packets |
| A | 0 | 12 | 0 |
| B | 0 | 13 | 0 |
| C | 0 | 13 | 0 |
| D | 0 | 13 | 0 |
| Quadrant | Total seconds | Saturated seconds | Saturation percentage |
|---|---|---|---|
| A | 6471 | 54 | 0.834492% |
| B | 6471 | 66 | 1.019935% |
| C | 6471 | 125 | 1.931695% |
| D | 6470 | 240 | 3.709428% |
Noise dominated data is calculated using 1-second bins in cleaned event files. If a bin has >2000 counts, and if more than 50% of those come from <1% of pixels, then it is considered to be noise-dominated and hence unusable.
| Quadrant | # 1 sec bins | Bins with >0 counts | Bins with >2000 counts | High rate bins dominated by noise | Noise dominated (total time) | Noise dominated (detector-on time) | Marked lightcurve |
|---|---|---|---|---|---|---|---|
| A | 7566 | 6471 | 0 | 0 | 0.00% | 0.00% | 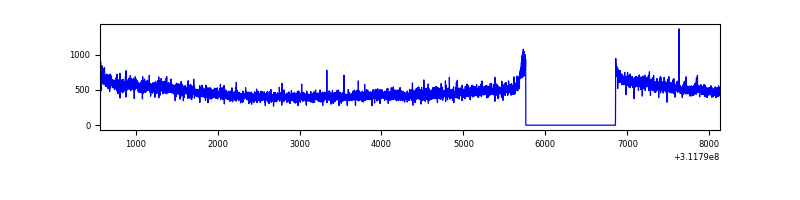 |
| B | 7566 | 6471 | 2 | 2 | 0.03% | 0.03% | 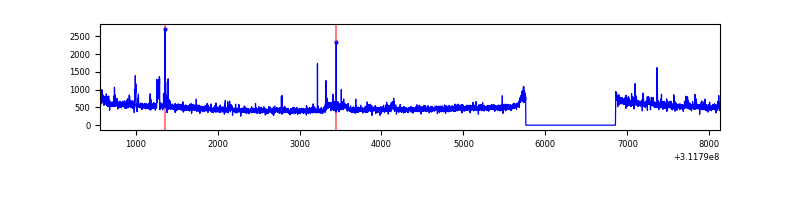 |
| C | 7566 | 6471 | 8 | 8 | 0.11% | 0.12% | 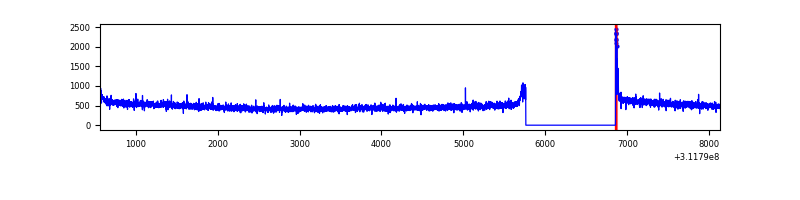 |
| D | 7565 | 6470 | 166 | 166 | 2.19% | 2.57% | 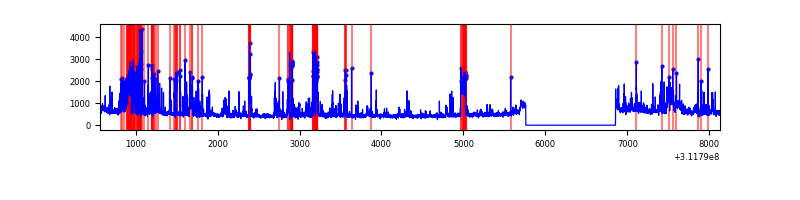 |
Top three noisy pixels from each quadrant. If the there are fewer than three noisy pixels in the level2.evt file, extra rows are filled as -1
| Pixel properties | Quadrant properties | ||||||
|---|---|---|---|---|---|---|---|
| Quadrant | DetID | PixID | Counts | Sigma | Mean | Median | Sigma |
| A | 3 | 1 | 10081 | 57.57 | 806 | 788 | 161.4 |
| A | 13 | 254 | 8919 | 50.37 | 806 | 788 | 161.4 |
| A | 0 | 226 | 7138 | 39.34 | 806 | 788 | 161.4 |
| B | 0 | 190 | 45334 | 293.77 | 801 | 781 | 151.7 |
| B | 6 | 36 | 42531 | 275.29 | 801 | 781 | 151.7 |
| B | 0 | 228 | 18558 | 117.22 | 801 | 781 | 151.7 |
| C | 14 | 238 | 121642 | 672.7 | 775 | 781 | 179.7 |
| C | 0 | 10 | 35387 | 192.61 | 775 | 781 | 179.7 |
| C | 13 | 61 | 5480 | 26.15 | 775 | 781 | 179.7 |
| D | 1 | 52 | 1188825 | 6297.7 | 782 | 760 | 188.7 |
| D | 12 | 227 | 96823 | 509.21 | 782 | 760 | 188.7 |
| D | 7 | 38 | 58765 | 307.47 | 782 | 760 | 188.7 |
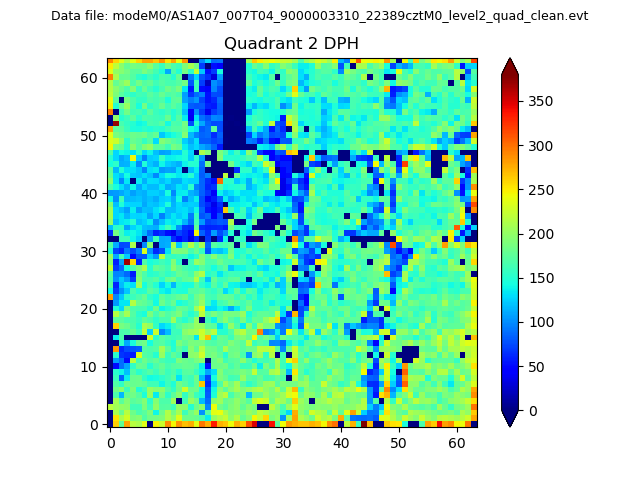
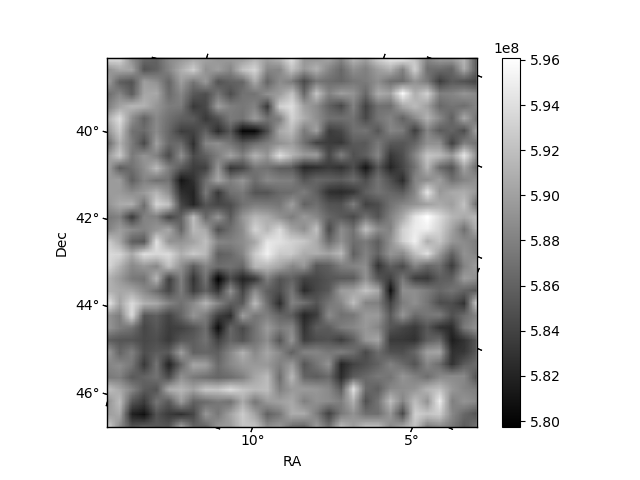
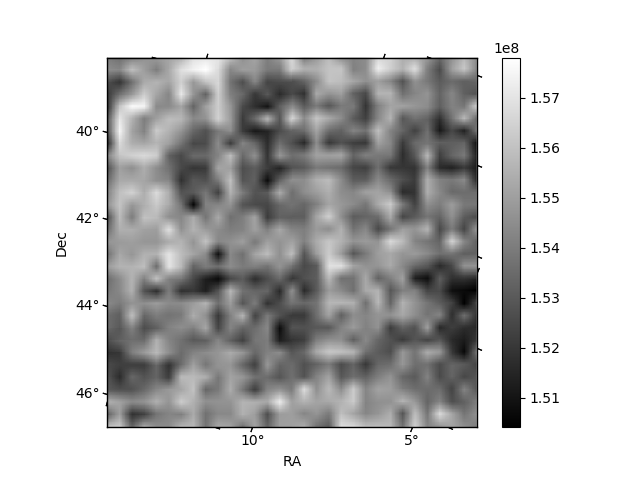
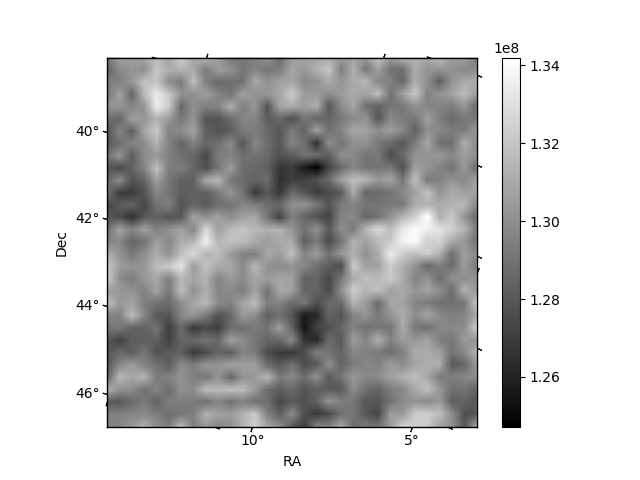
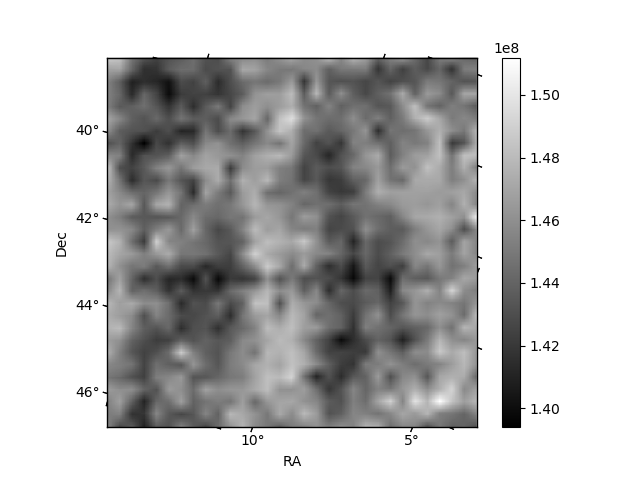
Histogram calculated using DETX and DETY for each event in the final _common_clean file
| Quadrant A | 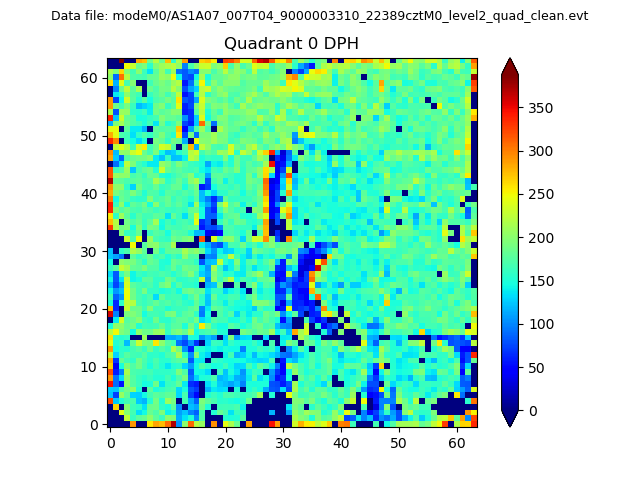 |
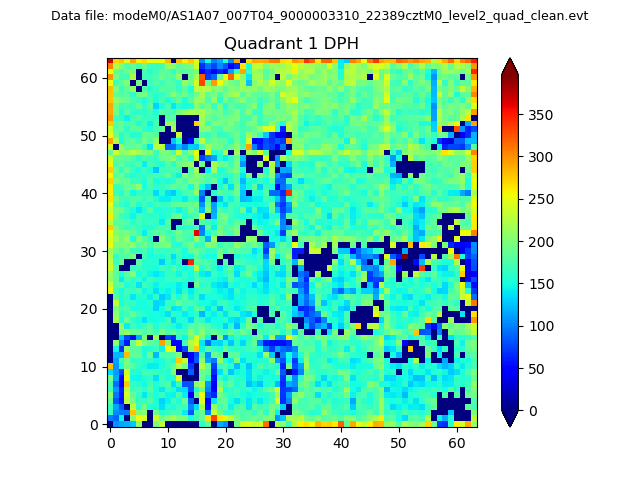 |
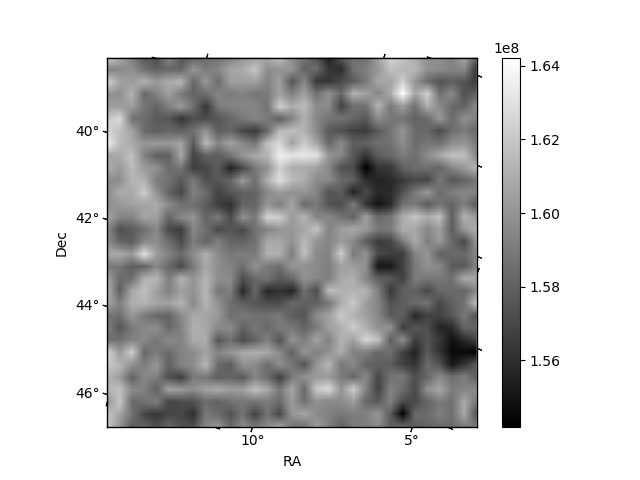
Quadrant B |
|---|---|---|---|
| Quadrant D | 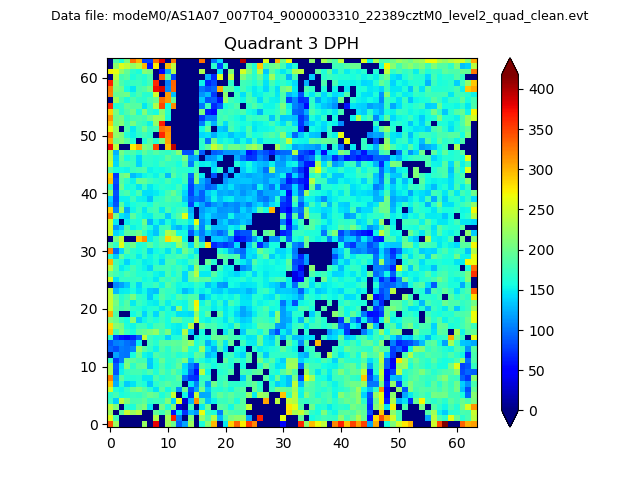 |
 |
Quadrant C |
| Plot type | Count rate plots | Images |
|---|---|---|
| Comparison with Poisson distribution Blue bars denote a histogram of data divided into 1 sec bins. Red curve is a Poisson curve with rate = median count rate of data. |
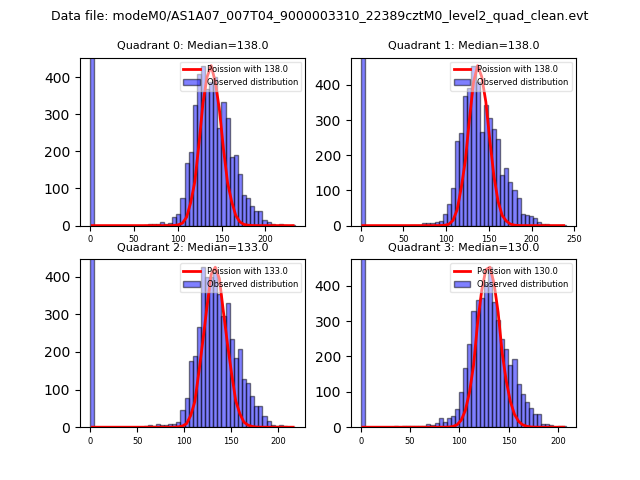 |
 |
| Quadrant-wise count rates Data is divided into 100 sec bins |
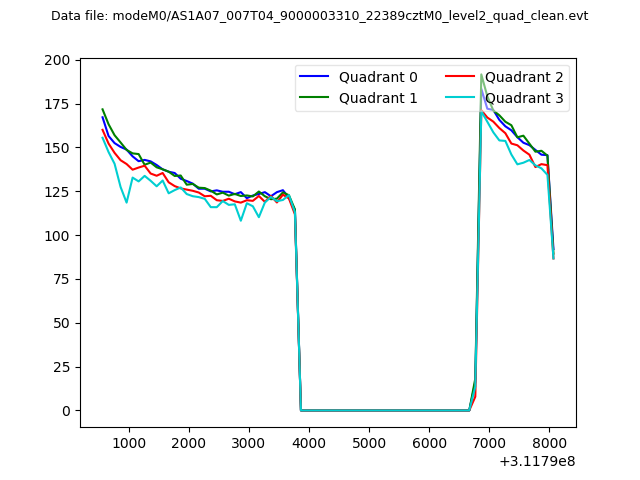 |
|
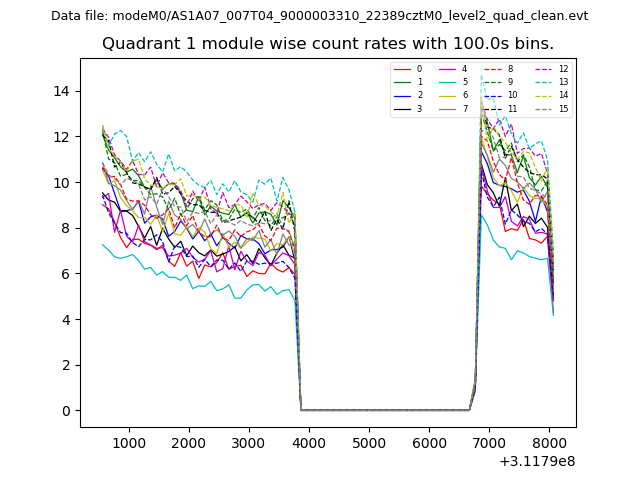
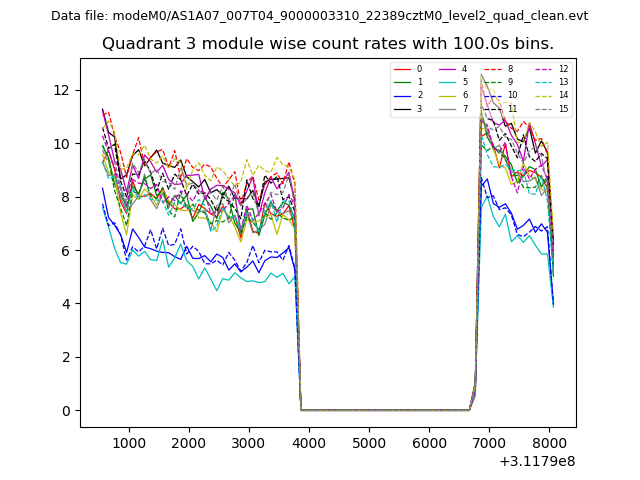
| Module-wise count rates for Quadrant A Data is divided into 100 sec bins |
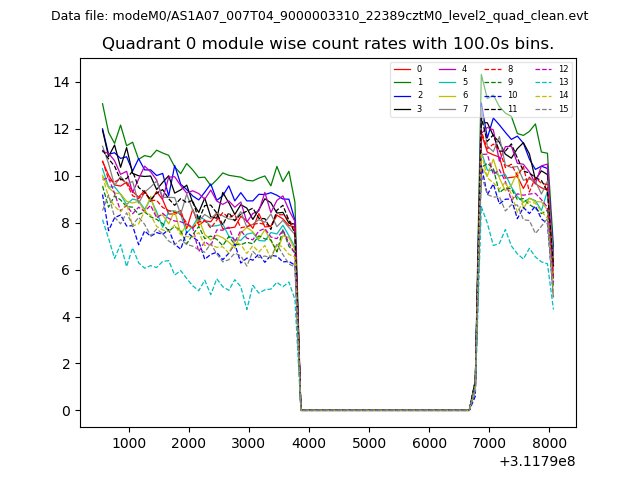 |
 |
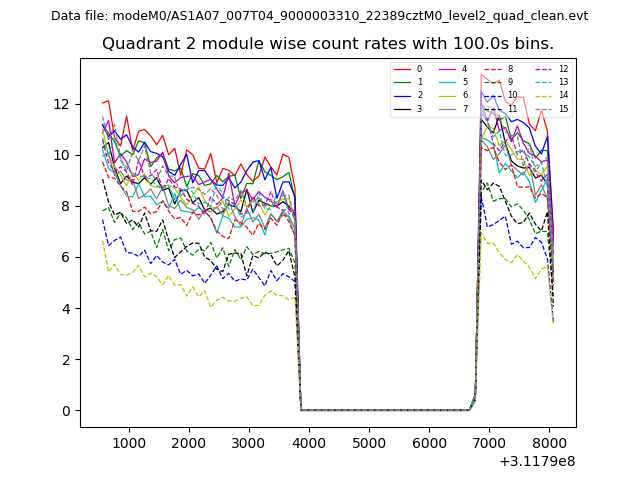
| Module-wise count rates for Quadrant B Data is divided into 100 sec bins |
 |
 |
| Module-wise count rates for Quadrant C Data is divided into 100 sec bins |
 |
 |
| Module-wise count rates for Quadrant D Data is divided into 100 sec bins |
 |
 |
| Parameter | Plot |
|---|---|
| CZT HV Monitor | 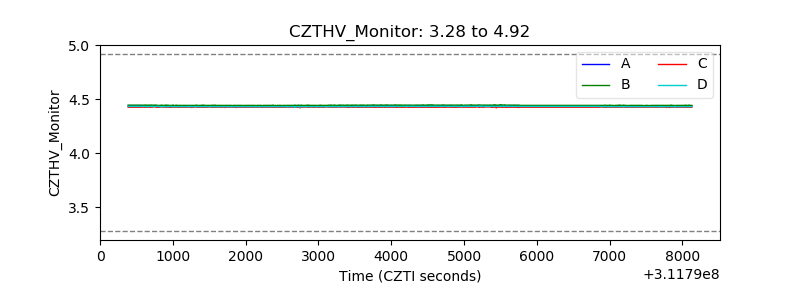 |
| D_VDD | 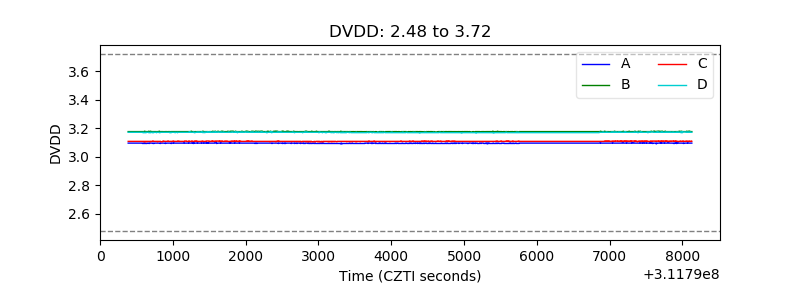 |
| Temperature 1 |  |
| Veto HV Monitor | 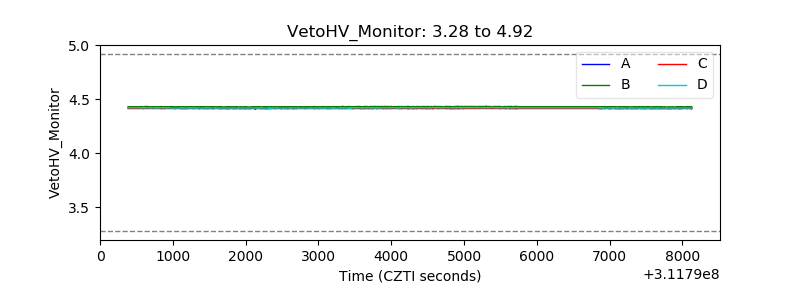 |
| Veto LLD | 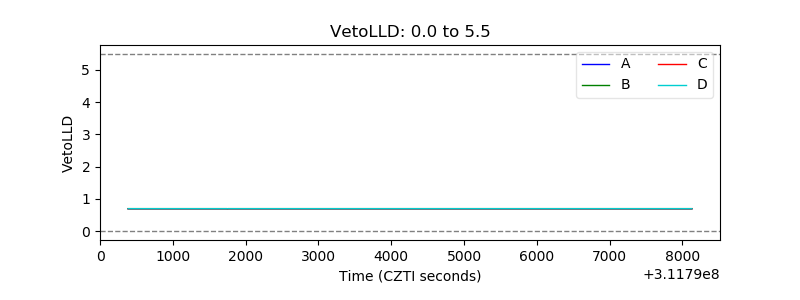 |
| Alpha Counter | 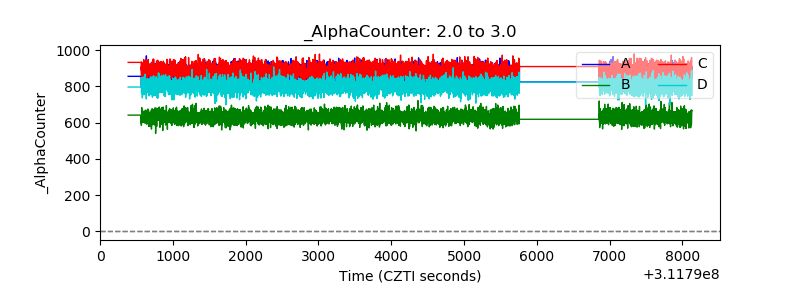 |
| _CPM_Rate | 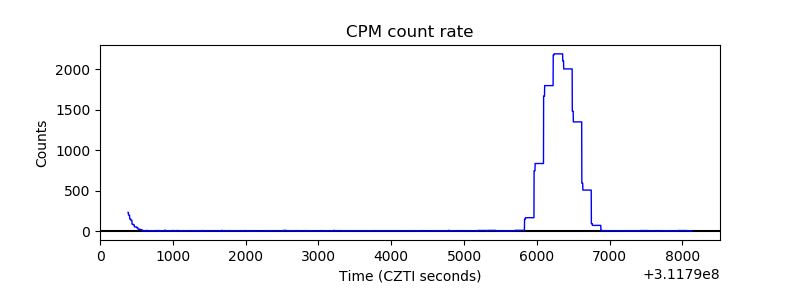 |
| CZT Counter | 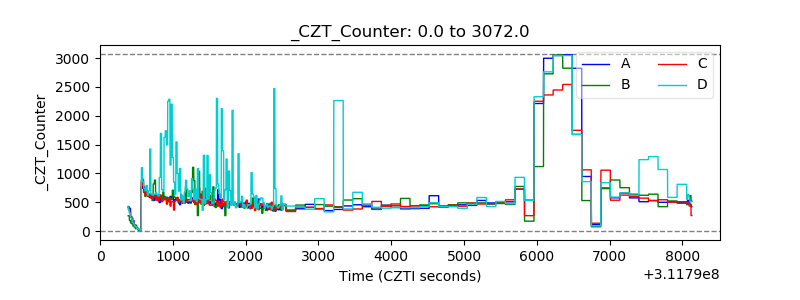 |
| +2.5 Volts monitor |  |
| +5 Volts monitor |  |
| _ROLL_ROT |  |
| _Roll_DEC | 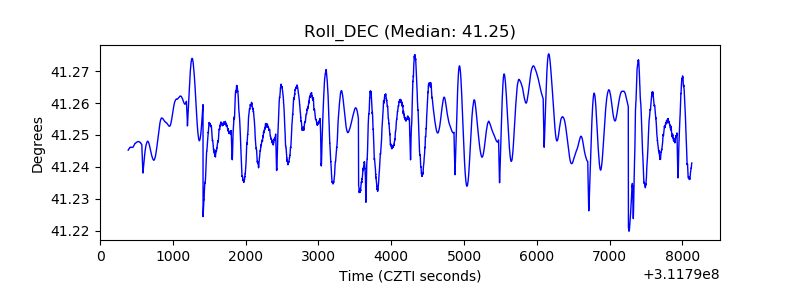 |
| _Roll_RA | 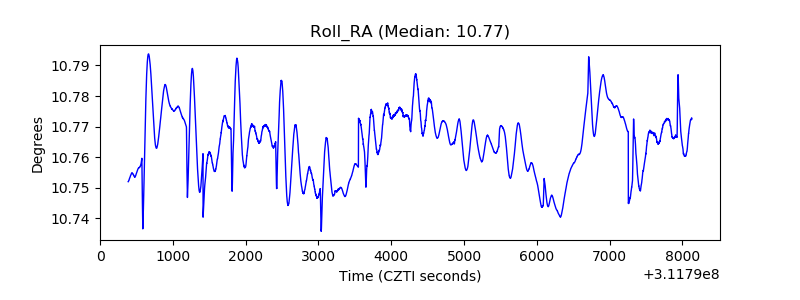 |
| Veto Counter | 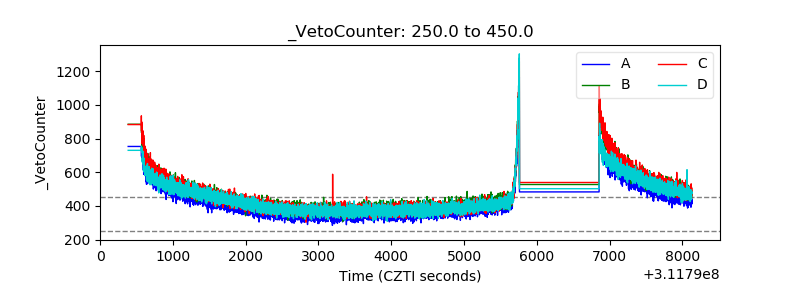 |