| Param | Original file | Final file |
|---|---|---|
| Filename | modeM0/AS1A07_007T04_9000003310_22390cztM0_level2.evt | modeM0/AS1A07_007T04_9000003310_22390cztM0_level2_quad_clean.evt |
| Size (bytes) | 467,343,360 | 96,419,520 |
| Size | 445.7 MB | 92.0 MB |
| Events in quadrant A | 3,073,307 | 636,255 |
| Events in quadrant B | 3,166,003 | 645,668 |
| Events in quadrant C | 3,150,367 | 614,333 |
| Events in quadrant D | 4,341,634 | 589,587 |
| Mode M0 | |||
|---|---|---|---|
| Quadrant | BADHDUFLAG | Total packets | Discarded packets |
| A | 0 | 13243 | 2 |
| B | 0 | 13525 | 2 |
| C | 0 | 13399 | 2 |
| D | 0 | 17150 | 2 |
| Mode SS | |||
|---|---|---|---|
| Quadrant | BADHDUFLAG | Total packets | Discarded packets |
| A | 0 | 128 | 0 |
| B | 0 | 128 | 0 |
| C | 0 | 128 | 0 |
| D | 0 | 128 | 0 |
| Mode M9 | |||
|---|---|---|---|
| Quadrant | BADHDUFLAG | Total packets | Discarded packets |
| A | 0 | 12 | 0 |
| B | 0 | 12 | 0 |
| C | 0 | 12 | 0 |
| D | 0 | 12 | 0 |
| Quadrant | Total seconds | Saturated seconds | Saturation percentage |
|---|---|---|---|
| A | 6213 | 32 | 0.515049% |
| B | 6214 | 52 | 0.836820% |
| C | 6213 | 101 | 1.625624% |
| D | 6213 | 154 | 2.478674% |
Noise dominated data is calculated using 1-second bins in cleaned event files. If a bin has >2000 counts, and if more than 50% of those come from <1% of pixels, then it is considered to be noise-dominated and hence unusable.
| Quadrant | # 1 sec bins | Bins with >0 counts | Bins with >2000 counts | High rate bins dominated by noise | Noise dominated (total time) | Noise dominated (detector-on time) | Marked lightcurve |
|---|---|---|---|---|---|---|---|
| A | 7448 | 6213 | 0 | 0 | 0.00% | 0.00% | 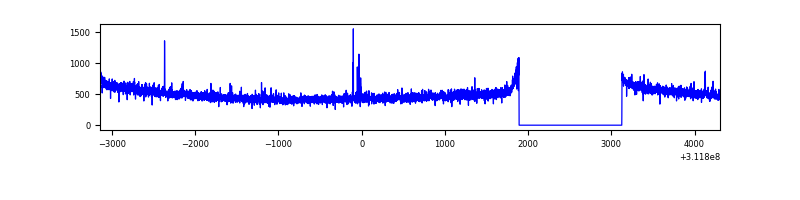 |
| B | 7449 | 6214 | 1 | 1 | 0.01% | 0.02% | 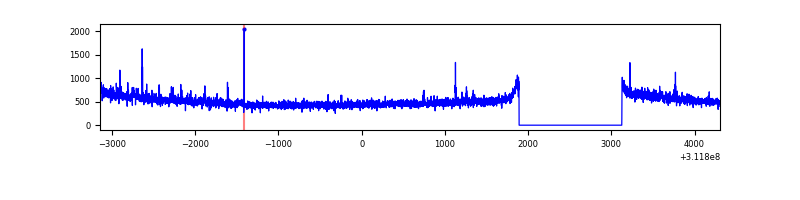 |
| C | 7448 | 6213 | 8 | 8 | 0.11% | 0.13% | 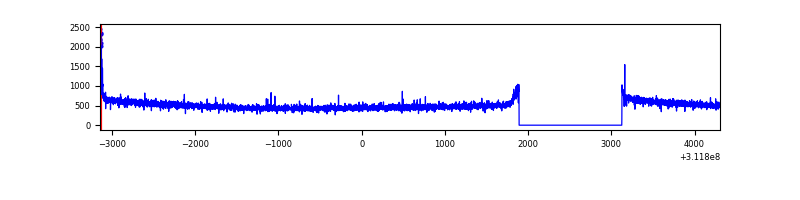 |
| D | 7448 | 6214 | 103 | 103 | 1.38% | 1.66% | 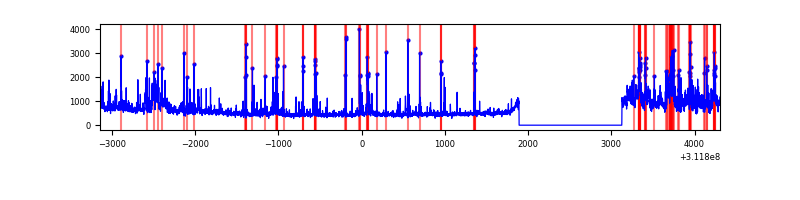 |
Top three noisy pixels from each quadrant. If the there are fewer than three noisy pixels in the level2.evt file, extra rows are filled as -1
| Pixel properties | Quadrant properties | ||||||
|---|---|---|---|---|---|---|---|
| Quadrant | DetID | PixID | Counts | Sigma | Mean | Median | Sigma |
| A | 3 | 1 | 20471 | 125.24 | 792 | 774 | 157.3 |
| A | 13 | 254 | 8787 | 50.95 | 792 | 774 | 157.3 |
| A | 0 | 226 | 7006 | 39.62 | 792 | 774 | 157.3 |
| B | 0 | 245 | 19795 | 130.19 | 790 | 772 | 146.1 |
| B | 12 | 111 | 16967 | 110.83 | 790 | 772 | 146.1 |
| B | 0 | 229 | 15967 | 103.99 | 790 | 772 | 146.1 |
| C | 14 | 238 | 121438 | 678.55 | 767 | 772 | 177.8 |
| C | 0 | 10 | 36227 | 199.38 | 767 | 772 | 177.8 |
| C | 13 | 61 | 5309 | 25.51 | 767 | 772 | 177.8 |
| D | 1 | 52 | 668111 | 3612.27 | 769 | 748 | 184.7 |
| D | 12 | 227 | 509682 | 2754.74 | 769 | 748 | 184.7 |
| D | 15 | 145 | 109647 | 589.44 | 769 | 748 | 184.7 |
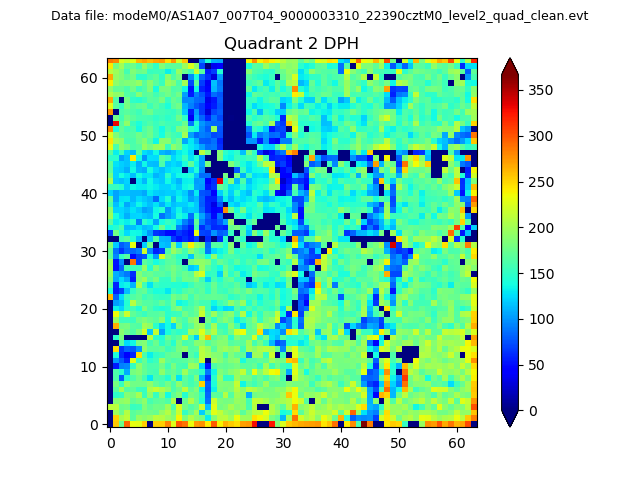
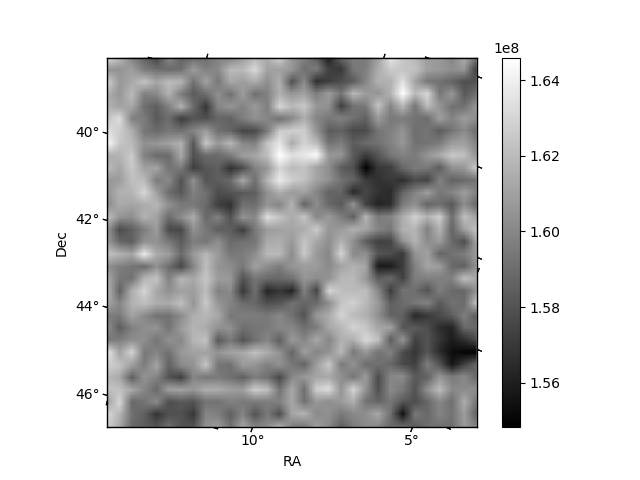
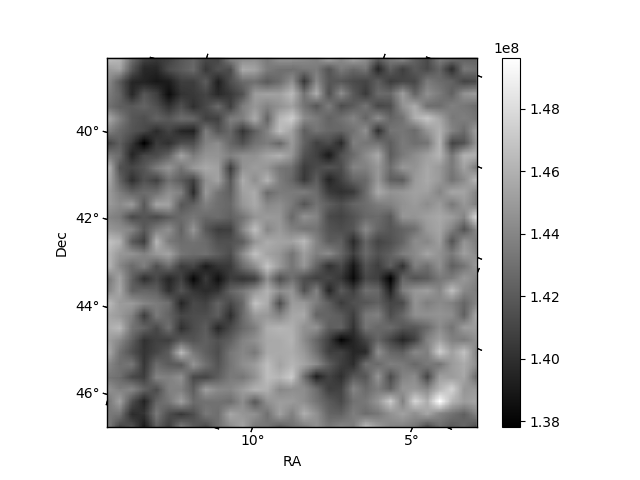
Histogram calculated using DETX and DETY for each event in the final _common_clean file
| Quadrant A | 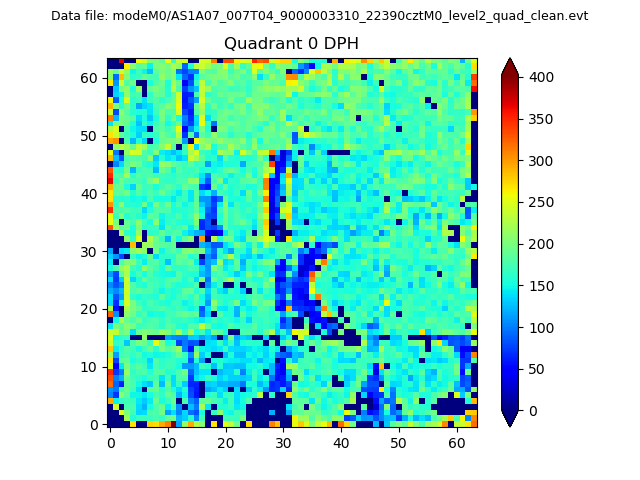 |
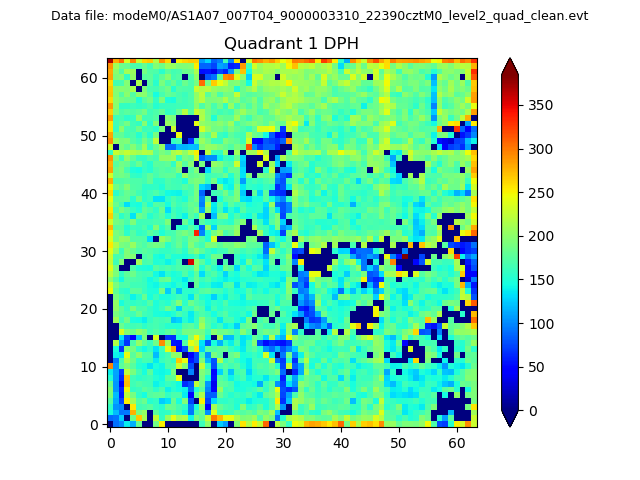 |
Quadrant B |
|---|---|---|---|
| Quadrant D | 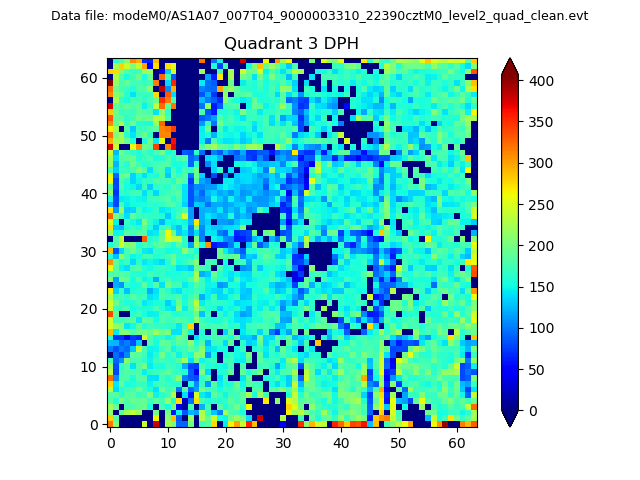 |
 |
Quadrant C |
| Plot type | Count rate plots | Images |
|---|---|---|
| Comparison with Poisson distribution Blue bars denote a histogram of data divided into 1 sec bins. Red curve is a Poisson curve with rate = median count rate of data. |
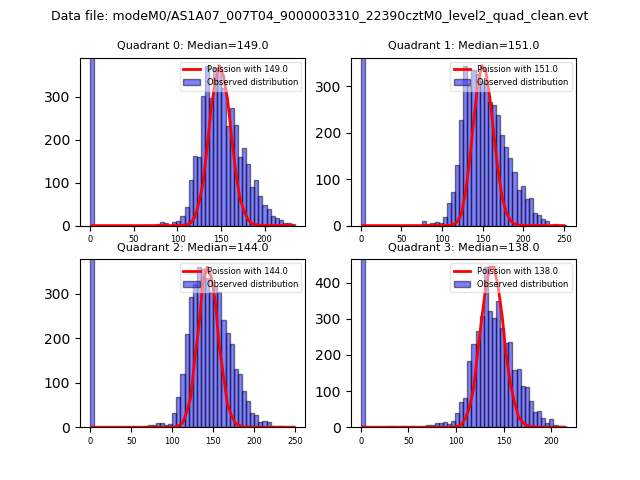 |
 |
| Quadrant-wise count rates Data is divided into 100 sec bins |
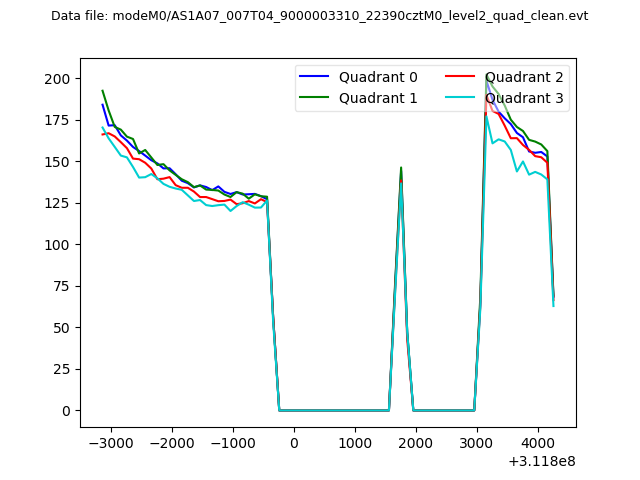 |
|
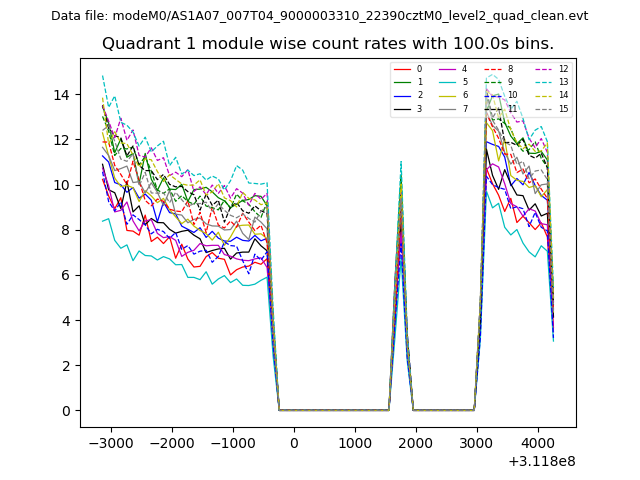
| Module-wise count rates for Quadrant A Data is divided into 100 sec bins |
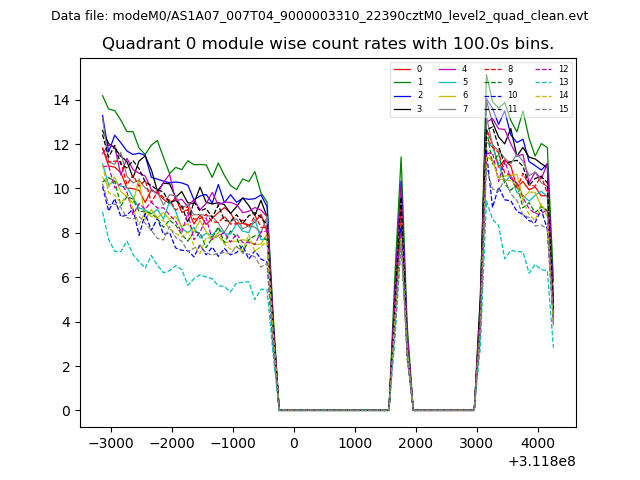 |
 |
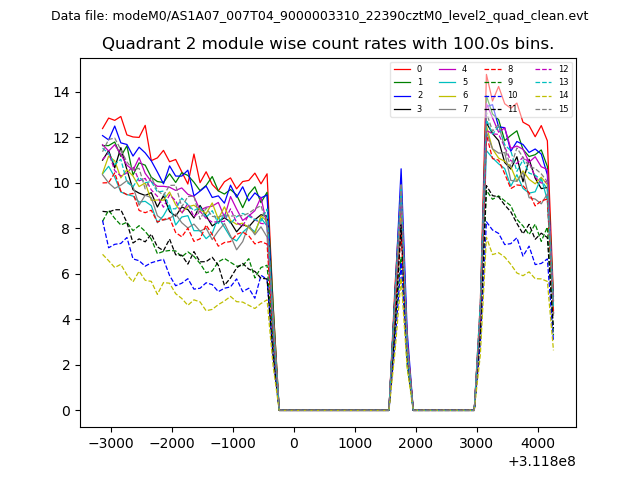
| Module-wise count rates for Quadrant B Data is divided into 100 sec bins |
 |
 |
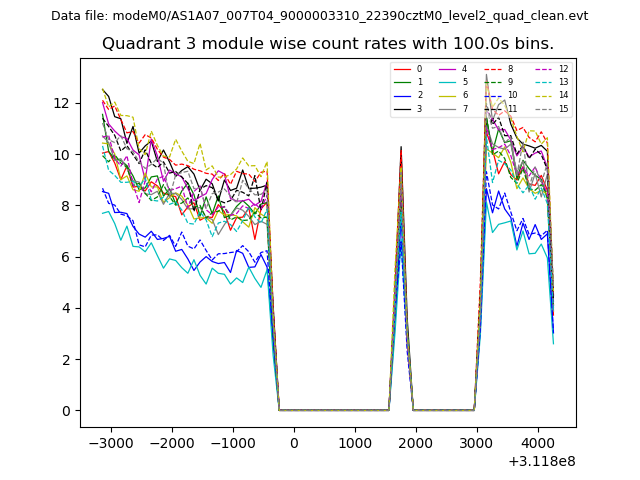
| Module-wise count rates for Quadrant C Data is divided into 100 sec bins |
 |
 |
| Module-wise count rates for Quadrant D Data is divided into 100 sec bins |
 |
 |
| Parameter | Plot |
|---|---|
| CZT HV Monitor | 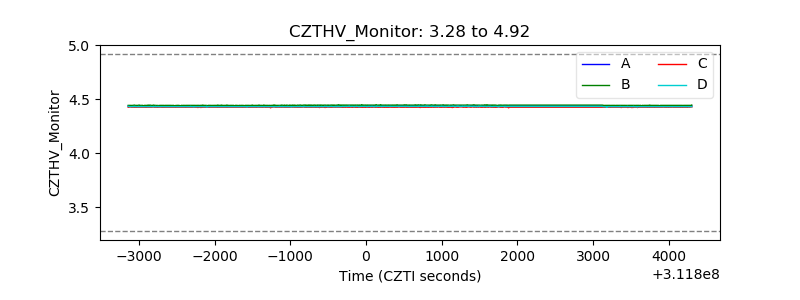 |
| D_VDD | 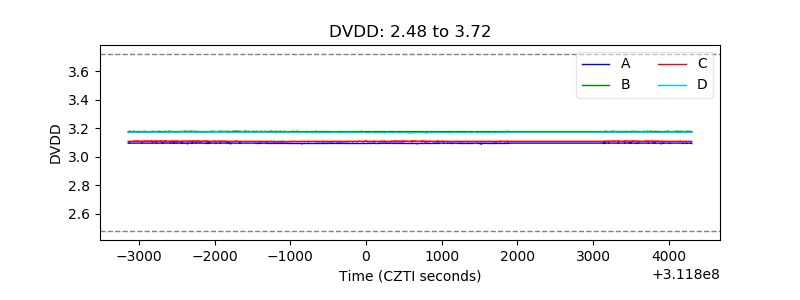 |
| Temperature 1 | 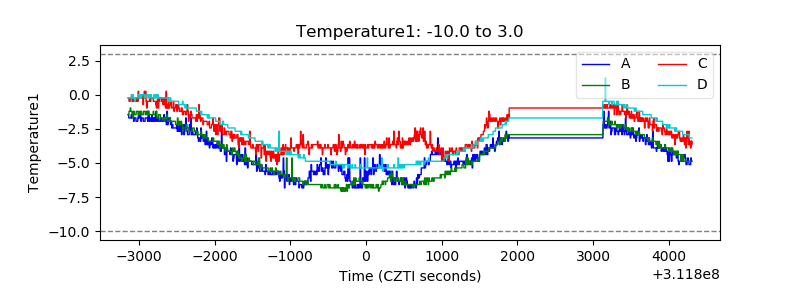 |
| Veto HV Monitor | 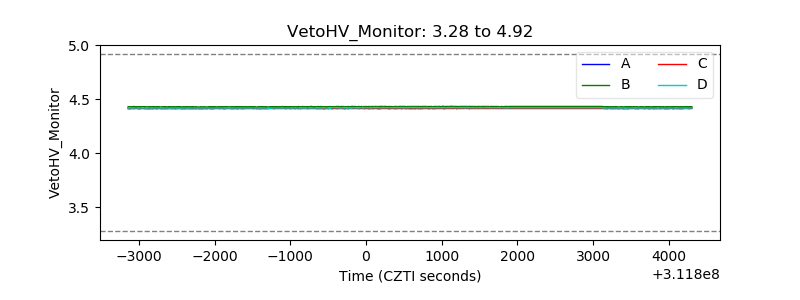 |
| Veto LLD | 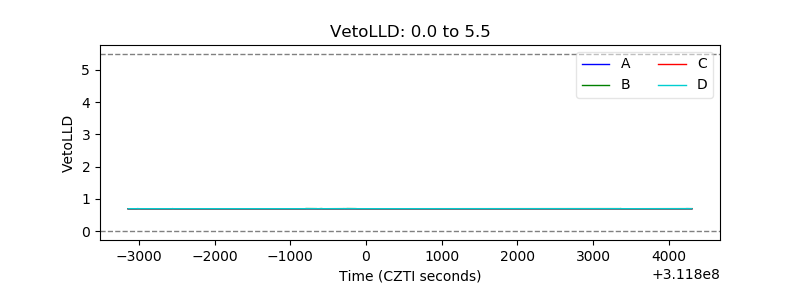 |
| Alpha Counter | 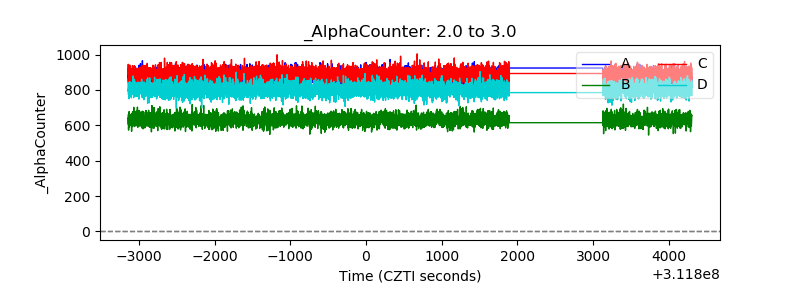 |
| _CPM_Rate | 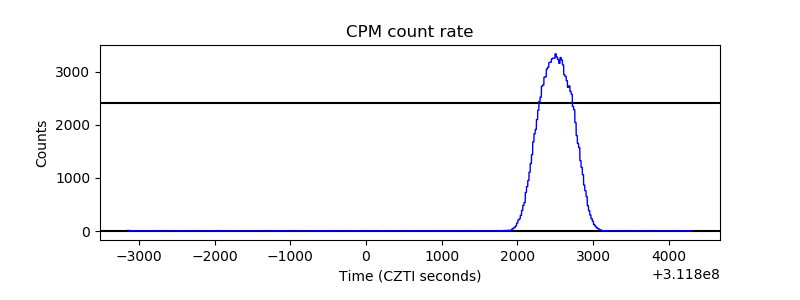 |
| CZT Counter | 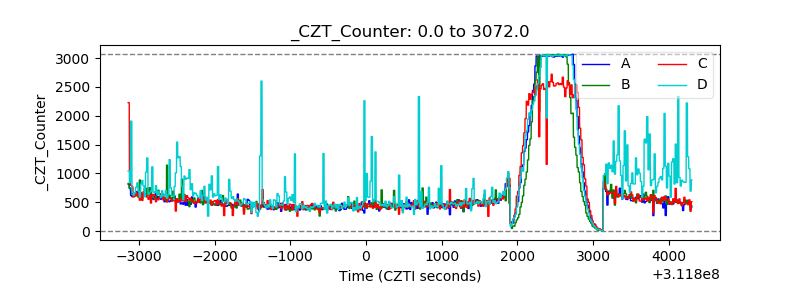 |
| +2.5 Volts monitor |  |
| +5 Volts monitor |  |
| _ROLL_ROT | 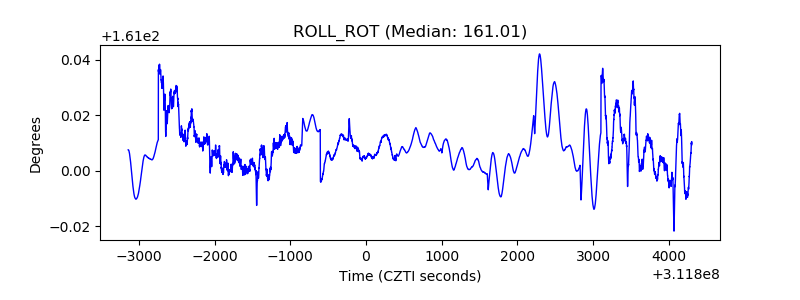 |
| _Roll_DEC | 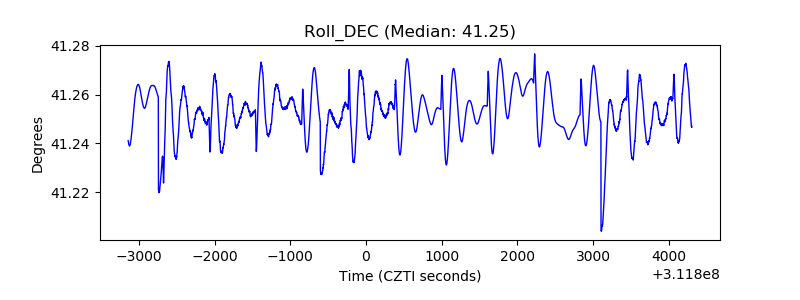 |
| _Roll_RA | 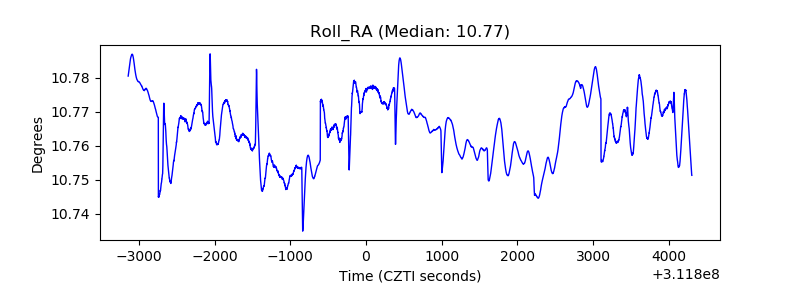 |
| Veto Counter | 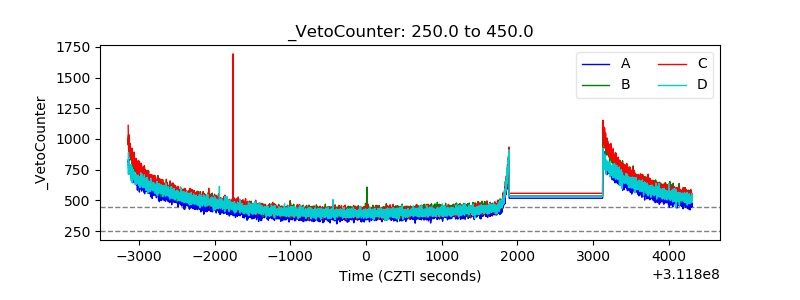 |