| Param | Original file | Final file |
|---|---|---|
| Filename | modeM0/AS1A07_007T04_9000003310_22391cztM0_level2.evt | modeM0/AS1A07_007T04_9000003310_22391cztM0_level2_quad_clean.evt |
| Size (bytes) | 462,758,400 | 98,458,560 |
| Size | 441.3 MB | 93.9 MB |
| Events in quadrant A | 3,056,133 | 650,336 |
| Events in quadrant B | 3,179,379 | 668,800 |
| Events in quadrant C | 3,142,118 | 635,861 |
| Events in quadrant D | 4,222,371 | 600,381 |
| Mode M0 | |||
|---|---|---|---|
| Quadrant | BADHDUFLAG | Total packets | Discarded packets |
| A | 0 | 12999 | 2 |
| B | 0 | 13334 | 2 |
| C | 0 | 13199 | 2 |
| D | 0 | 16658 | 2 |
| Mode SS | |||
|---|---|---|---|
| Quadrant | BADHDUFLAG | Total packets | Discarded packets |
| A | 0 | 124 | 0 |
| B | 0 | 124 | 0 |
| C | 0 | 124 | 0 |
| D | 0 | 124 | 0 |
| Mode M9 | |||
|---|---|---|---|
| Quadrant | BADHDUFLAG | Total packets | Discarded packets |
| A | 0 | 20 | 0 |
| B | 0 | 21 | 0 |
| C | 0 | 21 | 0 |
| D | 0 | 21 | 0 |
| Quadrant | Total seconds | Saturated seconds | Saturation percentage |
|---|---|---|---|
| A | 6109 | 11 | 0.180062% |
| B | 6109 | 32 | 0.523817% |
| C | 6109 | 60 | 0.982157% |
| D | 6109 | 100 | 1.636929% |
Noise dominated data is calculated using 1-second bins in cleaned event files. If a bin has >2000 counts, and if more than 50% of those come from <1% of pixels, then it is considered to be noise-dominated and hence unusable.
| Quadrant | # 1 sec bins | Bins with >0 counts | Bins with >2000 counts | High rate bins dominated by noise | Noise dominated (total time) | Noise dominated (detector-on time) | Marked lightcurve |
|---|---|---|---|---|---|---|---|
| A | 7444 | 6110 | 0 | 0 | 0.00% | 0.00% | 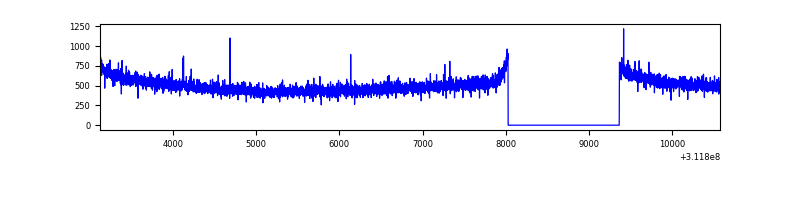 |
| B | 7444 | 6110 | 3 | 3 | 0.04% | 0.05% | 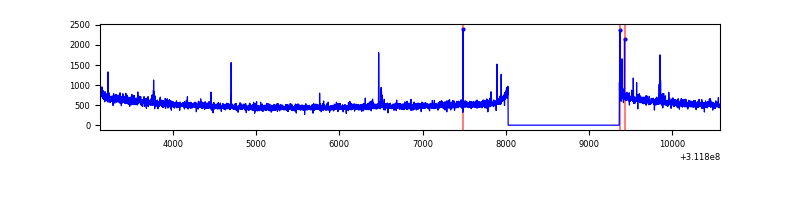 |
| C | 7444 | 6109 | 0 | 0 | 0.00% | 0.00% | 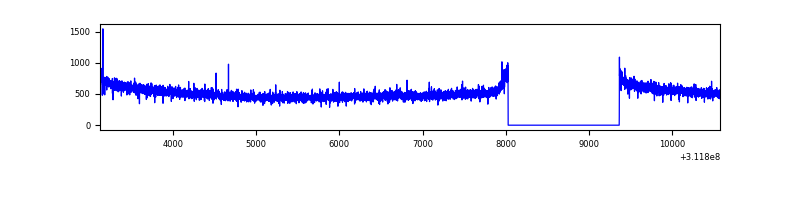 |
| D | 7444 | 6110 | 69 | 69 | 0.93% | 1.13% | 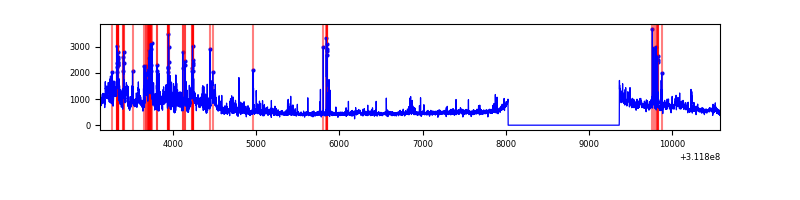 |
Top three noisy pixels from each quadrant. If the there are fewer than three noisy pixels in the level2.evt file, extra rows are filled as -1
| Pixel properties | Quadrant properties | ||||||
|---|---|---|---|---|---|---|---|
| Quadrant | DetID | PixID | Counts | Sigma | Mean | Median | Sigma |
| A | 13 | 254 | 8774 | 50.56 | 793 | 778 | 158.2 |
| A | 0 | 226 | 6892 | 38.66 | 793 | 778 | 158.2 |
| A | 3 | 137 | 6160 | 34.03 | 793 | 778 | 158.2 |
| B | 0 | 245 | 19920 | 130.38 | 796 | 779 | 146.8 |
| B | 0 | 190 | 18198 | 118.65 | 796 | 779 | 146.8 |
| B | 12 | 111 | 16826 | 109.31 | 796 | 779 | 146.8 |
| C | 14 | 238 | 124044 | 691.12 | 772 | 779 | 178.4 |
| C | 13 | 61 | 5260 | 25.12 | 772 | 779 | 178.4 |
| C | 0 | 10 | 3627 | 15.97 | 772 | 779 | 178.4 |
| D | 12 | 227 | 770128 | 4152.64 | 769 | 747 | 185.3 |
| D | 1 | 52 | 328131 | 1767.01 | 769 | 747 | 185.3 |
| D | 15 | 145 | 104218 | 558.47 | 769 | 747 | 185.3 |
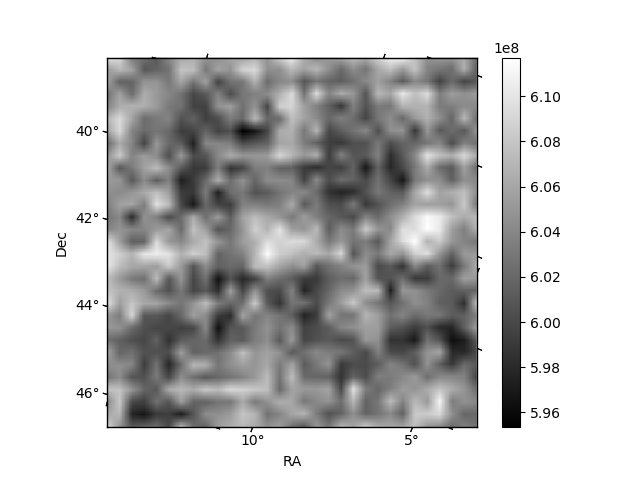
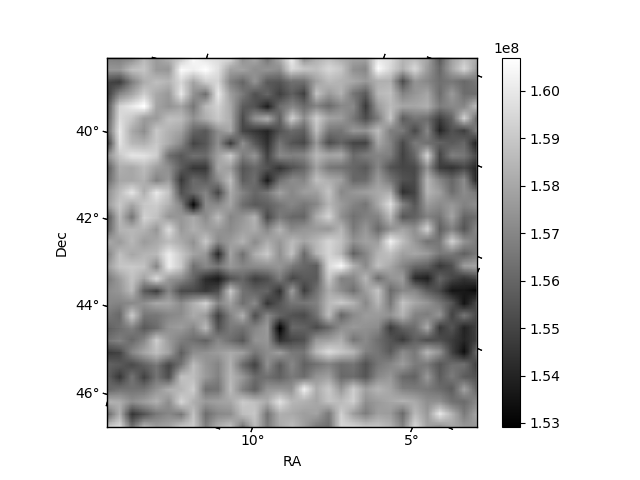
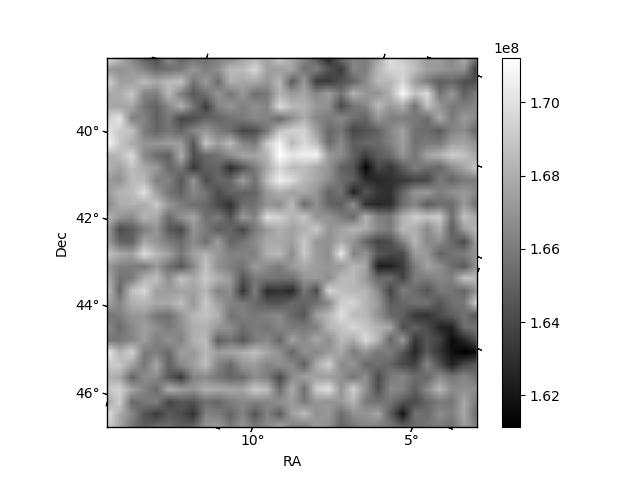
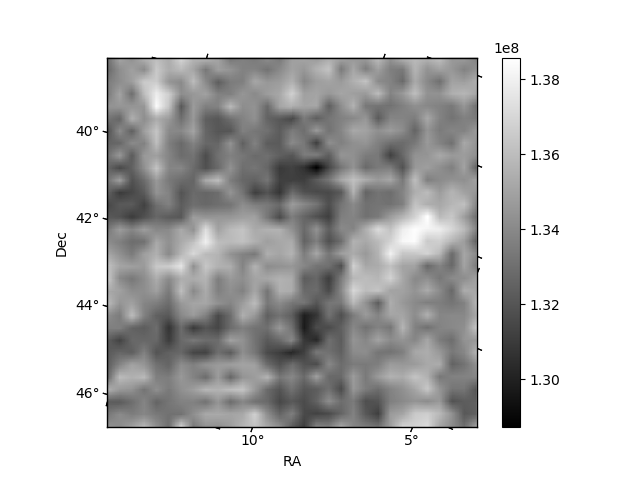
Histogram calculated using DETX and DETY for each event in the final _common_clean file
| Quadrant A | 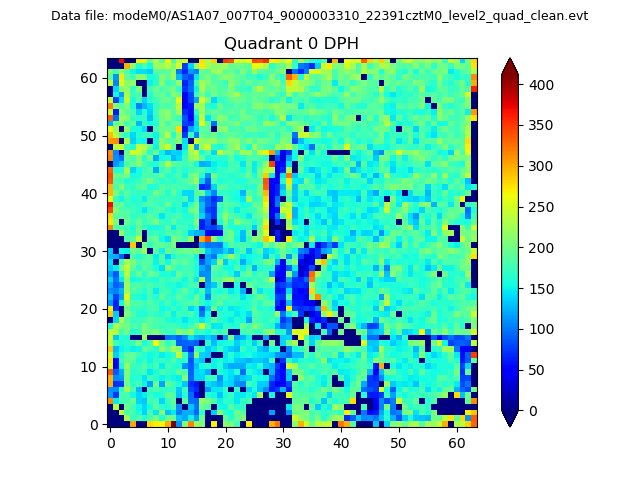 |
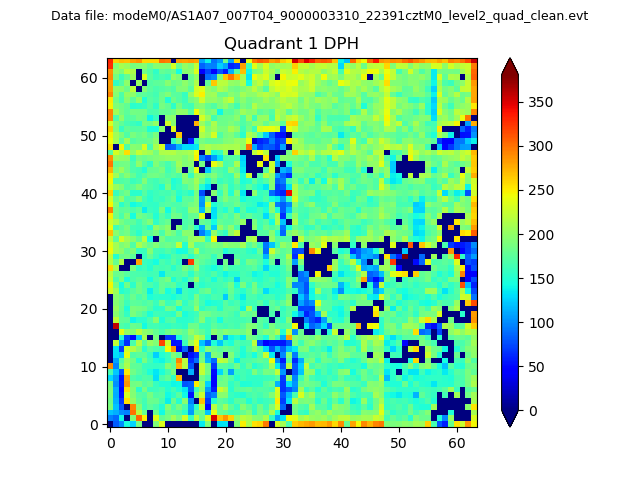 |
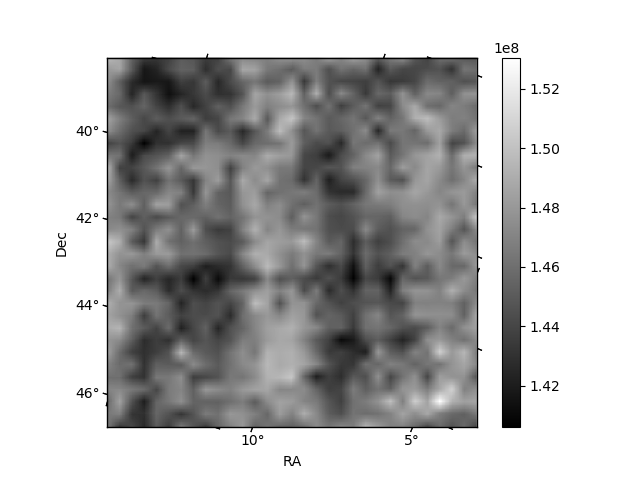
Quadrant B |
|---|---|---|---|
| Quadrant D | 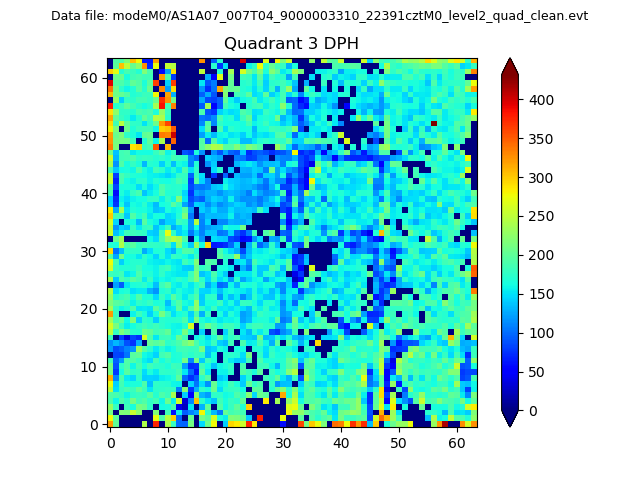 |
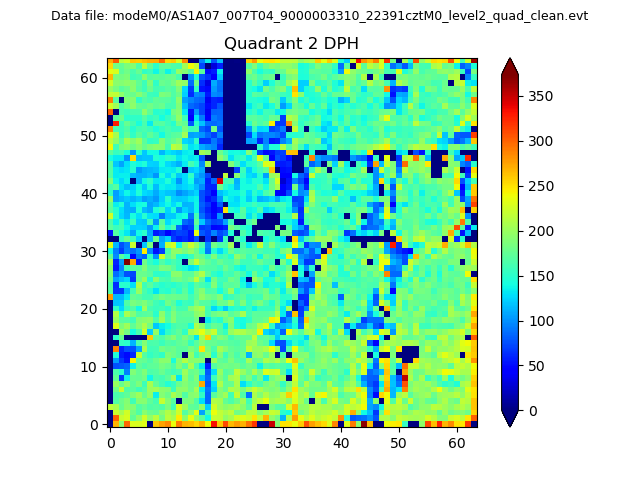 |
Quadrant C |
| Plot type | Count rate plots | Images |
|---|---|---|
| Comparison with Poisson distribution Blue bars denote a histogram of data divided into 1 sec bins. Red curve is a Poisson curve with rate = median count rate of data. |
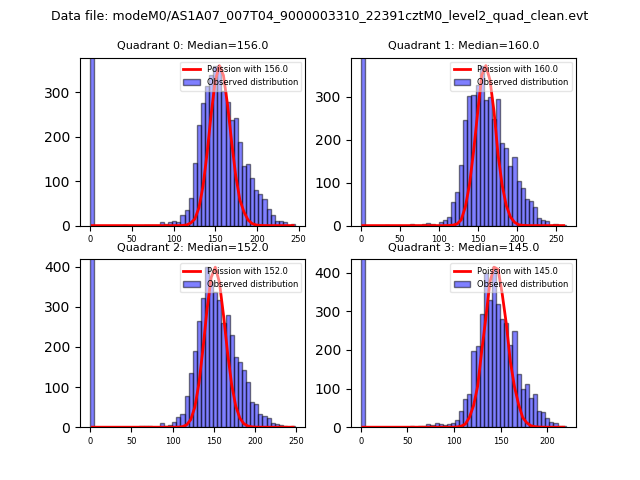 |
 |
| Quadrant-wise count rates Data is divided into 100 sec bins |
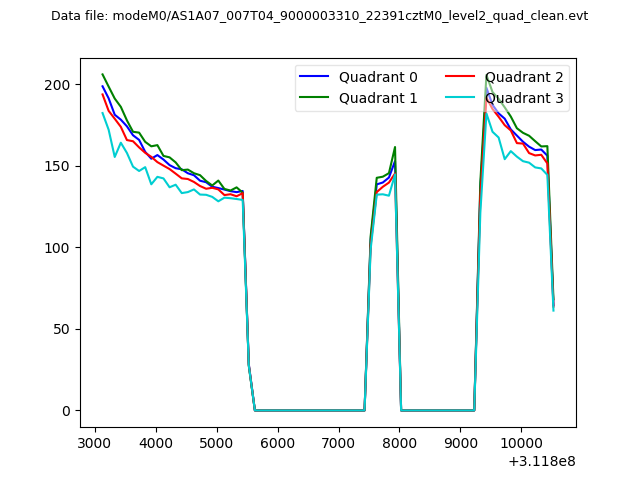 |
|
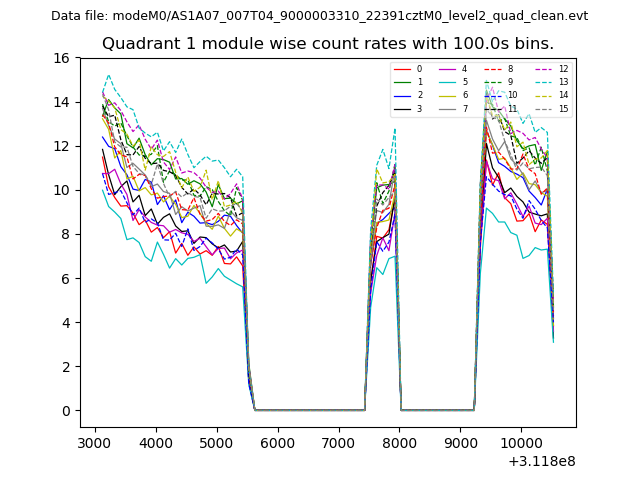
| Module-wise count rates for Quadrant A Data is divided into 100 sec bins |
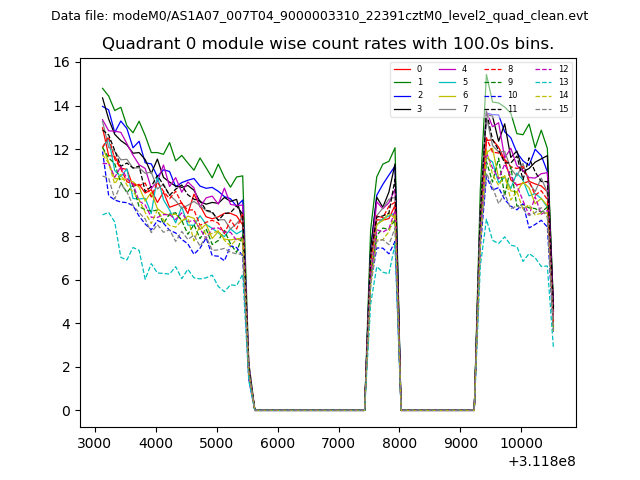 |
 |
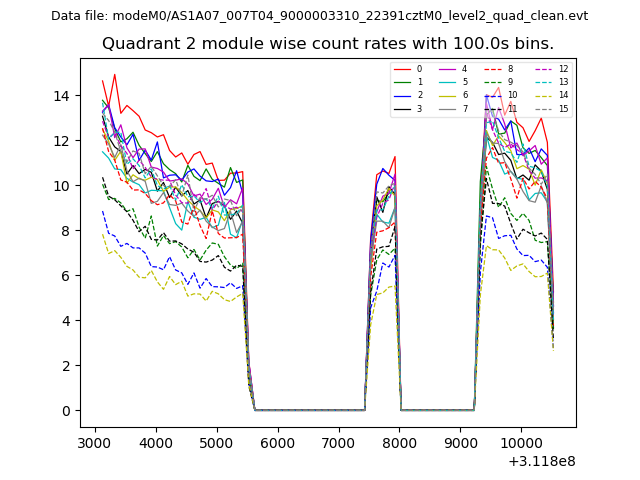
| Module-wise count rates for Quadrant B Data is divided into 100 sec bins |
 |
 |
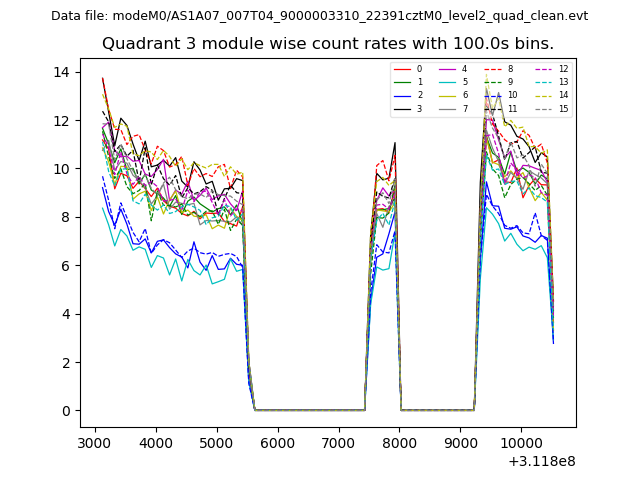
| Module-wise count rates for Quadrant C Data is divided into 100 sec bins |
 |
 |
| Module-wise count rates for Quadrant D Data is divided into 100 sec bins |
 |
 |
| Parameter | Plot |
|---|---|
| CZT HV Monitor | 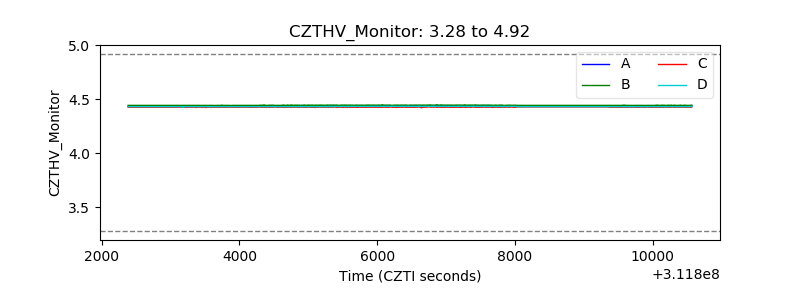 |
| D_VDD | 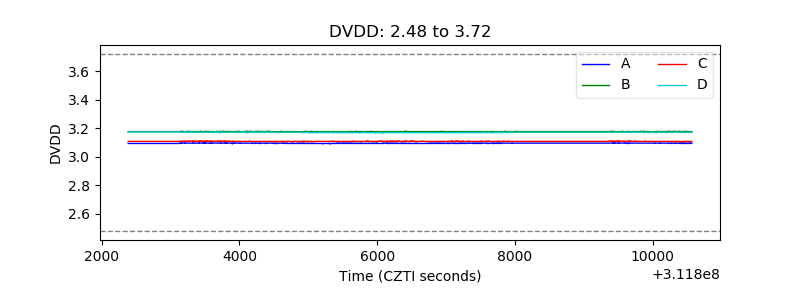 |
| Temperature 1 | 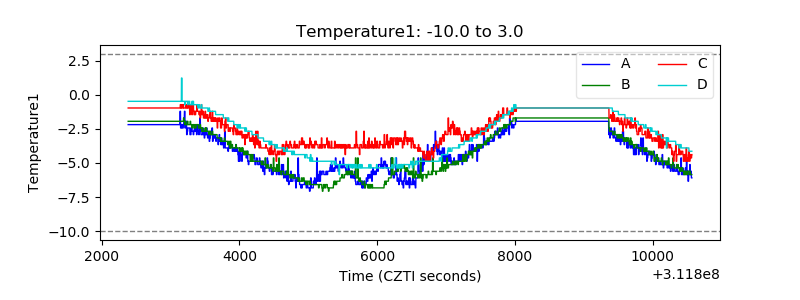 |
| Veto HV Monitor | 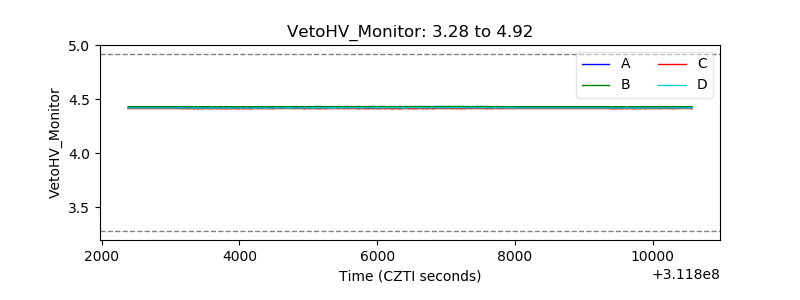 |
| Veto LLD | 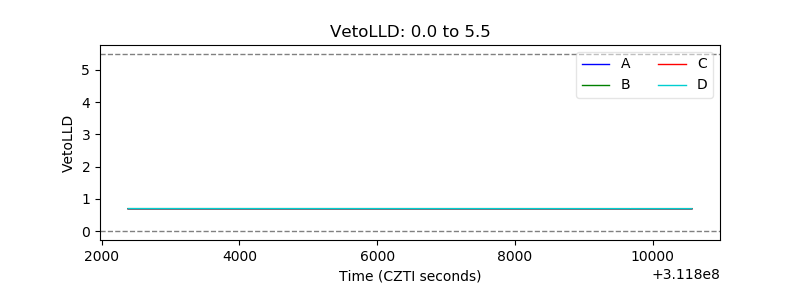 |
| Alpha Counter | 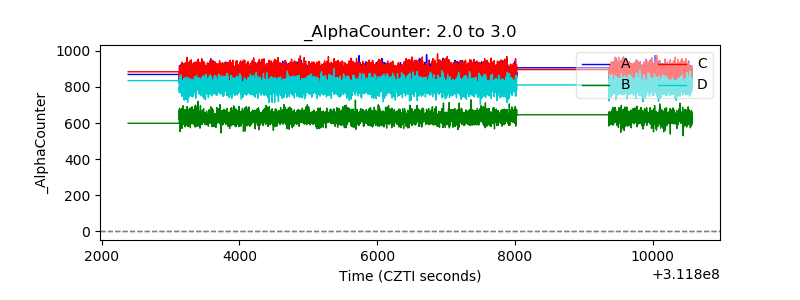 |
| _CPM_Rate | 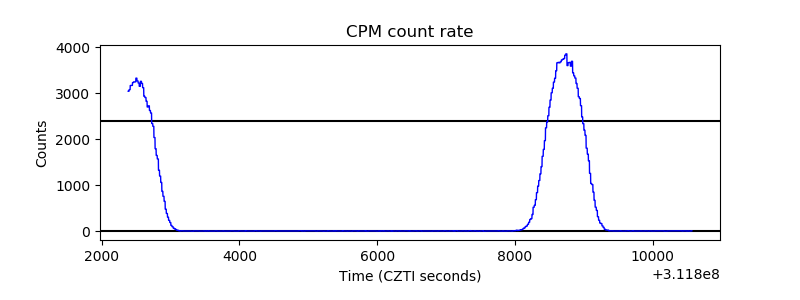 |
| CZT Counter | 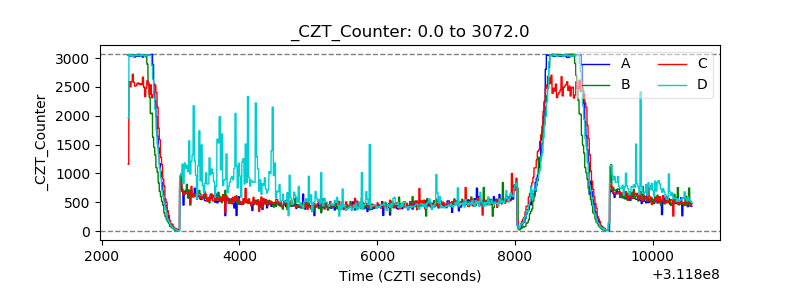 |
| +2.5 Volts monitor |  |
| +5 Volts monitor |  |
| _ROLL_ROT |  |
| _Roll_DEC |  |
| _Roll_RA | 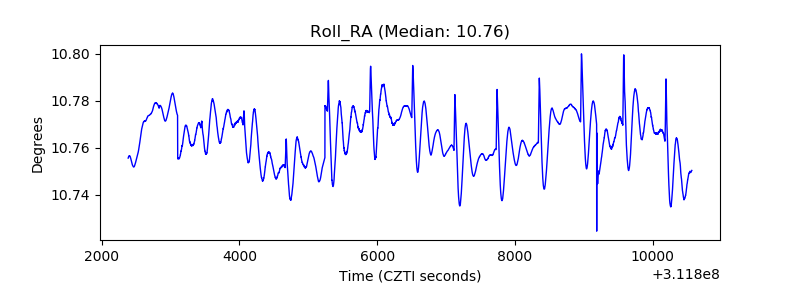 |
| Veto Counter | 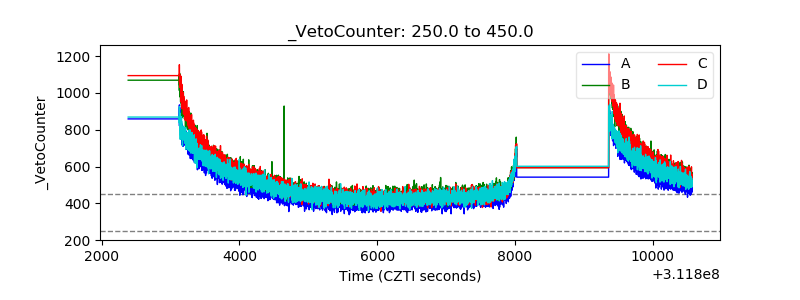 |