| Param | Original file | Final file |
|---|---|---|
| Filename | modeM0/AS1A07_007T04_9000003310_22394cztM0_level2.evt | modeM0/AS1A07_007T04_9000003310_22394cztM0_level2_quad_clean.evt |
| Size (bytes) | 424,581,120 | 87,050,880 |
| Size | 404.9 MB | 83.0 MB |
| Events in quadrant A | 2,998,967 | 556,413 |
| Events in quadrant B | 3,124,470 | 574,396 |
| Events in quadrant C | 3,069,181 | 543,742 |
| Events in quadrant D | 3,239,810 | 524,285 |
| Mode M0 | |||
|---|---|---|---|
| Quadrant | BADHDUFLAG | Total packets | Discarded packets |
| A | 0 | 12888 | 2 |
| B | 0 | 13128 | 2 |
| C | 0 | 12990 | 2 |
| D | 0 | 13759 | 2 |
| Mode SS | |||
|---|---|---|---|
| Quadrant | BADHDUFLAG | Total packets | Discarded packets |
| A | 0 | 128 | 0 |
| B | 0 | 128 | 0 |
| C | 0 | 128 | 0 |
| D | 0 | 128 | 0 |
| Mode M9 | |||
|---|---|---|---|
| Quadrant | BADHDUFLAG | Total packets | Discarded packets |
| A | 0 | 15 | 0 |
| B | 0 | 16 | 0 |
| C | 0 | 16 | 0 |
| D | 0 | 16 | 0 |
| Quadrant | Total seconds | Saturated seconds | Saturation percentage |
|---|---|---|---|
| A | 6263 | 21 | 0.335303% |
| B | 6263 | 46 | 0.734472% |
| C | 6263 | 56 | 0.894140% |
| D | 6263 | 34 | 0.542871% |
Noise dominated data is calculated using 1-second bins in cleaned event files. If a bin has >2000 counts, and if more than 50% of those come from <1% of pixels, then it is considered to be noise-dominated and hence unusable.
| Quadrant | # 1 sec bins | Bins with >0 counts | Bins with >2000 counts | High rate bins dominated by noise | Noise dominated (total time) | Noise dominated (detector-on time) | Marked lightcurve |
|---|---|---|---|---|---|---|---|
| A | 7438 | 6264 | 0 | 0 | 0.00% | 0.00% | 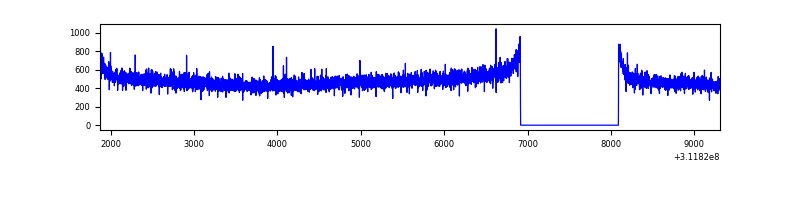 |
| B | 7438 | 6264 | 2 | 2 | 0.03% | 0.03% | 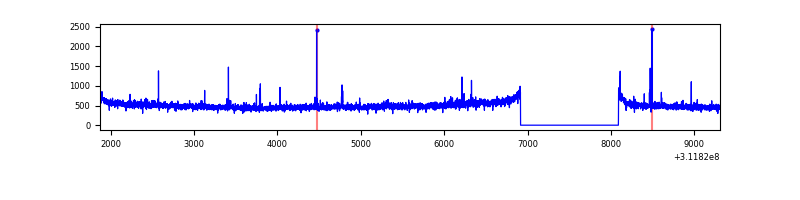 |
| C | 7438 | 6264 | 0 | 0 | 0.00% | 0.00% | 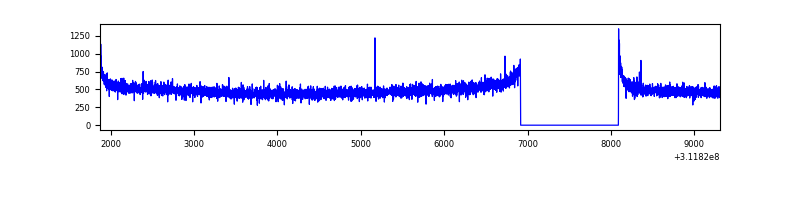 |
| D | 7438 | 6263 | 7 | 7 | 0.09% | 0.11% | 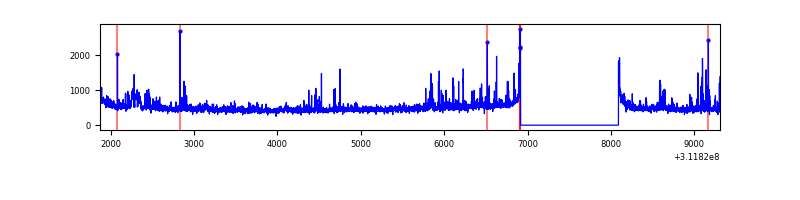 |
Top three noisy pixels from each quadrant. If the there are fewer than three noisy pixels in the level2.evt file, extra rows are filled as -1
| Pixel properties | Quadrant properties | ||||||
|---|---|---|---|---|---|---|---|
| Quadrant | DetID | PixID | Counts | Sigma | Mean | Median | Sigma |
| A | 13 | 254 | 8986 | 52.92 | 778 | 764 | 155.4 |
| A | 0 | 226 | 6610 | 37.62 | 778 | 764 | 155.4 |
| A | 3 | 137 | 6485 | 36.82 | 778 | 764 | 155.4 |
| B | 12 | 111 | 17543 | 113.48 | 784 | 762 | 147.9 |
| B | 3 | 64 | 15982 | 102.92 | 784 | 762 | 147.9 |
| B | 11 | 111 | 15449 | 99.32 | 784 | 762 | 147.9 |
| C | 14 | 238 | 119911 | 680.59 | 753 | 759 | 175.1 |
| C | 0 | 10 | 11992 | 64.16 | 753 | 759 | 175.1 |
| C | 13 | 61 | 5180 | 25.25 | 753 | 759 | 175.1 |
| D | 1 | 52 | 190138 | 1050.5 | 751 | 730 | 180.3 |
| D | 2 | 136 | 83255 | 457.7 | 751 | 730 | 180.3 |
| D | 12 | 227 | 45213 | 246.71 | 751 | 730 | 180.3 |
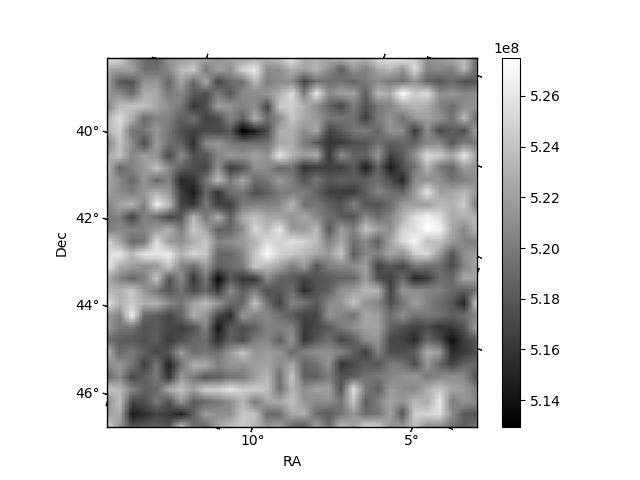
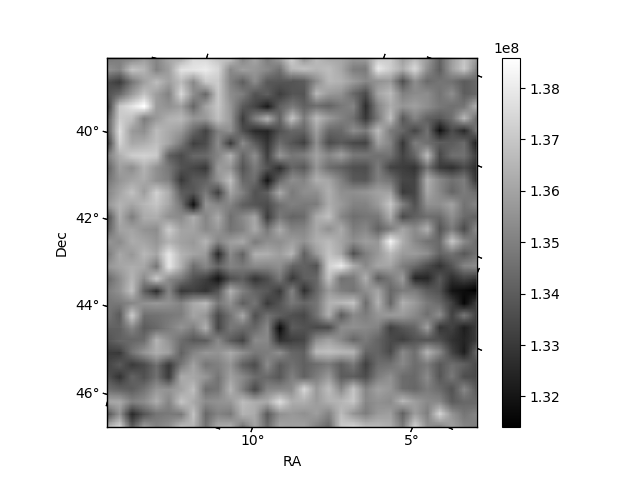
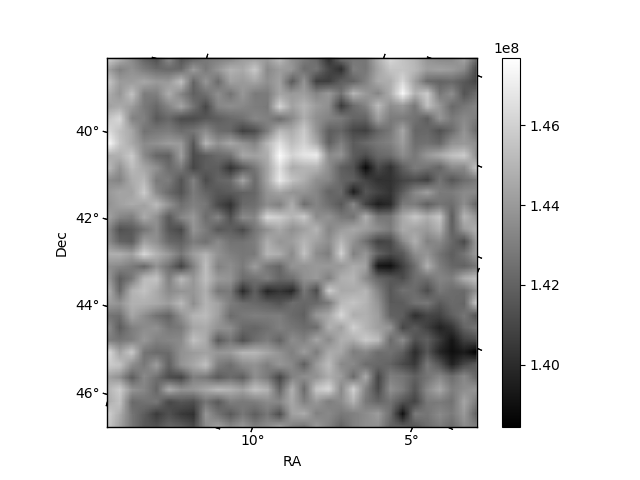
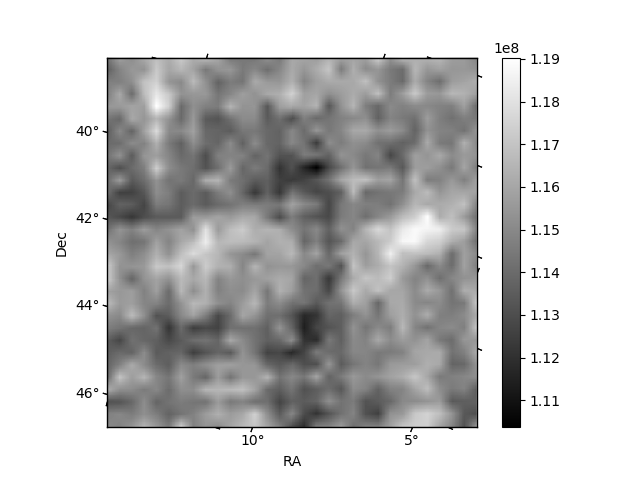
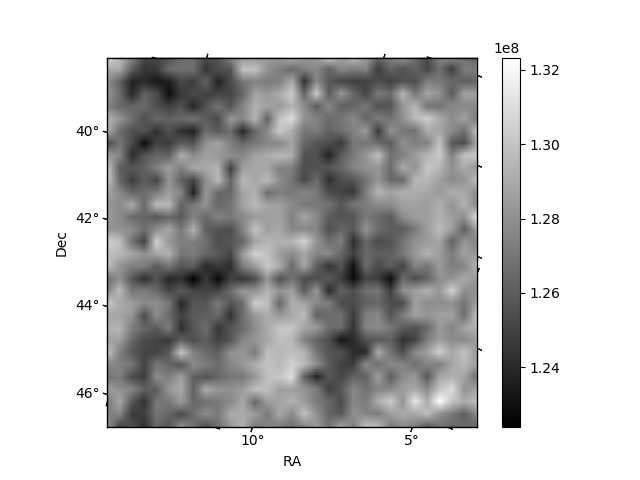
Histogram calculated using DETX and DETY for each event in the final _common_clean file
| Quadrant A | 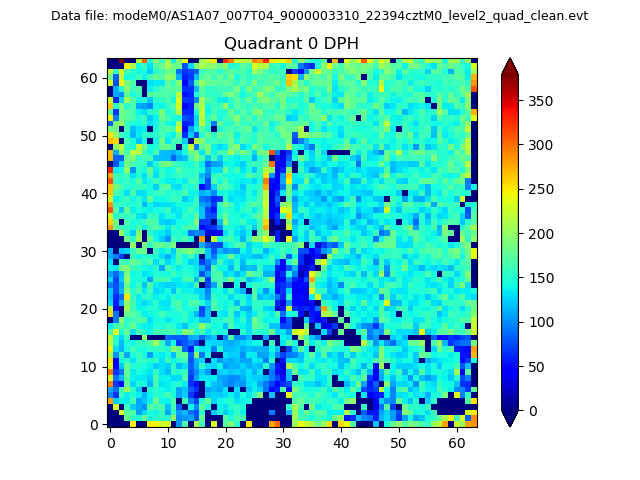 |
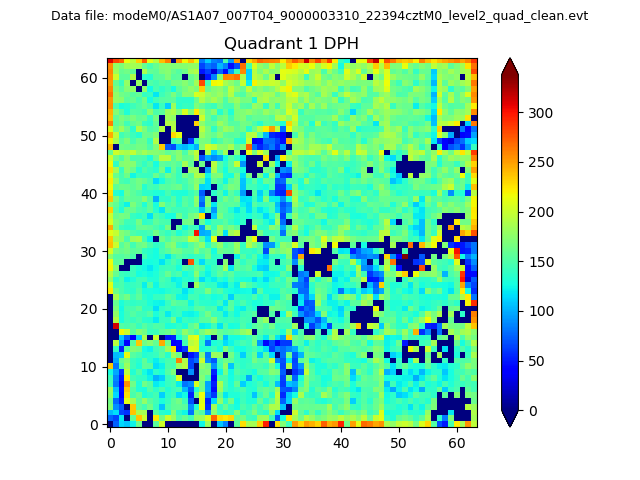 |
Quadrant B |
|---|---|---|---|
| Quadrant D | 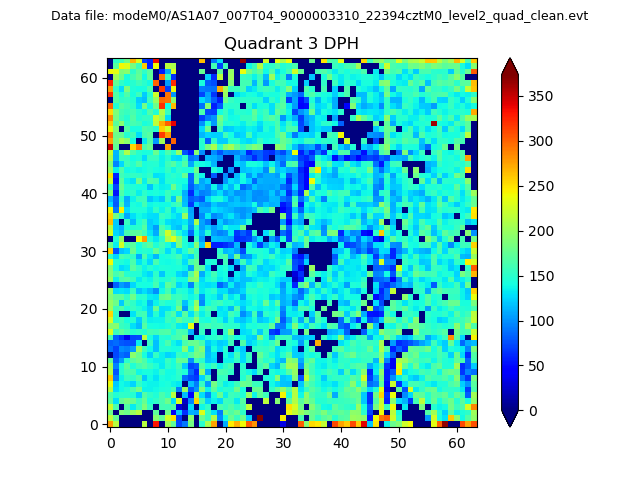 |
 |
Quadrant C |
| Plot type | Count rate plots | Images |
|---|---|---|
| Comparison with Poisson distribution Blue bars denote a histogram of data divided into 1 sec bins. Red curve is a Poisson curve with rate = median count rate of data. |
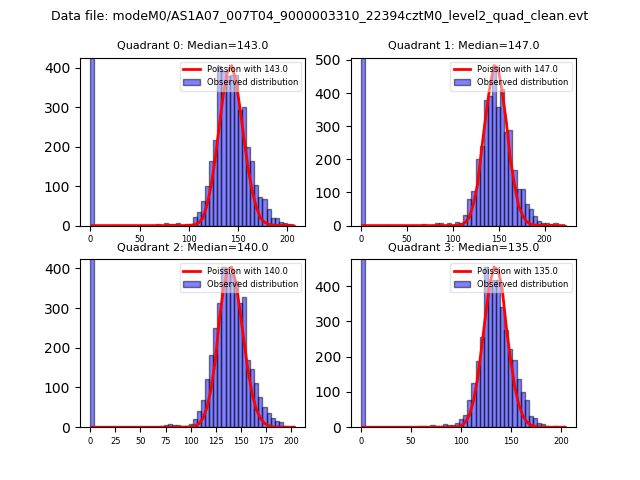 |
 |
| Quadrant-wise count rates Data is divided into 100 sec bins |
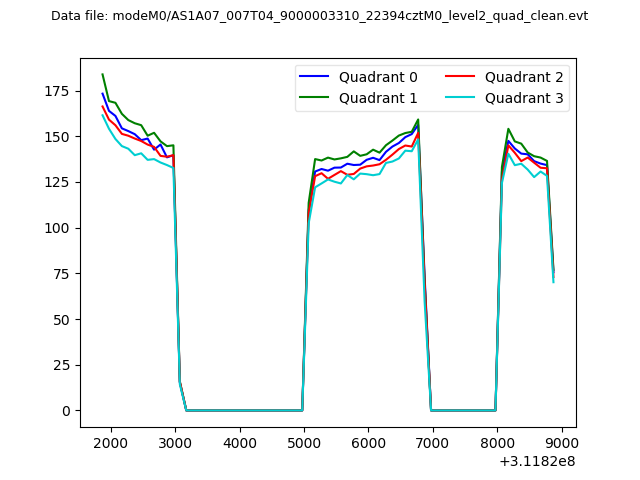 |
|
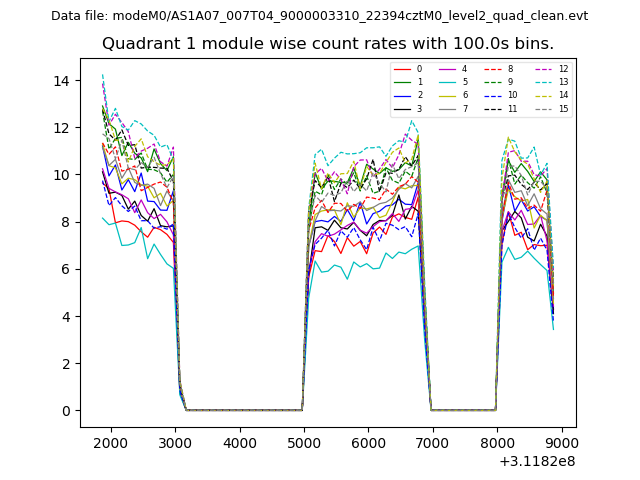
| Module-wise count rates for Quadrant A Data is divided into 100 sec bins |
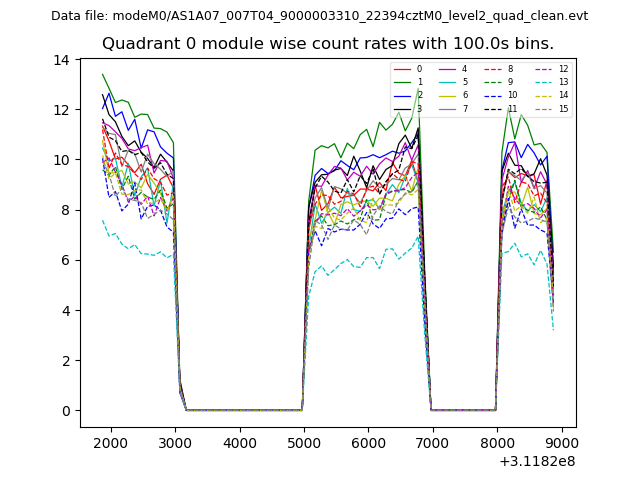 |
 |
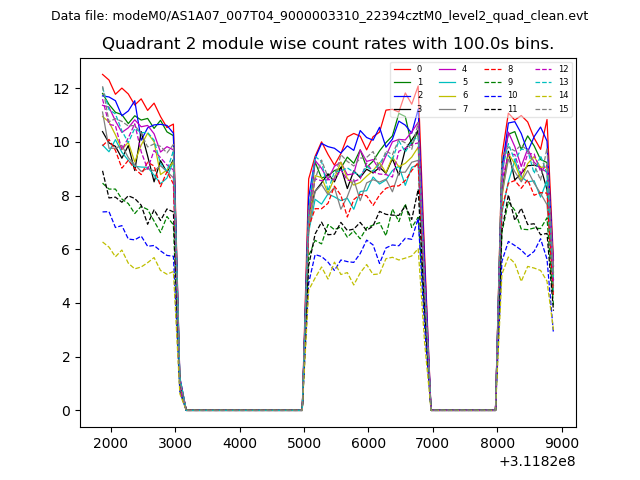
| Module-wise count rates for Quadrant B Data is divided into 100 sec bins |
 |
 |
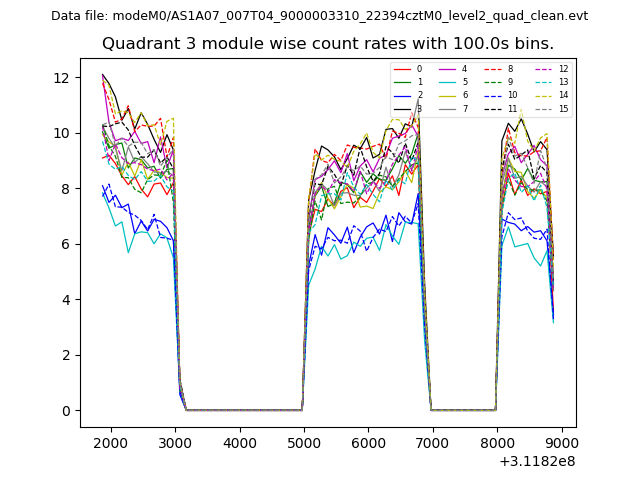
| Module-wise count rates for Quadrant C Data is divided into 100 sec bins |
 |
 |
| Module-wise count rates for Quadrant D Data is divided into 100 sec bins |
 |
 |
| Parameter | Plot |
|---|---|
| CZT HV Monitor | 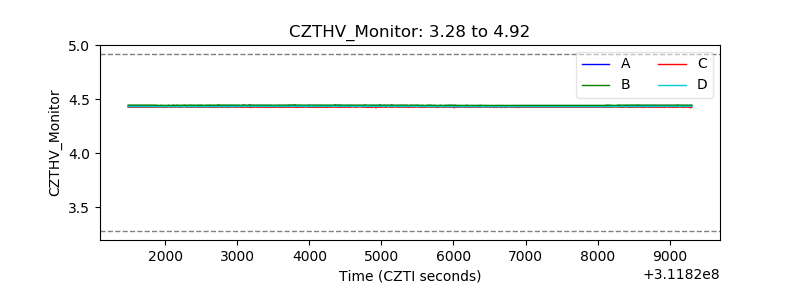 |
| D_VDD | 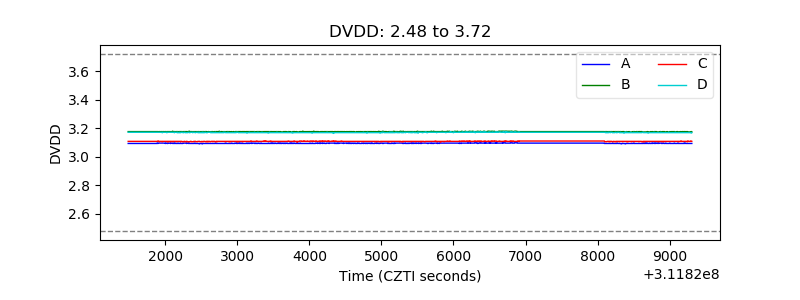 |
| Temperature 1 | 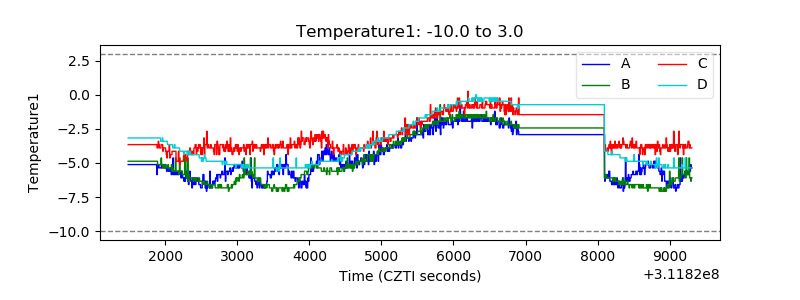 |
| Veto HV Monitor | 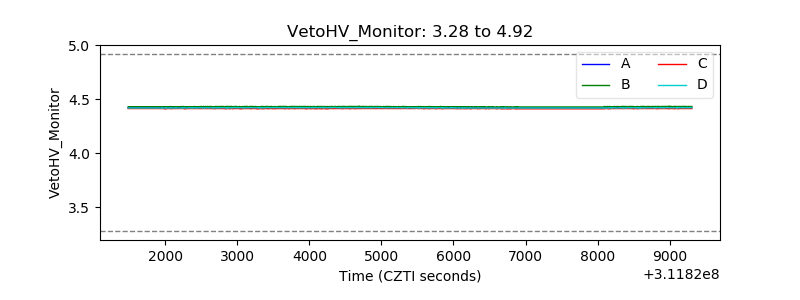 |
| Veto LLD | 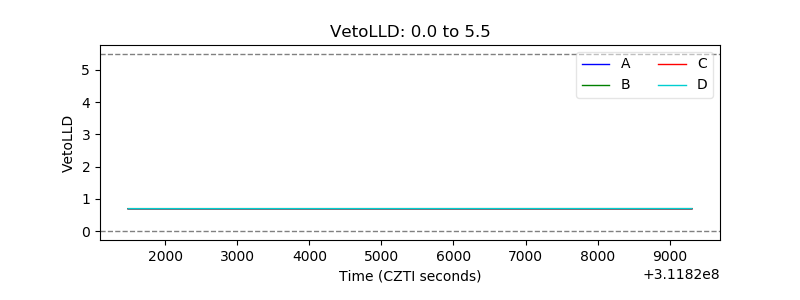 |
| Alpha Counter | 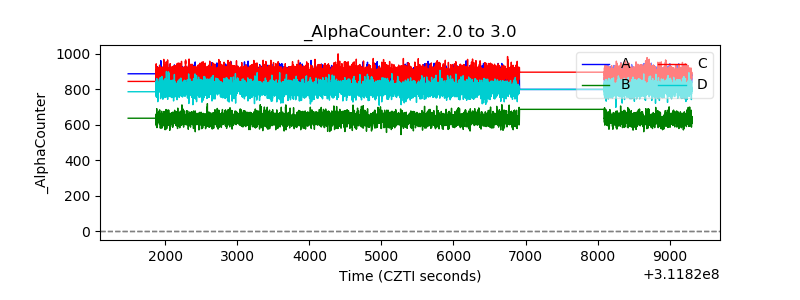 |
| _CPM_Rate | 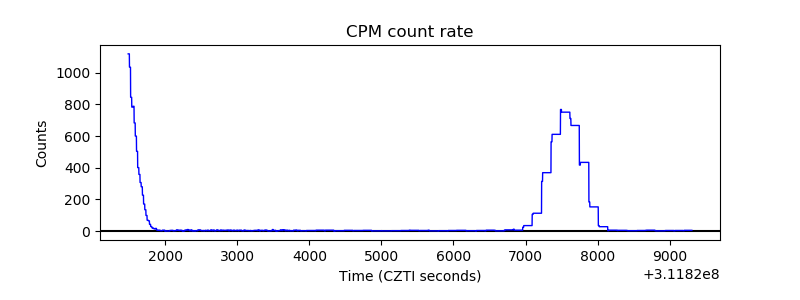 |
| CZT Counter |  |
| +2.5 Volts monitor |  |
| +5 Volts monitor | 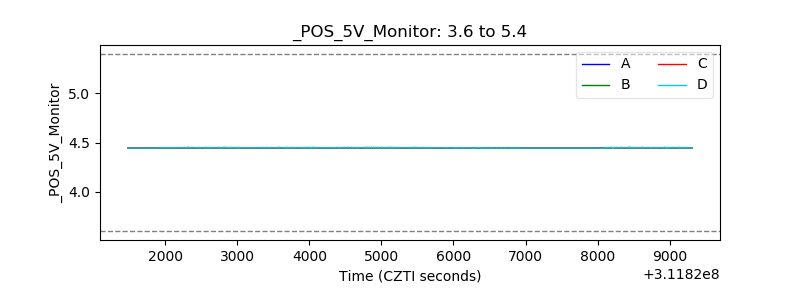 |
| _ROLL_ROT | 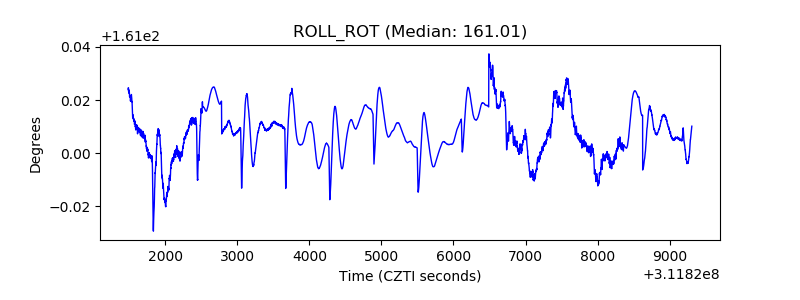 |
| _Roll_DEC | 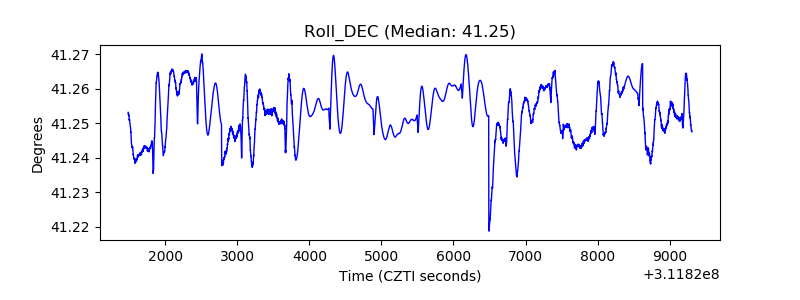 |
| _Roll_RA | 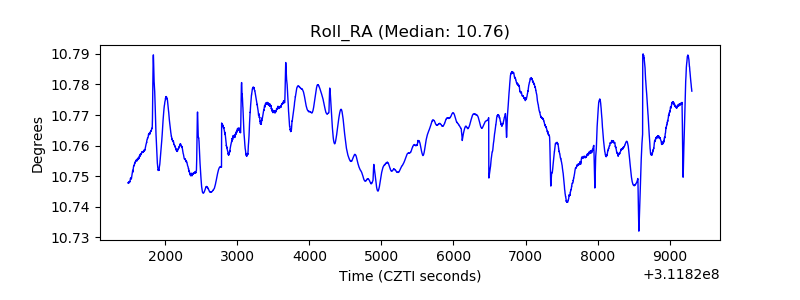 |
| Veto Counter | 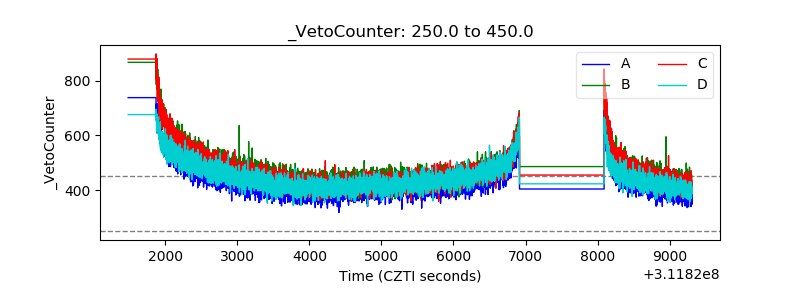 |