| Param | Original file | Final file |
|---|---|---|
| Filename | modeM0/AS1A07_007T04_9000003310_22395cztM0_level2.evt | modeM0/AS1A07_007T04_9000003310_22395cztM0_level2_quad_clean.evt |
| Size (bytes) | 494,570,880 | 90,884,160 |
| Size | 471.7 MB | 86.7 MB |
| Events in quadrant A | 3,484,827 | 570,150 |
| Events in quadrant B | 3,645,757 | 578,912 |
| Events in quadrant C | 3,555,356 | 551,431 |
| Events in quadrant D | 3,790,119 | 537,520 |
| Mode M0 | |||
|---|---|---|---|
| Quadrant | BADHDUFLAG | Total packets | Discarded packets |
| A | 0 | 15238 | 2 |
| B | 0 | 15557 | 2 |
| C | 0 | 15338 | 2 |
| D | 0 | 16186 | 2 |
| Mode SS | |||
|---|---|---|---|
| Quadrant | BADHDUFLAG | Total packets | Discarded packets |
| A | 0 | 152 | 0 |
| B | 0 | 152 | 0 |
| C | 0 | 152 | 0 |
| D | 0 | 152 | 0 |
| Mode M9 | |||
|---|---|---|---|
| Quadrant | BADHDUFLAG | Total packets | Discarded packets |
| A | 0 | 20 | 0 |
| B | 0 | 20 | 0 |
| C | 0 | 20 | 0 |
| D | 0 | 20 | 0 |
| Quadrant | Total seconds | Saturated seconds | Saturation percentage |
|---|---|---|---|
| A | 7387 | 62 | 0.839312% |
| B | 7387 | 111 | 1.502640% |
| C | 7387 | 109 | 1.475565% |
| D | 7387 | 87 | 1.177745% |
Noise dominated data is calculated using 1-second bins in cleaned event files. If a bin has >2000 counts, and if more than 50% of those come from <1% of pixels, then it is considered to be noise-dominated and hence unusable.
| Quadrant | # 1 sec bins | Bins with >0 counts | Bins with >2000 counts | High rate bins dominated by noise | Noise dominated (total time) | Noise dominated (detector-on time) | Marked lightcurve |
|---|---|---|---|---|---|---|---|
| A | 9367 | 7388 | 0 | 0 | 0.00% | 0.00% | 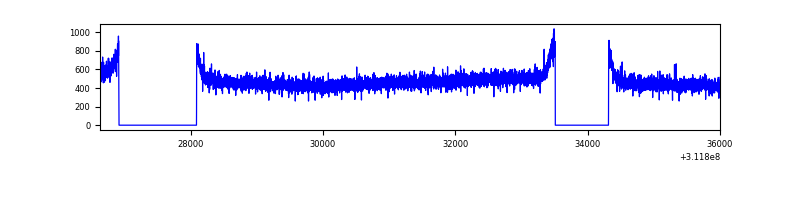 |
| B | 9367 | 7388 | 1 | 1 | 0.01% | 0.01% | 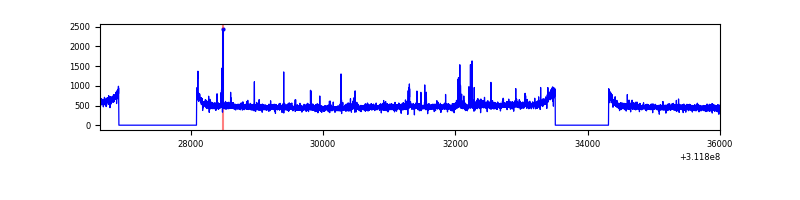 |
| C | 9367 | 7389 | 0 | 0 | 0.00% | 0.00% | 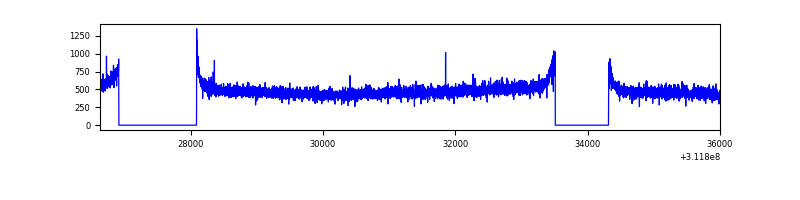 |
| D | 9367 | 7388 | 20 | 20 | 0.21% | 0.27% | 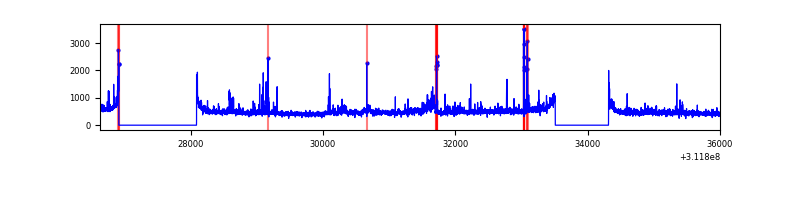 |
Top three noisy pixels from each quadrant. If the there are fewer than three noisy pixels in the level2.evt file, extra rows are filled as -1
| Pixel properties | Quadrant properties | ||||||
|---|---|---|---|---|---|---|---|
| Quadrant | DetID | PixID | Counts | Sigma | Mean | Median | Sigma |
| A | 13 | 254 | 10905 | 55.44 | 903 | 884 | 180.8 |
| A | 0 | 226 | 7769 | 38.09 | 903 | 884 | 180.8 |
| A | 3 | 137 | 7651 | 37.44 | 903 | 884 | 180.8 |
| B | 3 | 64 | 35142 | 199.36 | 908 | 883 | 171.8 |
| B | 0 | 190 | 26975 | 151.84 | 908 | 883 | 171.8 |
| B | 12 | 111 | 20886 | 116.4 | 908 | 883 | 171.8 |
| C | 14 | 238 | 138302 | 668.17 | 875 | 880 | 205.7 |
| C | 0 | 10 | 6461 | 27.14 | 875 | 880 | 205.7 |
| C | 13 | 61 | 6076 | 25.26 | 875 | 880 | 205.7 |
| D | 2 | 136 | 159155 | 750.62 | 877 | 852 | 210.9 |
| D | 12 | 227 | 140284 | 661.14 | 877 | 852 | 210.9 |
| D | 1 | 52 | 86263 | 404.99 | 877 | 852 | 210.9 |
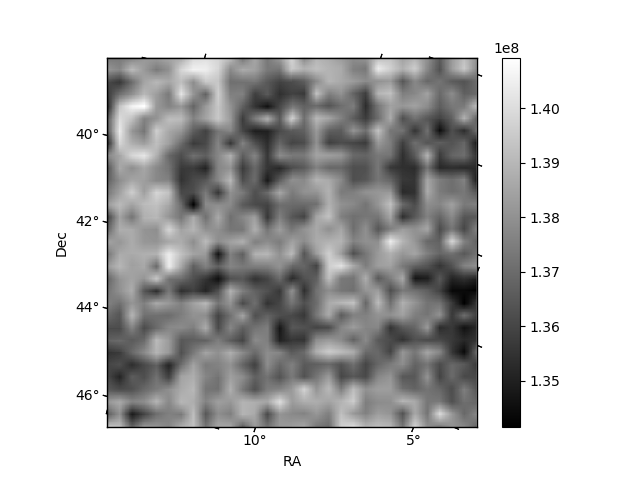
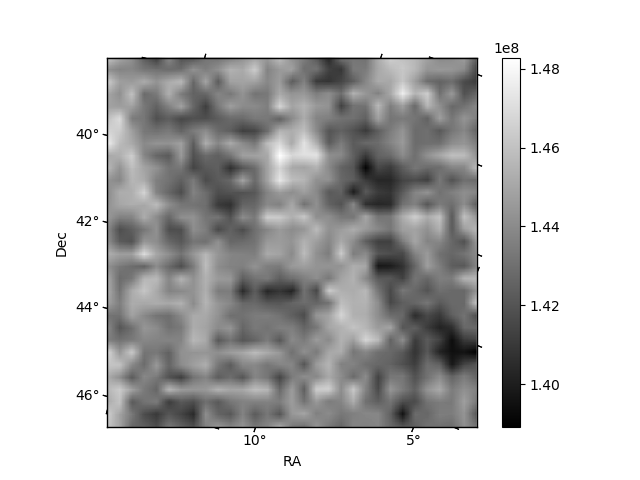
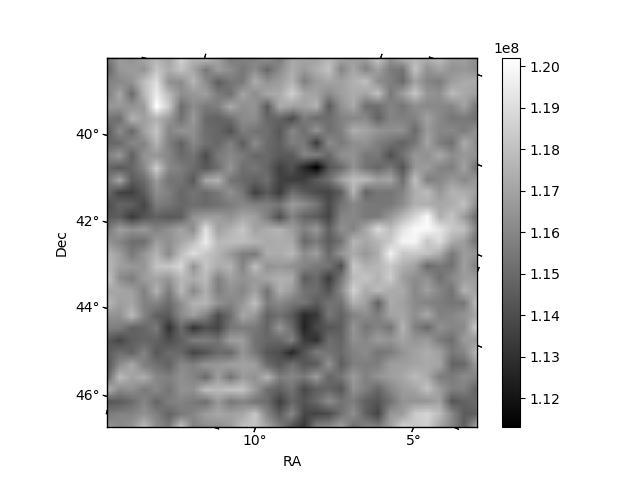
Histogram calculated using DETX and DETY for each event in the final _common_clean file
| Quadrant A | 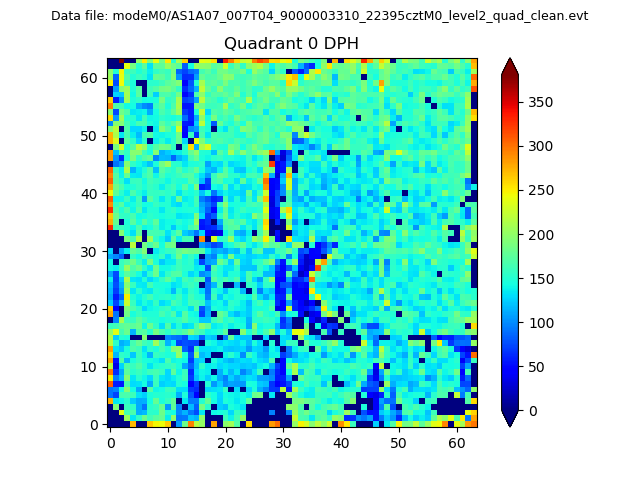 |
 |
Quadrant B |
|---|---|---|---|
| Quadrant D | 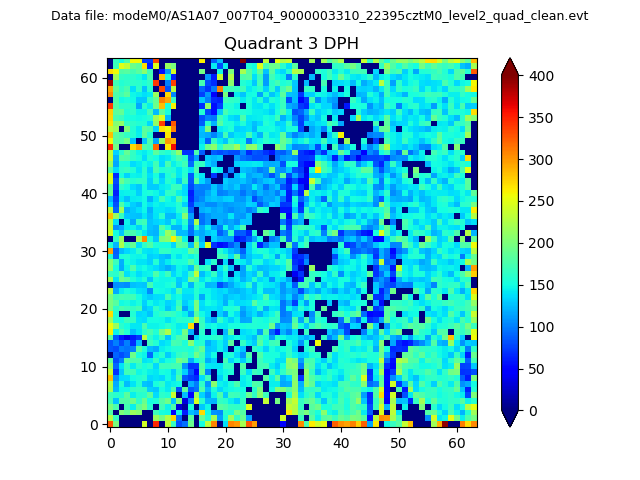 |
 |
Quadrant C |
| Plot type | Count rate plots | Images |
|---|---|---|
| Comparison with Poisson distribution Blue bars denote a histogram of data divided into 1 sec bins. Red curve is a Poisson curve with rate = median count rate of data. |
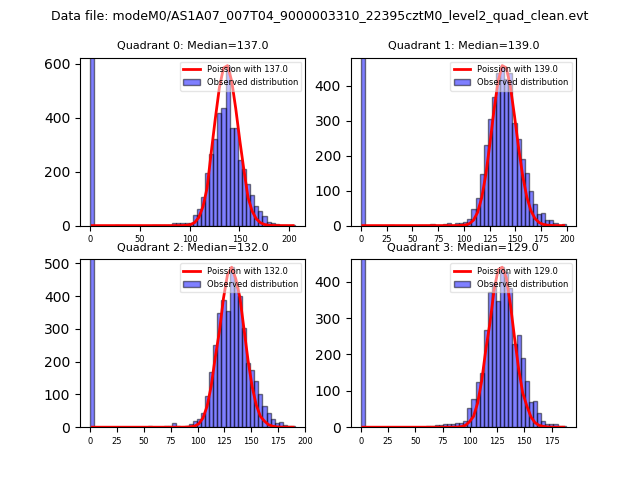 |
 |
| Quadrant-wise count rates Data is divided into 100 sec bins |
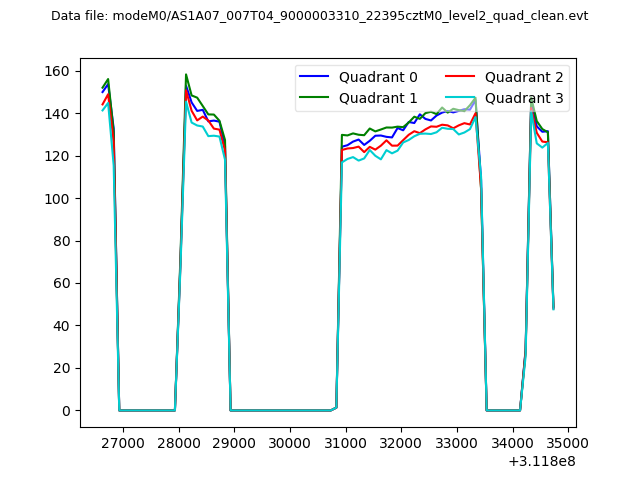 |
|
| Module-wise count rates for Quadrant A Data is divided into 100 sec bins |
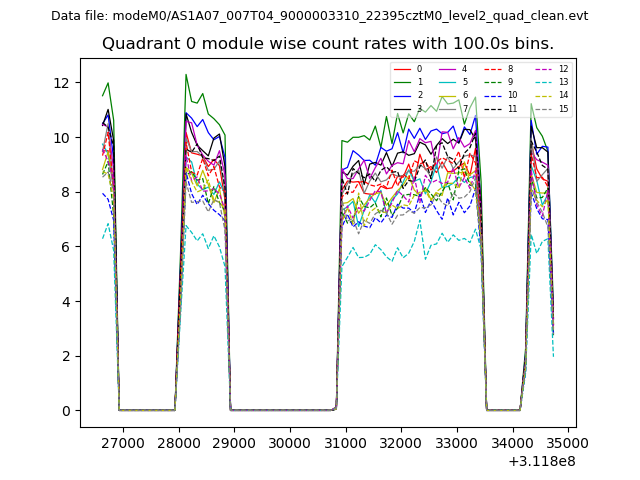 |
 |
| Module-wise count rates for Quadrant B Data is divided into 100 sec bins |
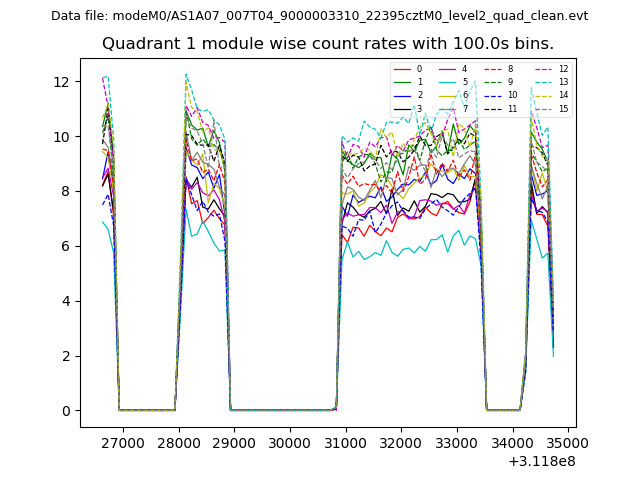 |
 |
| Module-wise count rates for Quadrant C Data is divided into 100 sec bins |
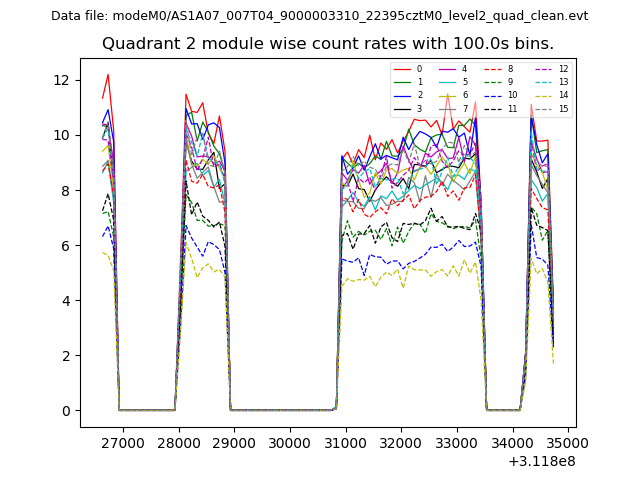 |
 |
| Module-wise count rates for Quadrant D Data is divided into 100 sec bins |
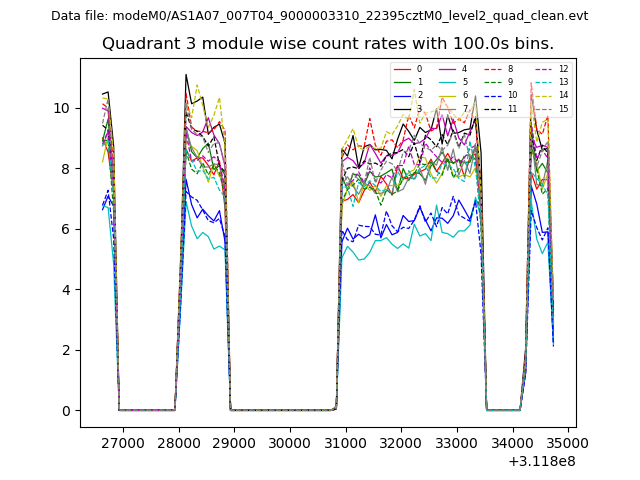 |
 |
| Parameter | Plot |
|---|---|
| CZT HV Monitor | 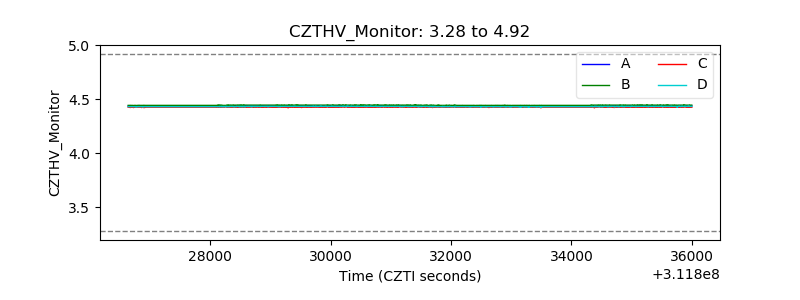 |
| D_VDD | 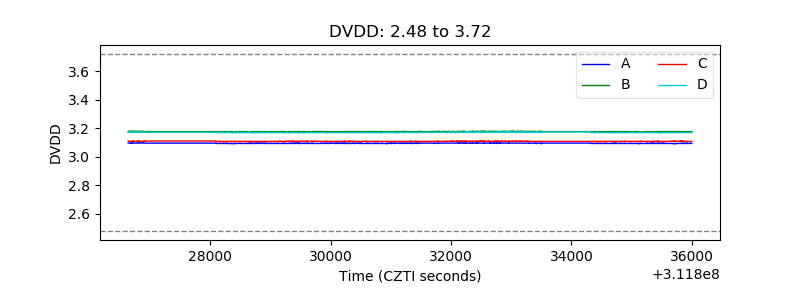 |
| Temperature 1 |  |
| Veto HV Monitor | 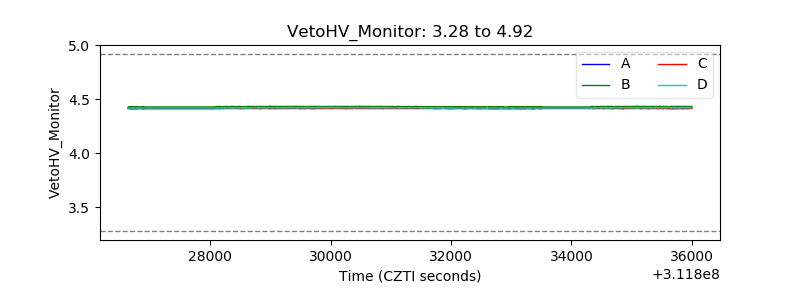 |
| Veto LLD | 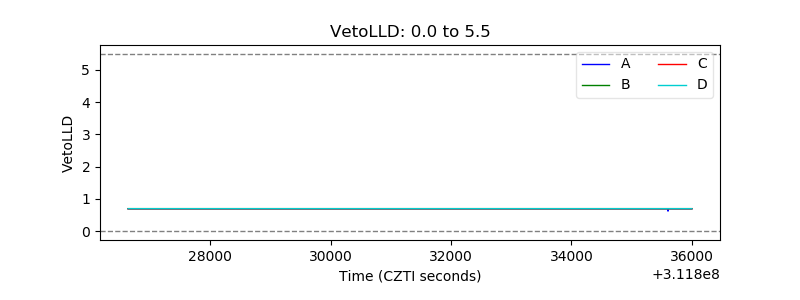 |
| Alpha Counter | 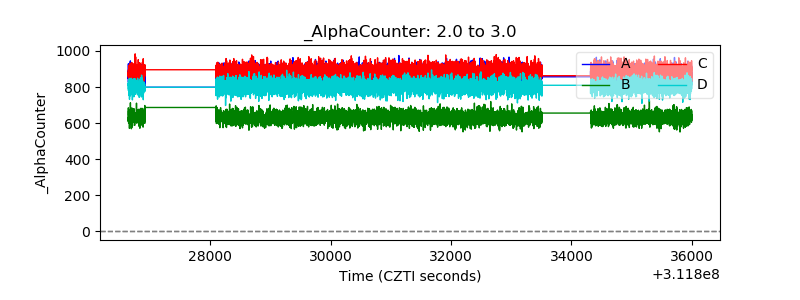 |
| _CPM_Rate | 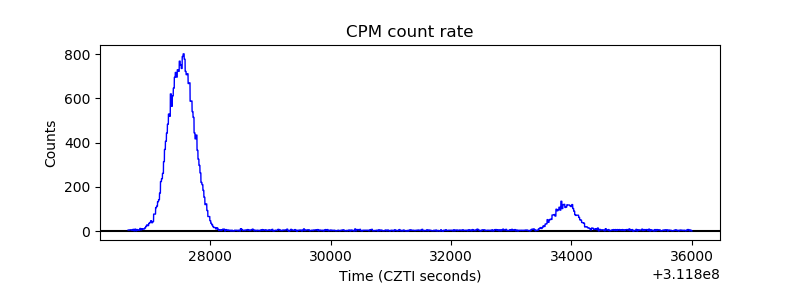 |
| CZT Counter | 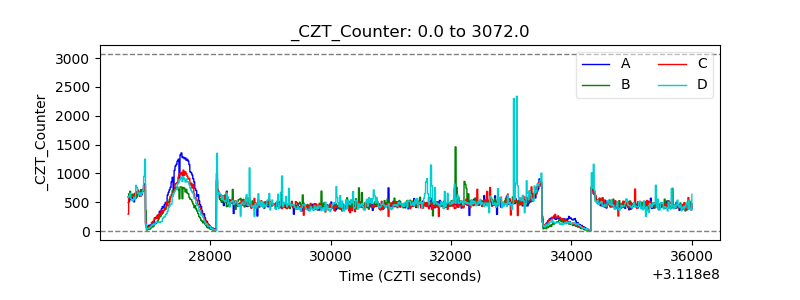 |
| +2.5 Volts monitor |  |
| +5 Volts monitor | 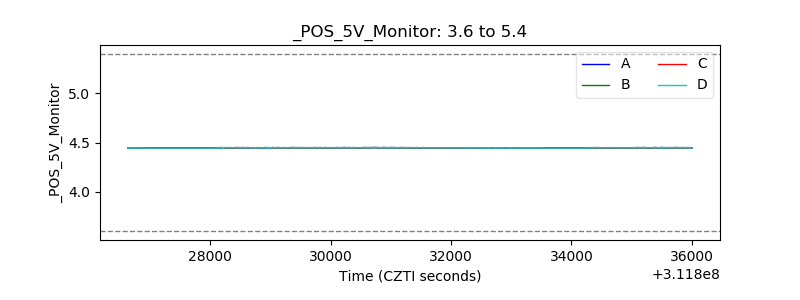 |
| _ROLL_ROT | 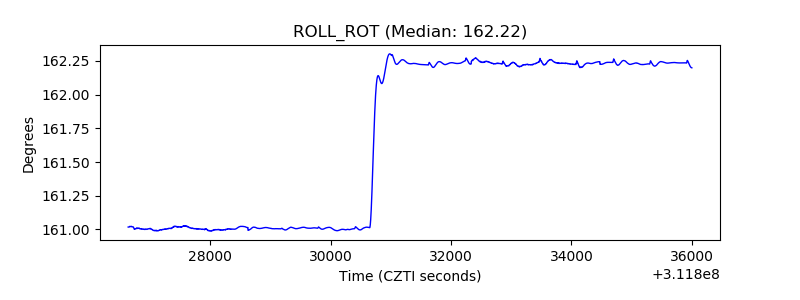 |
| _Roll_DEC | 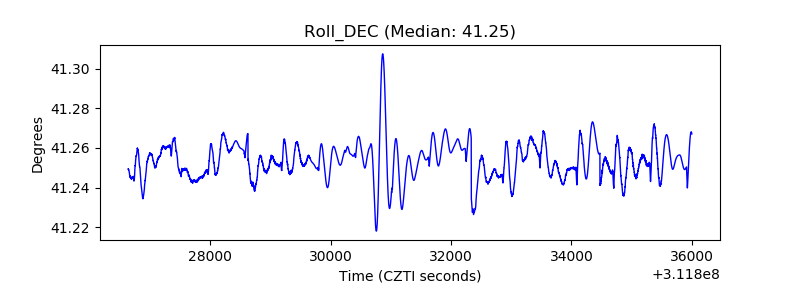 |
| _Roll_RA | 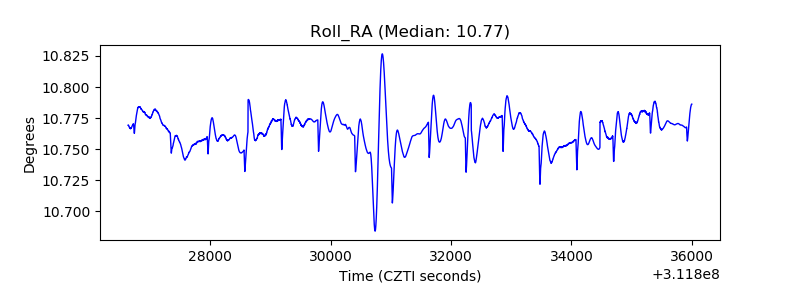 |
| Veto Counter | 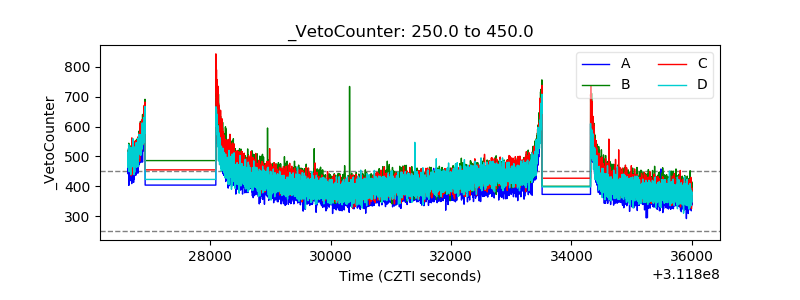 |