| Param | Original file | Final file |
|---|---|---|
| Filename | modeM0/AS1A07_007T04_9000003310_22397cztM0_level2.evt | modeM0/AS1A07_007T04_9000003310_22397cztM0_level2_quad_clean.evt |
| Size (bytes) | 504,630,720 | 80,668,800 |
| Size | 481.3 MB | 76.9 MB |
| Events in quadrant A | 3,575,570 | 484,972 |
| Events in quadrant B | 3,693,974 | 490,378 |
| Events in quadrant C | 3,663,472 | 470,833 |
| Events in quadrant D | 3,827,202 | 462,267 |
| Mode M0 | |||
|---|---|---|---|
| Quadrant | BADHDUFLAG | Total packets | Discarded packets |
| A | 0 | 15849 | 0 |
| B | 0 | 16003 | 0 |
| C | 0 | 15926 | 0 |
| D | 0 | 16602 | 0 |
| Mode SS | |||
|---|---|---|---|
| Quadrant | BADHDUFLAG | Total packets | Discarded packets |
| A | 0 | 154 | 0 |
| B | 0 | 154 | 0 |
| C | 0 | 154 | 0 |
| D | 0 | 154 | 0 |
| Quadrant | Total seconds | Saturated seconds | Saturation percentage |
|---|---|---|---|
| A | 7681 | 308 | 4.009895% |
| B | 7682 | 337 | 4.386878% |
| C | 7682 | 335 | 4.360844% |
| D | 7682 | 280 | 3.644884% |
Noise dominated data is calculated using 1-second bins in cleaned event files. If a bin has >2000 counts, and if more than 50% of those come from <1% of pixels, then it is considered to be noise-dominated and hence unusable.
| Quadrant | # 1 sec bins | Bins with >0 counts | Bins with >2000 counts | High rate bins dominated by noise | Noise dominated (total time) | Noise dominated (detector-on time) | Marked lightcurve |
|---|---|---|---|---|---|---|---|
| A | 7681 | 7681 | 0 | 0 | 0.00% | 0.00% | 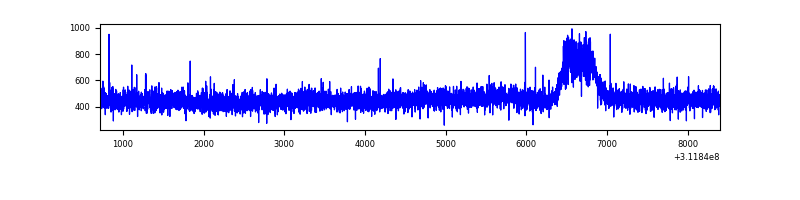 |
| B | 7682 | 7682 | 4 | 4 | 0.05% | 0.05% | 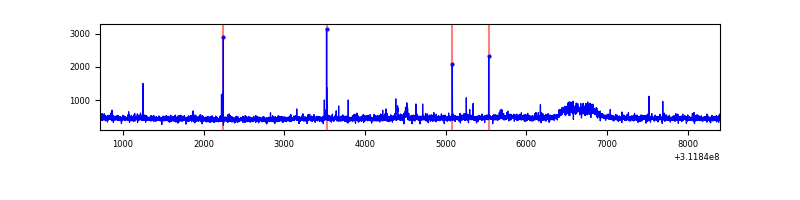 |
| C | 7682 | 7682 | 0 | 0 | 0.00% | 0.00% | 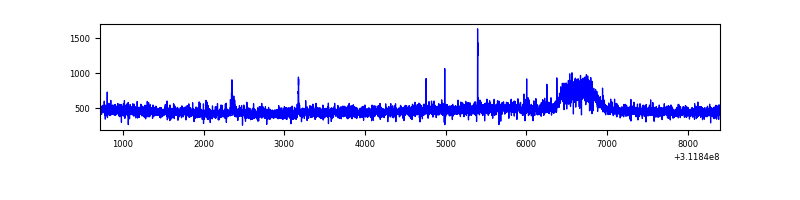 |
| D | 7682 | 7682 | 17 | 17 | 0.22% | 0.22% | 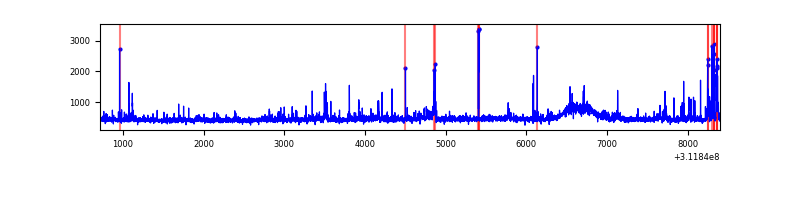 |
Top three noisy pixels from each quadrant. If the there are fewer than three noisy pixels in the level2.evt file, extra rows are filled as -1
| Pixel properties | Quadrant properties | ||||||
|---|---|---|---|---|---|---|---|
| Quadrant | DetID | PixID | Counts | Sigma | Mean | Median | Sigma |
| A | 13 | 254 | 10343 | 49.99 | 926 | 903 | 188.8 |
| A | 3 | 137 | 8452 | 39.98 | 926 | 903 | 188.8 |
| A | 0 | 226 | 7956 | 37.35 | 926 | 903 | 188.8 |
| B | 3 | 64 | 26690 | 144.55 | 925 | 898 | 178.4 |
| B | 12 | 111 | 22376 | 120.37 | 925 | 898 | 178.4 |
| B | 11 | 111 | 19890 | 106.44 | 925 | 898 | 178.4 |
| C | 14 | 238 | 140546 | 662.78 | 896 | 900 | 210.7 |
| C | 0 | 239 | 14495 | 64.52 | 896 | 900 | 210.7 |
| C | 10 | 22 | 13024 | 57.54 | 896 | 900 | 210.7 |
| D | 1 | 52 | 155849 | 705.97 | 906 | 878 | 219.5 |
| D | 2 | 136 | 130803 | 591.87 | 906 | 878 | 219.5 |
| D | 7 | 223 | 68111 | 306.28 | 906 | 878 | 219.5 |
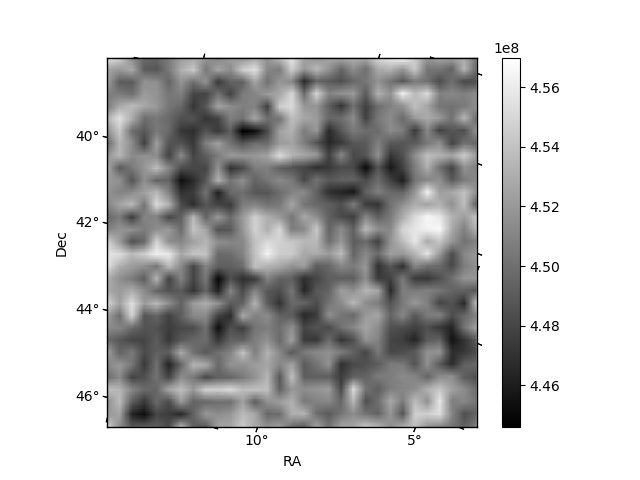
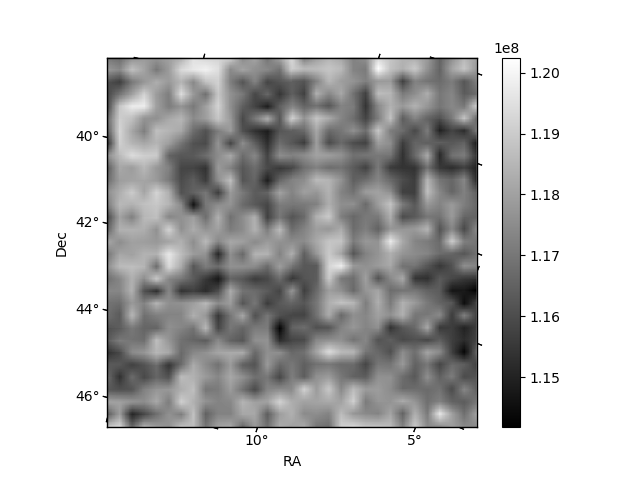
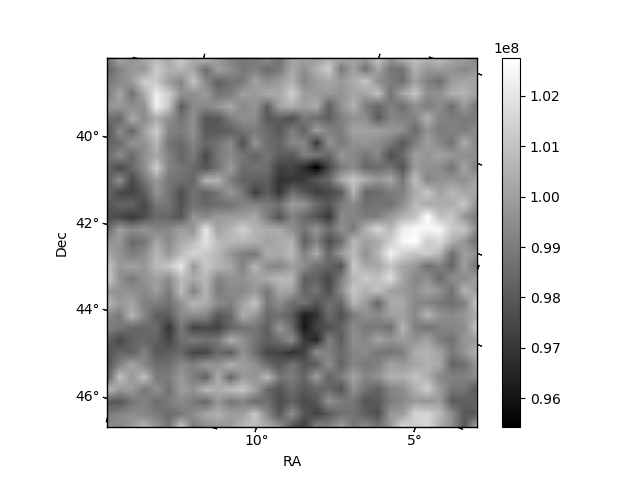
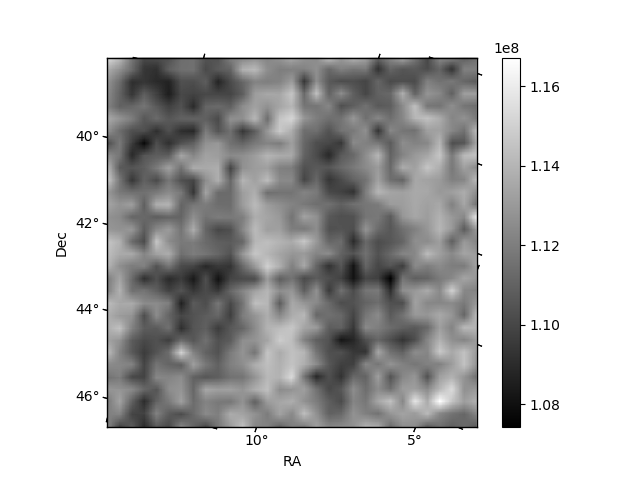
Histogram calculated using DETX and DETY for each event in the final _common_clean file
| Quadrant A | 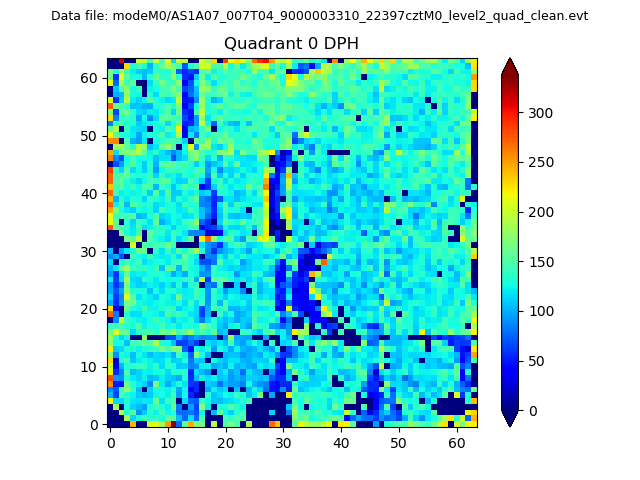 |
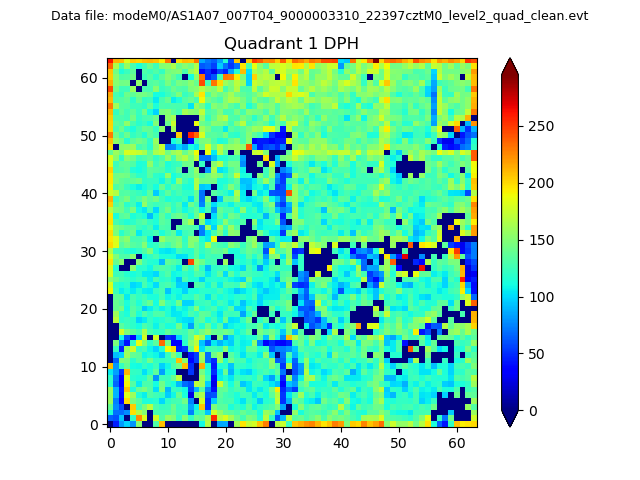 |
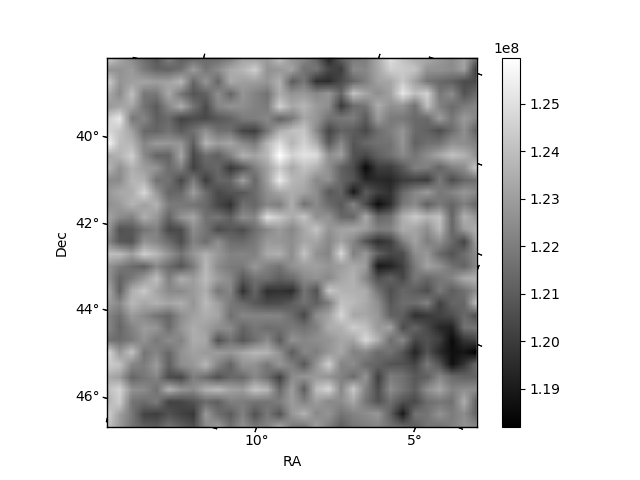
Quadrant B |
|---|---|---|---|
| Quadrant D | 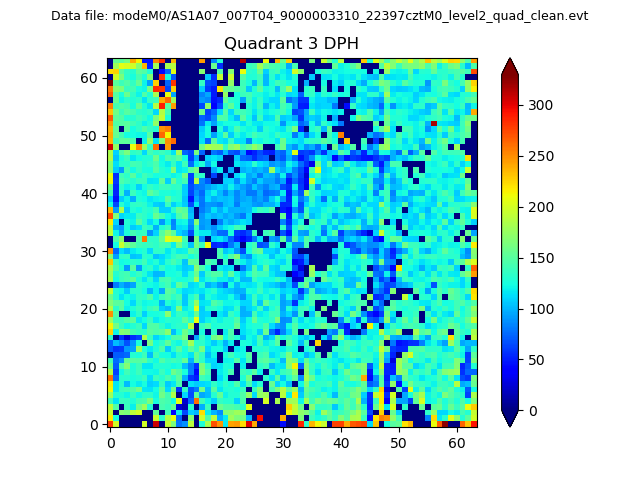 |
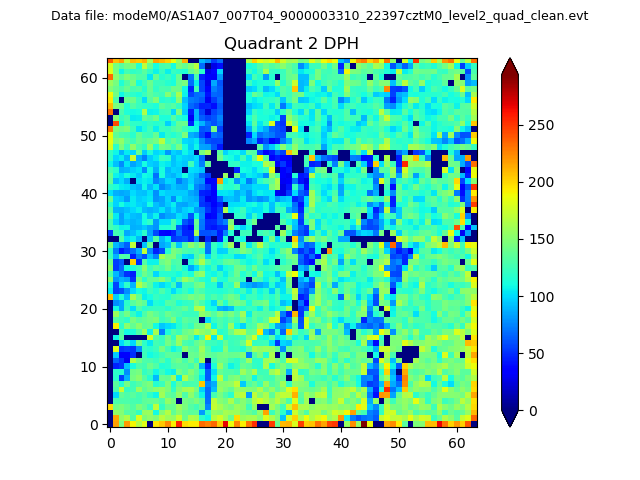 |
Quadrant C |
| Plot type | Count rate plots | Images |
|---|---|---|
| Comparison with Poisson distribution Blue bars denote a histogram of data divided into 1 sec bins. Red curve is a Poisson curve with rate = median count rate of data. |
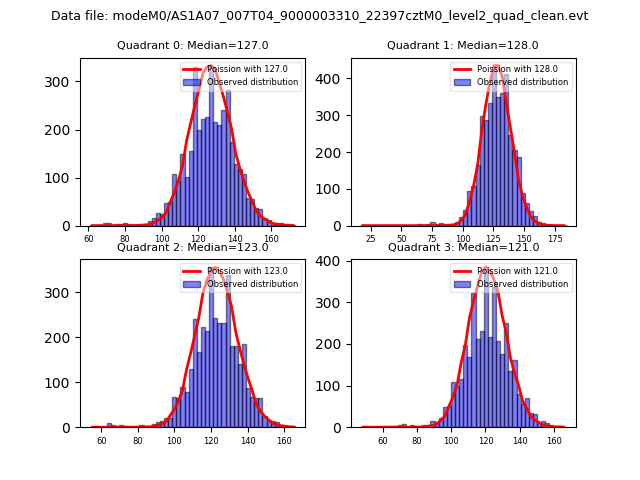 |
 |
| Quadrant-wise count rates Data is divided into 100 sec bins |
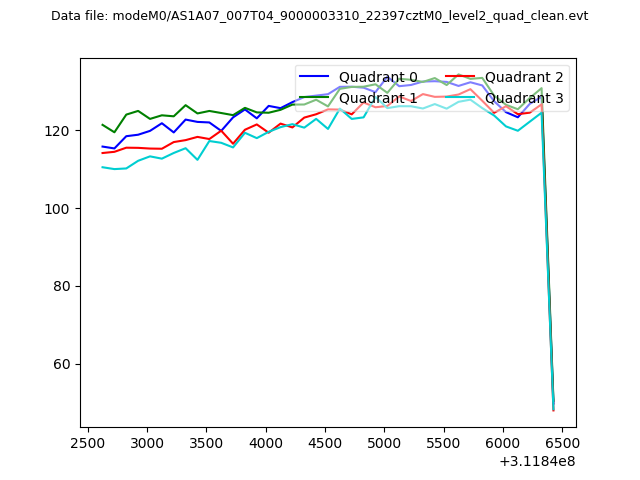 |
|
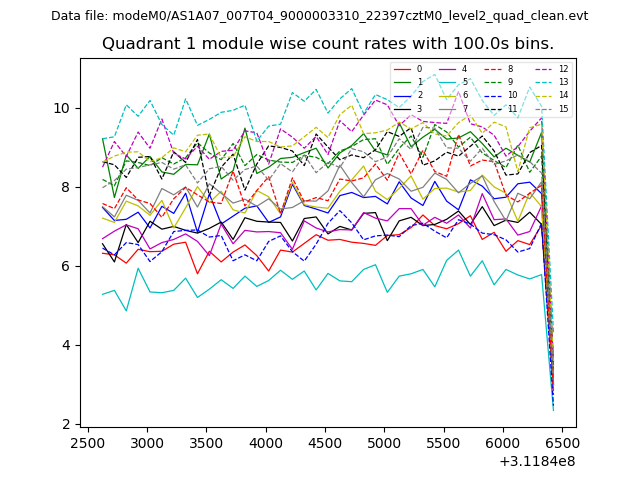
| Module-wise count rates for Quadrant A Data is divided into 100 sec bins |
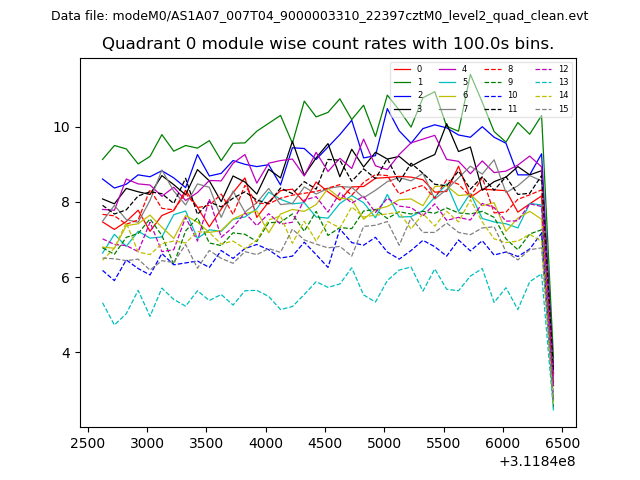 |
 |
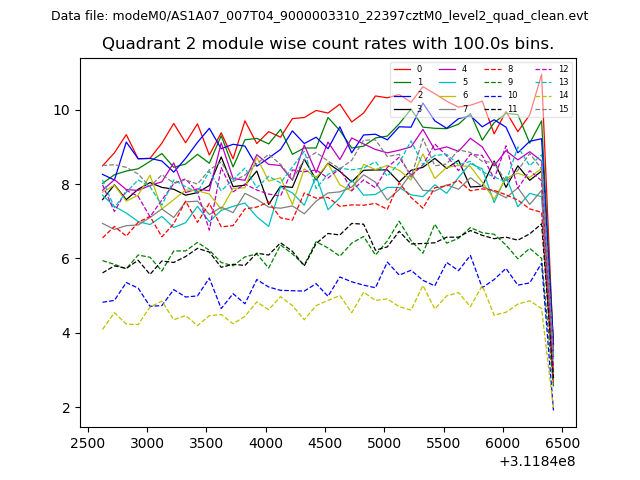
| Module-wise count rates for Quadrant B Data is divided into 100 sec bins |
 |
 |
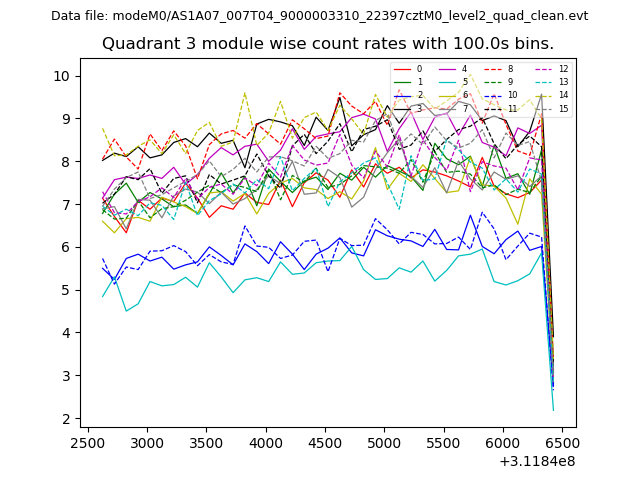
| Module-wise count rates for Quadrant C Data is divided into 100 sec bins |
 |
 |
| Module-wise count rates for Quadrant D Data is divided into 100 sec bins |
 |
 |
| Parameter | Plot |
|---|---|
| CZT HV Monitor | 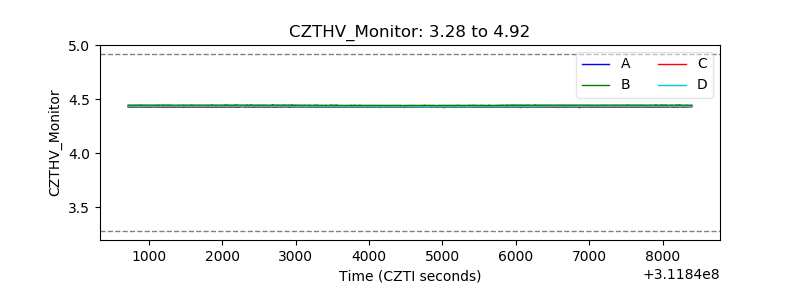 |
| D_VDD | 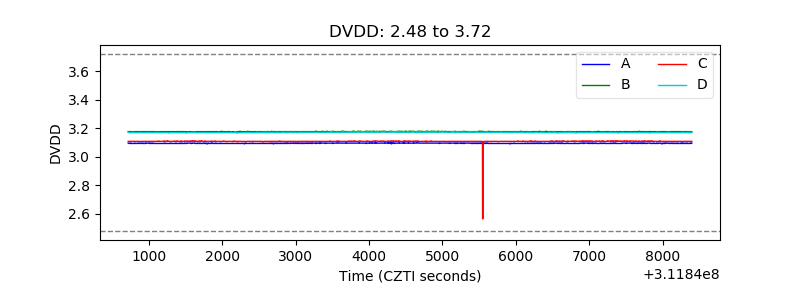 |
| Temperature 1 | 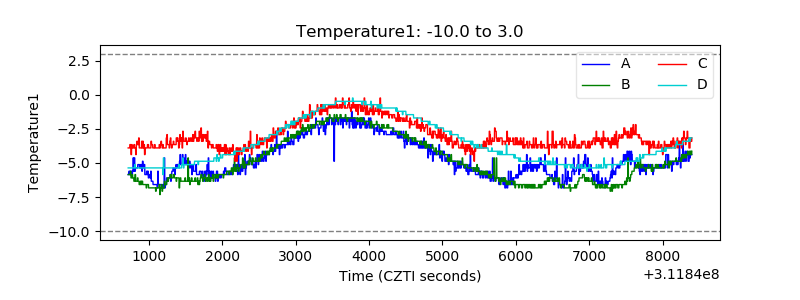 |
| Veto HV Monitor | 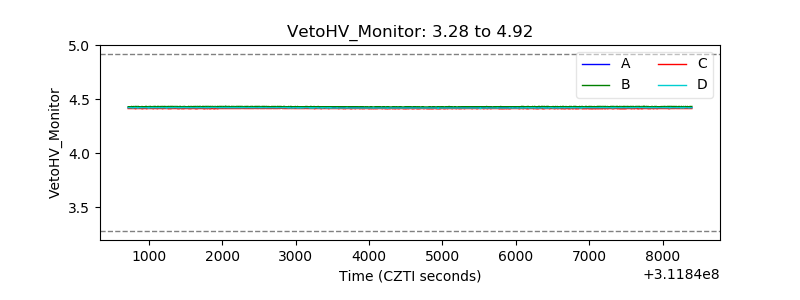 |
| Veto LLD | 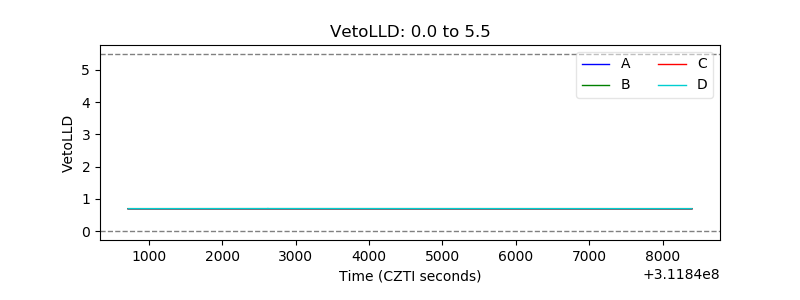 |
| Alpha Counter | 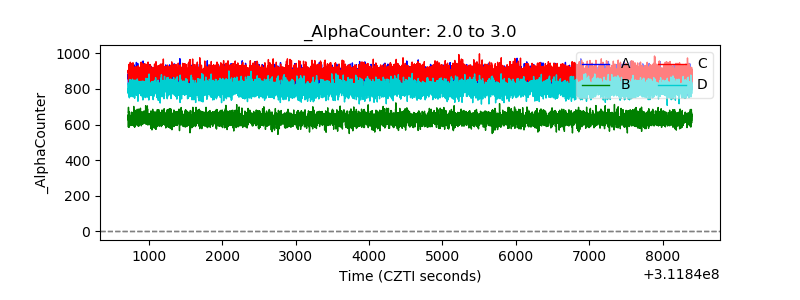 |
| _CPM_Rate | 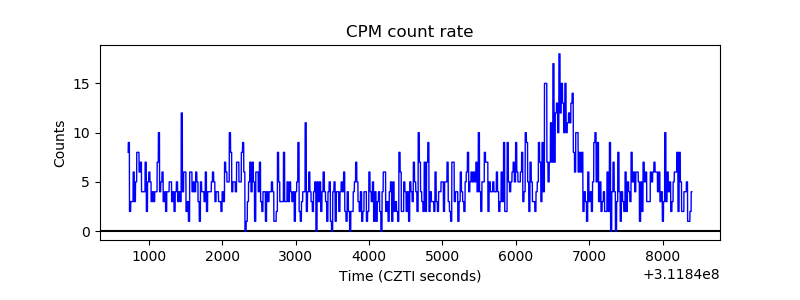 |
| CZT Counter | 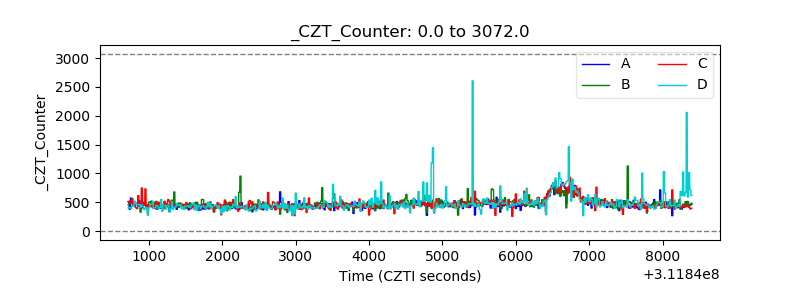 |
| +2.5 Volts monitor |  |
| +5 Volts monitor |  |
| _ROLL_ROT | 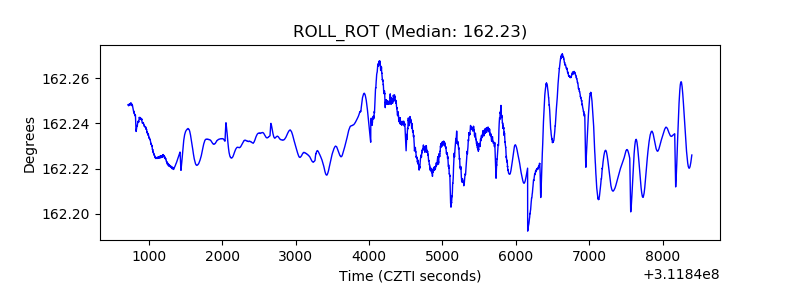 |
| _Roll_DEC | 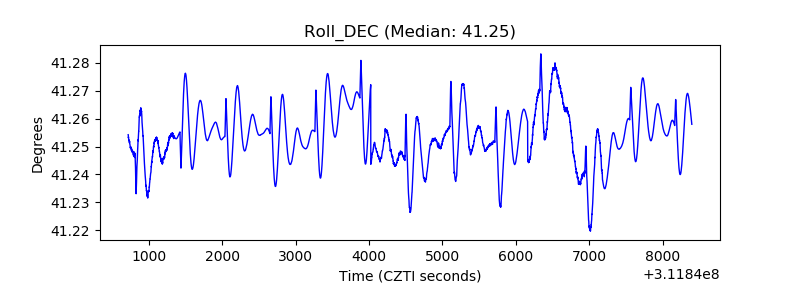 |
| _Roll_RA | 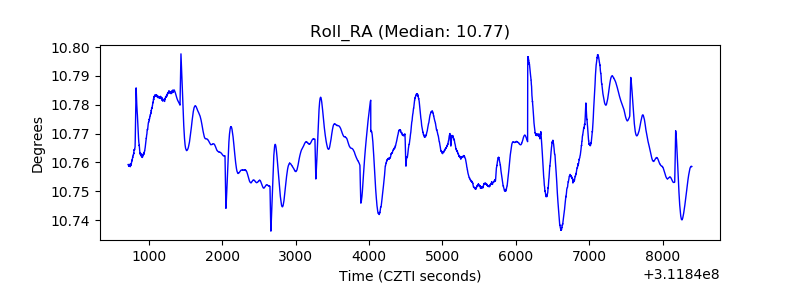 |
| Veto Counter | 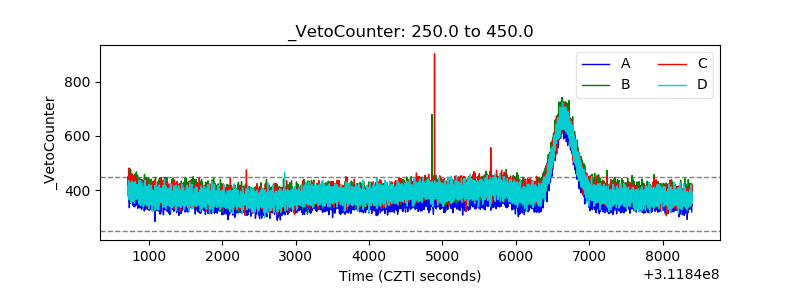 |