| Param | Original file | Final file |
|---|---|---|
| Filename | modeM0/AS1A07_007T04_9000003310_22398cztM0_level2.evt | modeM0/AS1A07_007T04_9000003310_22398cztM0_level2_quad_clean.evt |
| Size (bytes) | 585,817,920 | 101,177,280 |
| Size | 558.7 MB | 96.5 MB |
| Events in quadrant A | 4,125,510 | 624,016 |
| Events in quadrant B | 4,268,180 | 631,864 |
| Events in quadrant C | 4,194,507 | 607,307 |
| Events in quadrant D | 4,562,532 | 597,056 |
| Mode M0 | |||
|---|---|---|---|
| Quadrant | BADHDUFLAG | Total packets | Discarded packets |
| A | 0 | 18066 | 1 |
| B | 0 | 18274 | 1 |
| C | 0 | 18131 | 2 |
| D | 0 | 19318 | 1 |
| Mode SS | |||
|---|---|---|---|
| Quadrant | BADHDUFLAG | Total packets | Discarded packets |
| A | 0 | 174 | 0 |
| B | 0 | 174 | 0 |
| C | 0 | 174 | 0 |
| D | 0 | 174 | 0 |
| Mode M9 | |||
|---|---|---|---|
| Quadrant | BADHDUFLAG | Total packets | Discarded packets |
| A | 0 | 4 | 0 |
| B | 0 | 4 | 0 |
| C | 0 | 4 | 0 |
| D | 0 | 4 | 0 |
| Quadrant | Total seconds | Saturated seconds | Saturation percentage |
|---|---|---|---|
| A | 8701 | 396 | 4.551201% |
| B | 8702 | 439 | 5.044817% |
| C | 8701 | 424 | 4.873003% |
| D | 8701 | 360 | 4.137455% |
Noise dominated data is calculated using 1-second bins in cleaned event files. If a bin has >2000 counts, and if more than 50% of those come from <1% of pixels, then it is considered to be noise-dominated and hence unusable.
| Quadrant | # 1 sec bins | Bins with >0 counts | Bins with >2000 counts | High rate bins dominated by noise | Noise dominated (total time) | Noise dominated (detector-on time) | Marked lightcurve |
|---|---|---|---|---|---|---|---|
| A | 9031 | 8701 | 0 | 0 | 0.00% | 0.00% | 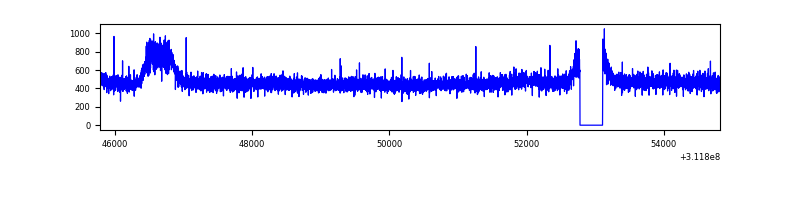 |
| B | 9032 | 8702 | 9 | 9 | 0.10% | 0.10% | 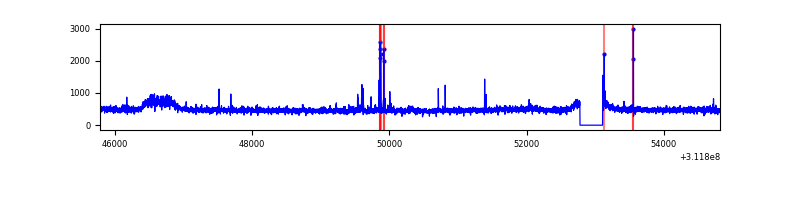 |
| C | 9031 | 8702 | 0 | 0 | 0.00% | 0.00% | 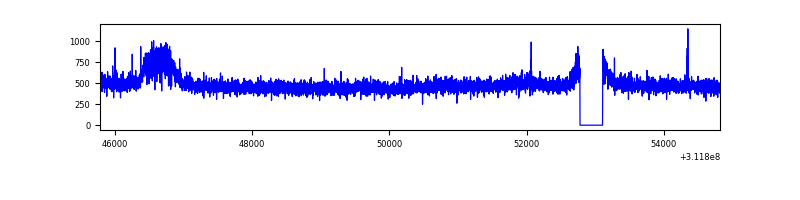 |
| D | 9031 | 8702 | 29 | 29 | 0.32% | 0.33% | 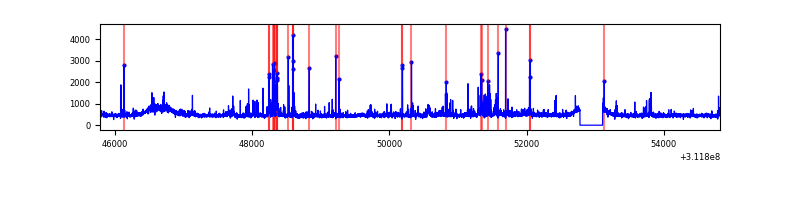 |
Top three noisy pixels from each quadrant. If the there are fewer than three noisy pixels in the level2.evt file, extra rows are filled as -1
| Pixel properties | Quadrant properties | ||||||
|---|---|---|---|---|---|---|---|
| Quadrant | DetID | PixID | Counts | Sigma | Mean | Median | Sigma |
| A | 13 | 254 | 12692 | 53.71 | 1068 | 1041 | 216.9 |
| A | 3 | 137 | 9846 | 40.59 | 1068 | 1041 | 216.9 |
| A | 0 | 226 | 9202 | 37.62 | 1068 | 1041 | 216.9 |
| B | 3 | 64 | 31542 | 149.83 | 1062 | 1028 | 203.7 |
| B | 0 | 228 | 28401 | 134.41 | 1062 | 1028 | 203.7 |
| B | 12 | 111 | 25469 | 120.01 | 1062 | 1028 | 203.7 |
| C | 14 | 238 | 160012 | 655.21 | 1029 | 1032 | 242.6 |
| C | 0 | 239 | 14851 | 56.95 | 1029 | 1032 | 242.6 |
| C | 10 | 22 | 7616 | 27.13 | 1029 | 1032 | 242.6 |
| D | 1 | 52 | 246385 | 966.43 | 1043 | 1010 | 253.9 |
| D | 2 | 136 | 161256 | 631.14 | 1043 | 1010 | 253.9 |
| D | 7 | 223 | 111028 | 433.32 | 1043 | 1010 | 253.9 |
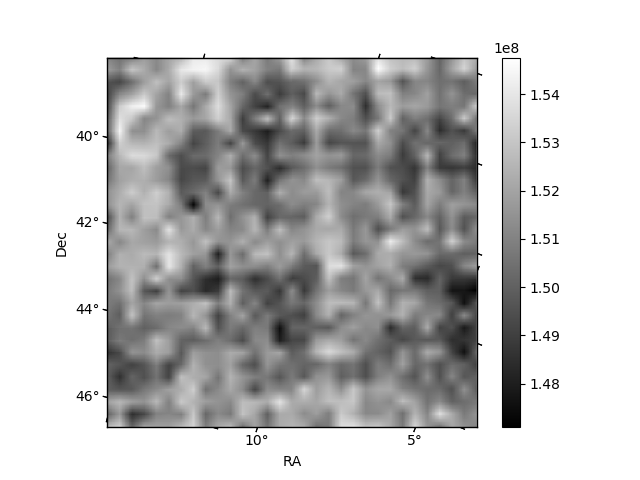
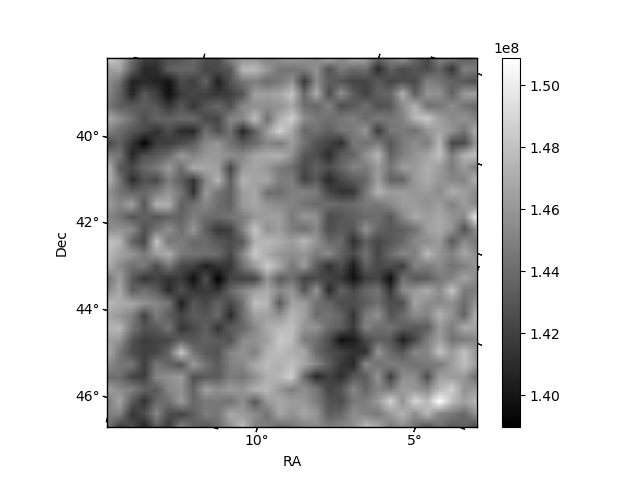
Histogram calculated using DETX and DETY for each event in the final _common_clean file
| Quadrant A | 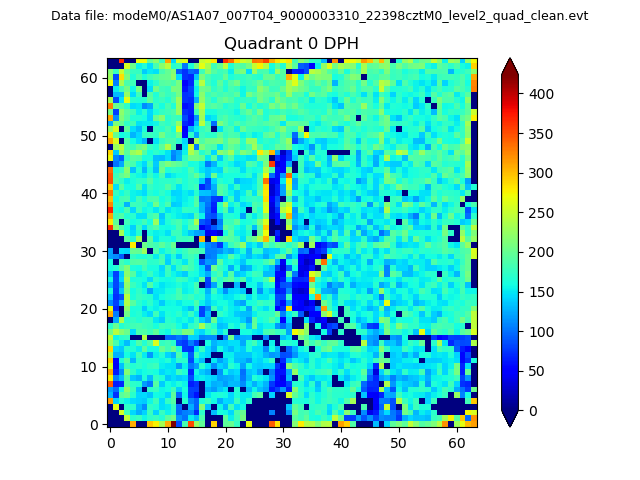 |
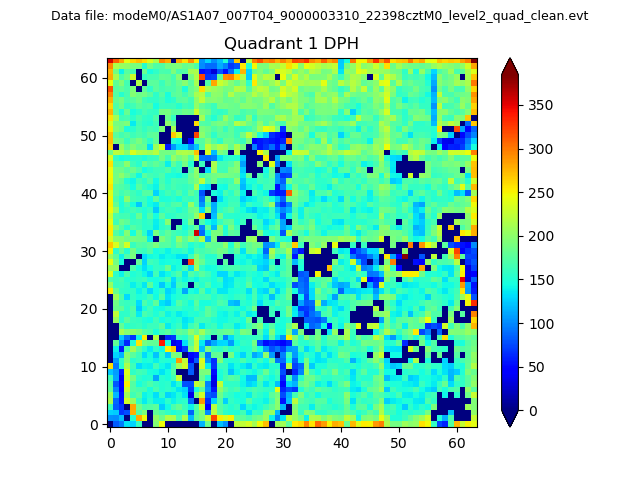 |
Quadrant B |
|---|---|---|---|
| Quadrant D | 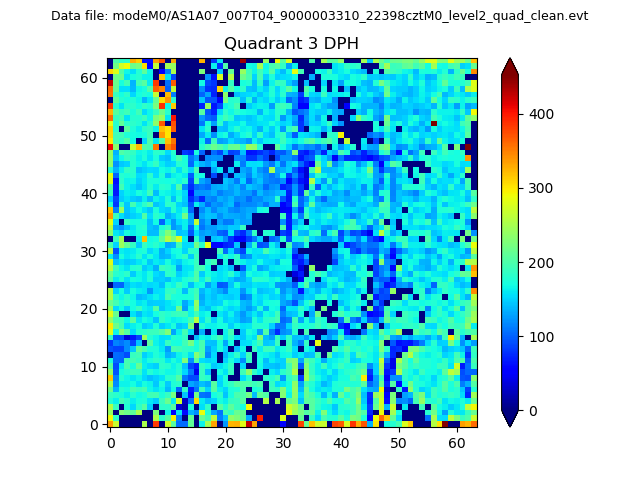 |
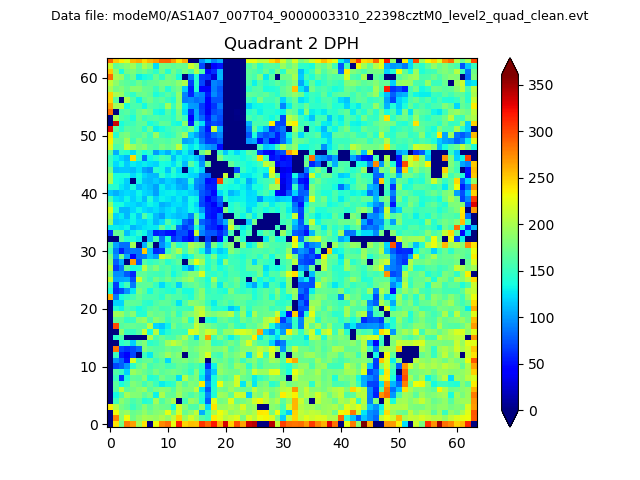 |
Quadrant C |
| Plot type | Count rate plots | Images |
|---|---|---|
| Comparison with Poisson distribution Blue bars denote a histogram of data divided into 1 sec bins. Red curve is a Poisson curve with rate = median count rate of data. |
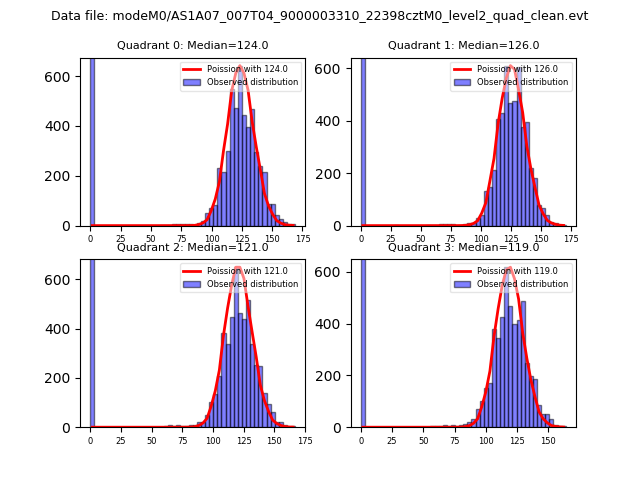 |
 |
| Quadrant-wise count rates Data is divided into 100 sec bins |
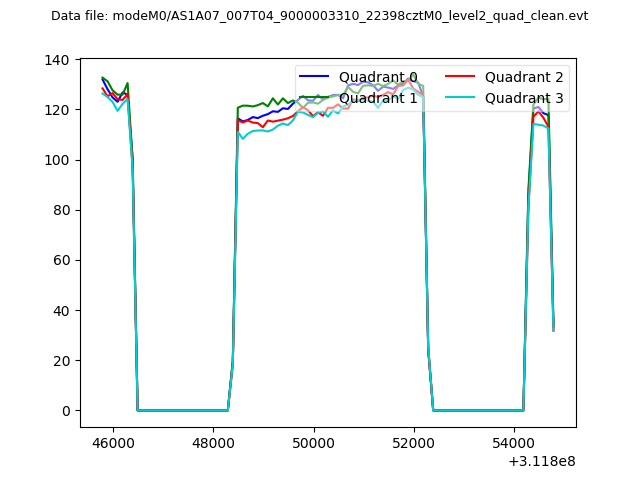 |
|
| Module-wise count rates for Quadrant A Data is divided into 100 sec bins |
 |
 |
| Module-wise count rates for Quadrant B Data is divided into 100 sec bins |
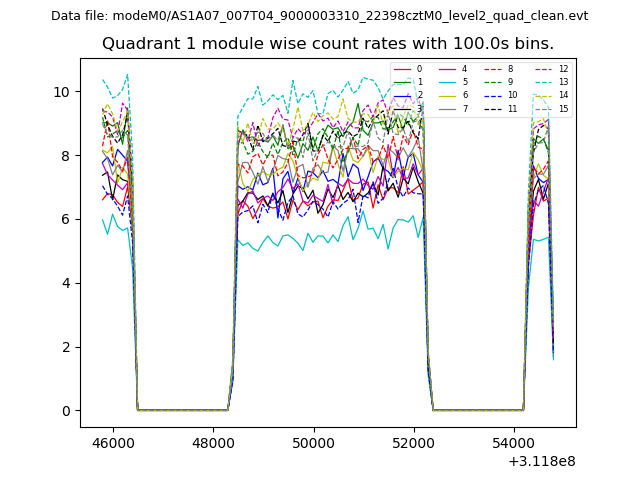 |
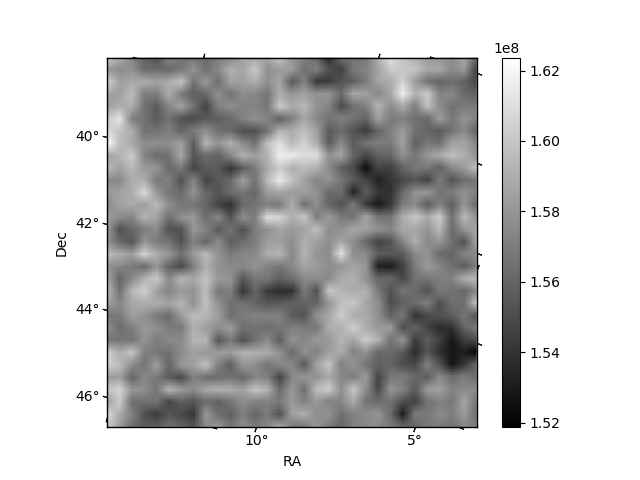 |
| Module-wise count rates for Quadrant C Data is divided into 100 sec bins |
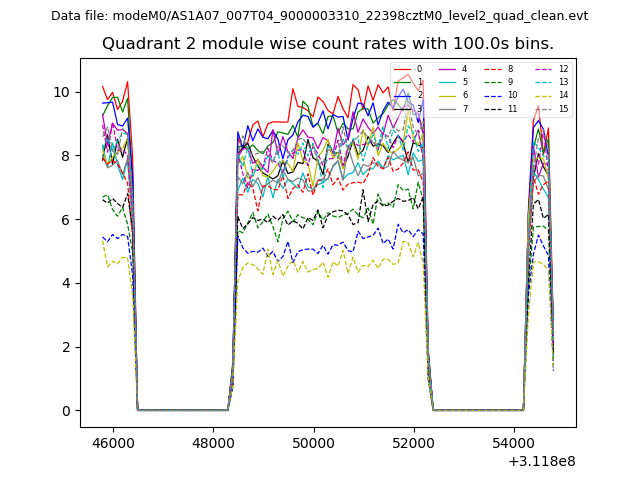 |
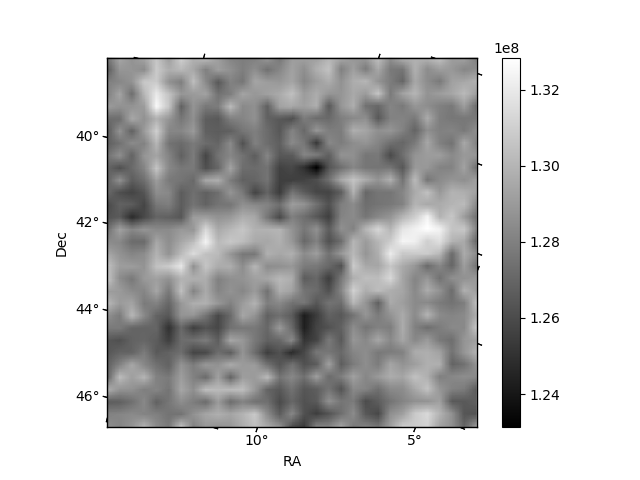 |
| Module-wise count rates for Quadrant D Data is divided into 100 sec bins |
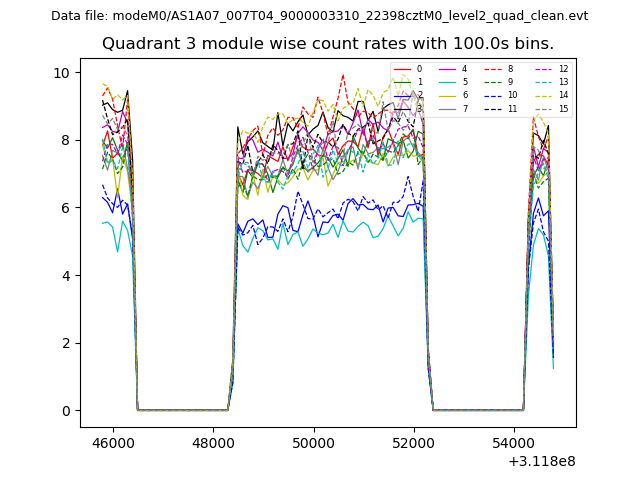 |
 |
| Parameter | Plot |
|---|---|
| CZT HV Monitor |  |
| D_VDD | 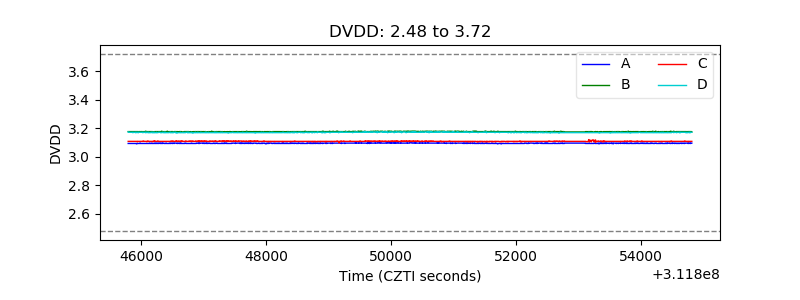 |
| Temperature 1 |  |
| Veto HV Monitor | 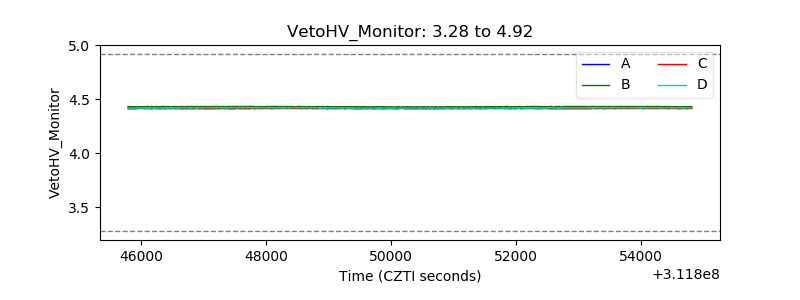 |
| Veto LLD | 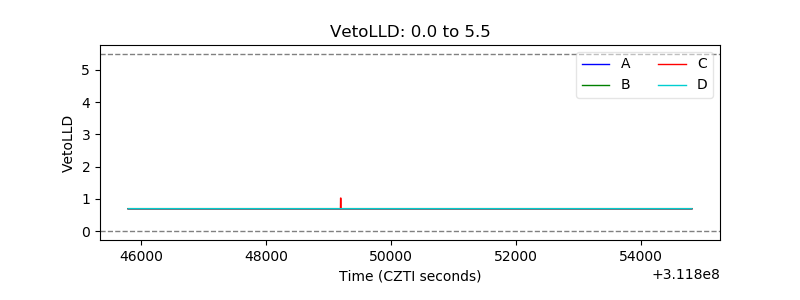 |
| Alpha Counter | 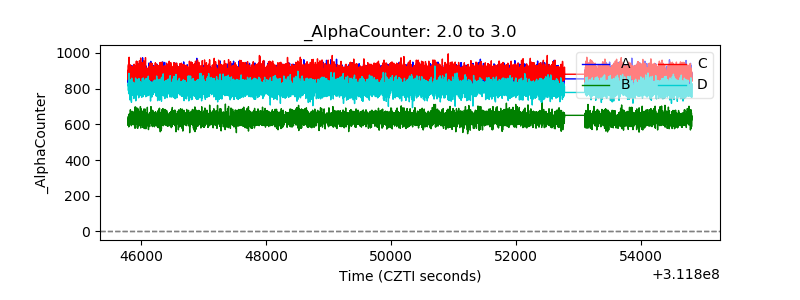 |
| _CPM_Rate | 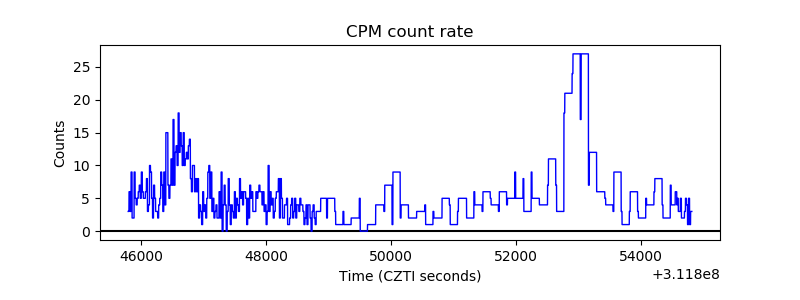 |
| CZT Counter | 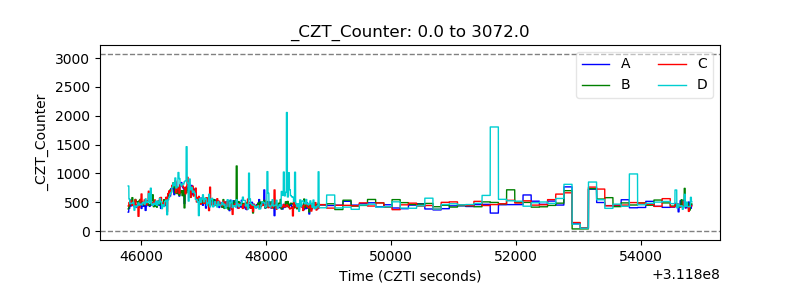 |
| +2.5 Volts monitor |  |
| +5 Volts monitor |  |
| _ROLL_ROT | 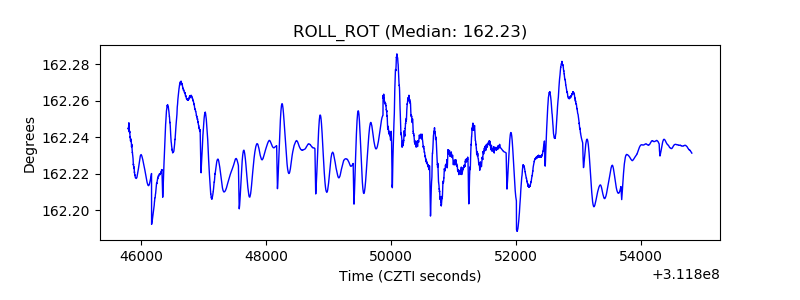 |
| _Roll_DEC | 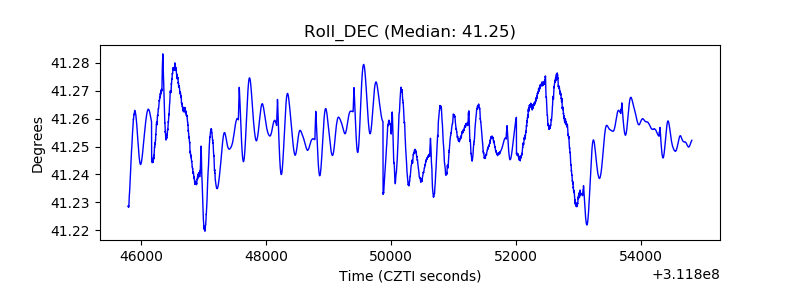 |
| _Roll_RA | 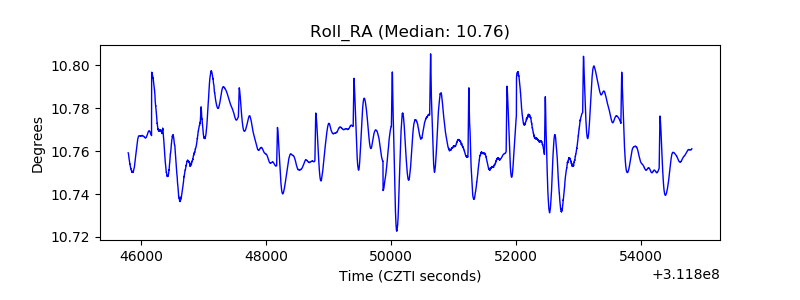 |
| Veto Counter | 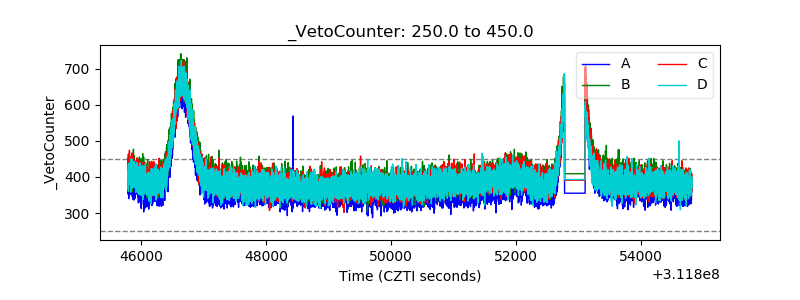 |