| Param | Original file | Final file |
|---|---|---|
| Filename | modeM0/AS1A07_007T04_9000003310_22401cztM0_level2.evt | modeM0/AS1A07_007T04_9000003310_22401cztM0_level2_quad_clean.evt |
| Size (bytes) | 435,343,680 | 101,615,040 |
| Size | 415.2 MB | 96.9 MB |
| Events in quadrant A | 3,058,523 | 668,424 |
| Events in quadrant B | 3,155,319 | 673,648 |
| Events in quadrant C | 3,076,581 | 644,378 |
| Events in quadrant D | 3,447,572 | 633,216 |
| Mode M0 | |||
|---|---|---|---|
| Quadrant | BADHDUFLAG | Total packets | Discarded packets |
| A | 0 | 13418 | 2 |
| B | 0 | 13616 | 1 |
| C | 0 | 13364 | 1 |
| D | 0 | 14399 | 1 |
| Mode SS | |||
|---|---|---|---|
| Quadrant | BADHDUFLAG | Total packets | Discarded packets |
| A | 0 | 134 | 0 |
| B | 0 | 134 | 0 |
| C | 0 | 134 | 0 |
| D | 0 | 134 | 0 |
| Mode M9 | |||
|---|---|---|---|
| Quadrant | BADHDUFLAG | Total packets | Discarded packets |
| A | 0 | 8 | 0 |
| B | 0 | 8 | 0 |
| C | 0 | 8 | 0 |
| D | 0 | 8 | 0 |
| Quadrant | Total seconds | Saturated seconds | Saturation percentage |
|---|---|---|---|
| A | 6562 | 53 | 0.807681% |
| B | 6563 | 66 | 1.005638% |
| C | 6563 | 72 | 1.097059% |
| D | 6563 | 59 | 0.898979% |
Noise dominated data is calculated using 1-second bins in cleaned event files. If a bin has >2000 counts, and if more than 50% of those come from <1% of pixels, then it is considered to be noise-dominated and hence unusable.
| Quadrant | # 1 sec bins | Bins with >0 counts | Bins with >2000 counts | High rate bins dominated by noise | Noise dominated (total time) | Noise dominated (detector-on time) | Marked lightcurve |
|---|---|---|---|---|---|---|---|
| A | 7432 | 6562 | 0 | 0 | 0.00% | 0.00% | 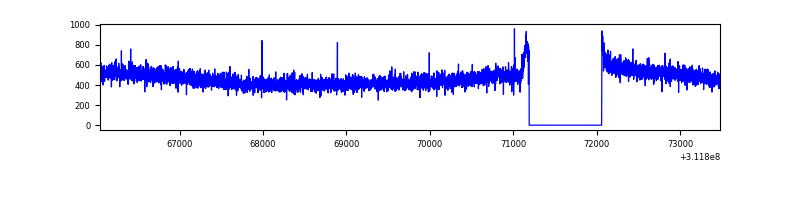 |
| B | 7433 | 6563 | 7 | 7 | 0.09% | 0.11% | 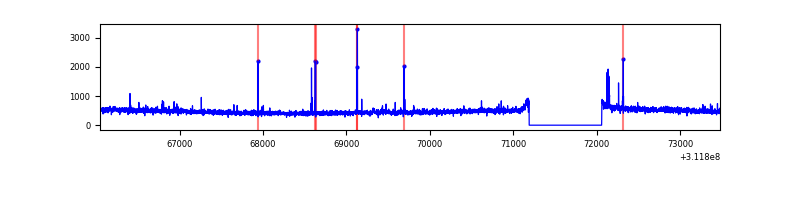 |
| C | 7433 | 6563 | 0 | 0 | 0.00% | 0.00% | 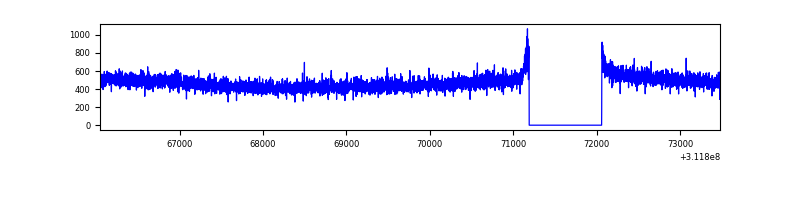 |
| D | 7433 | 6563 | 6 | 6 | 0.08% | 0.09% | 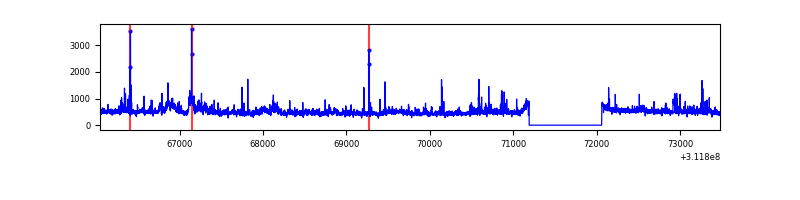 |
Top three noisy pixels from each quadrant. If the there are fewer than three noisy pixels in the level2.evt file, extra rows are filled as -1
| Pixel properties | Quadrant properties | ||||||
|---|---|---|---|---|---|---|---|
| Quadrant | DetID | PixID | Counts | Sigma | Mean | Median | Sigma |
| A | 13 | 254 | 9824 | 56.91 | 792 | 775 | 159.0 |
| A | 3 | 137 | 6907 | 38.57 | 792 | 775 | 159.0 |
| A | 0 | 226 | 6750 | 37.58 | 792 | 775 | 159.0 |
| B | 3 | 64 | 31767 | 207.14 | 784 | 763 | 149.7 |
| B | 12 | 111 | 18173 | 116.32 | 784 | 763 | 149.7 |
| B | 11 | 111 | 16038 | 102.05 | 784 | 763 | 149.7 |
| C | 14 | 238 | 118907 | 664.1 | 759 | 764 | 177.9 |
| C | 13 | 61 | 5151 | 24.66 | 759 | 764 | 177.9 |
| C | 15 | 78 | 1792 | 5.78 | 759 | 764 | 177.9 |
| D | 1 | 52 | 196111 | 1037.69 | 771 | 750 | 188.3 |
| D | 12 | 227 | 193611 | 1024.41 | 771 | 750 | 188.3 |
| D | 13 | 104 | 40409 | 210.65 | 771 | 750 | 188.3 |
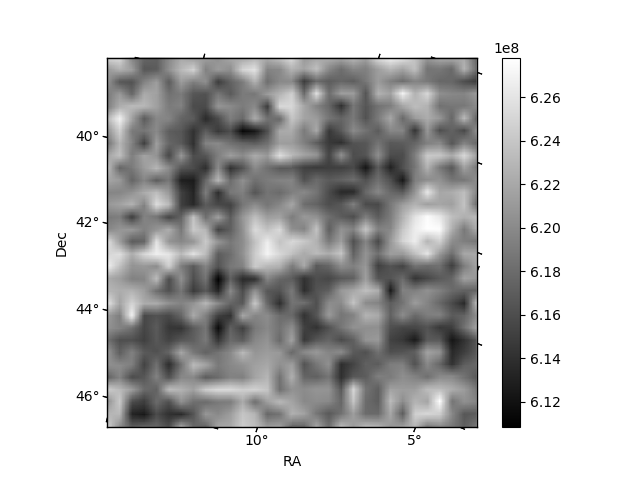
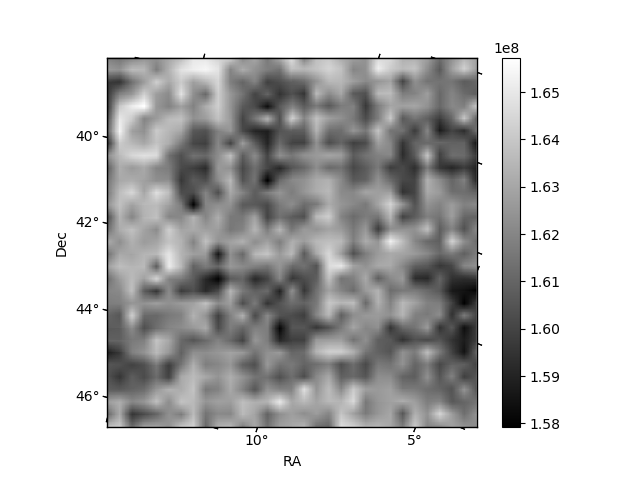
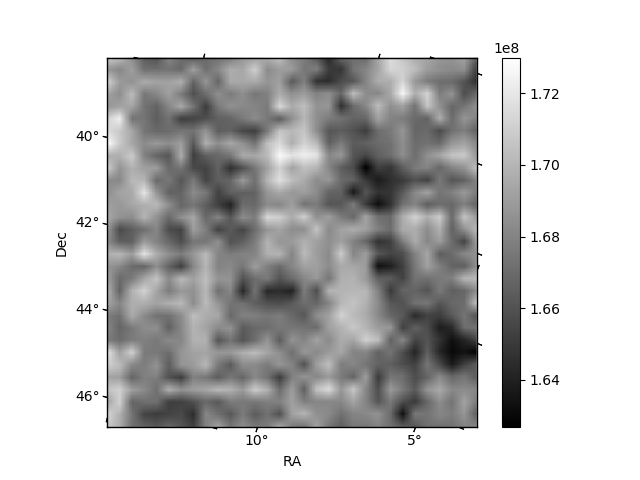
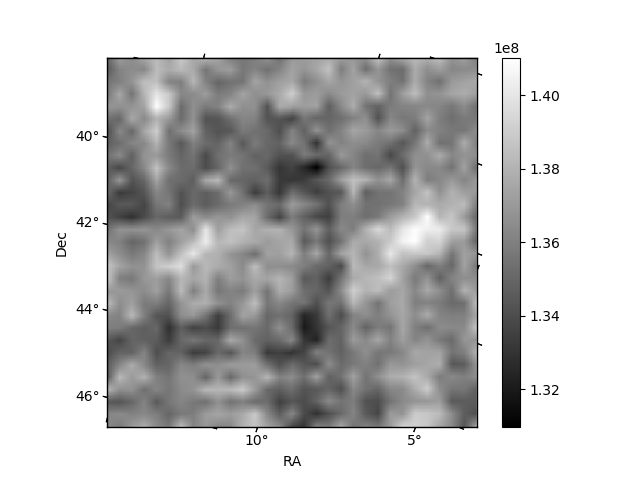
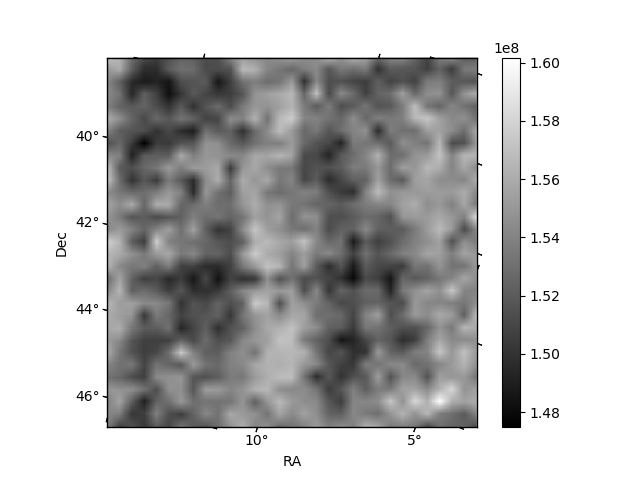
Histogram calculated using DETX and DETY for each event in the final _common_clean file
| Quadrant A | 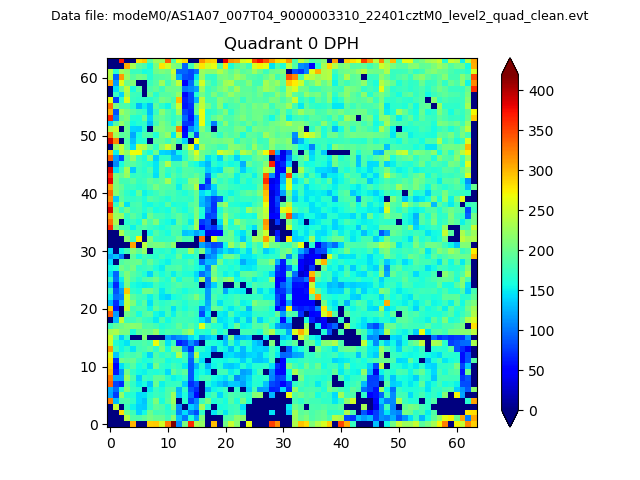 |
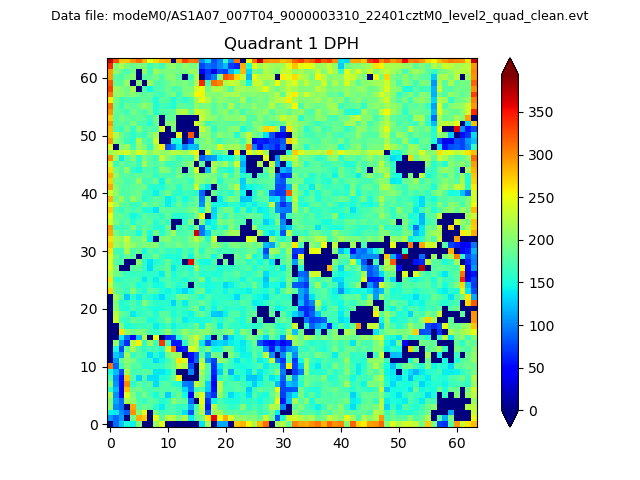 |
Quadrant B |
|---|---|---|---|
| Quadrant D | 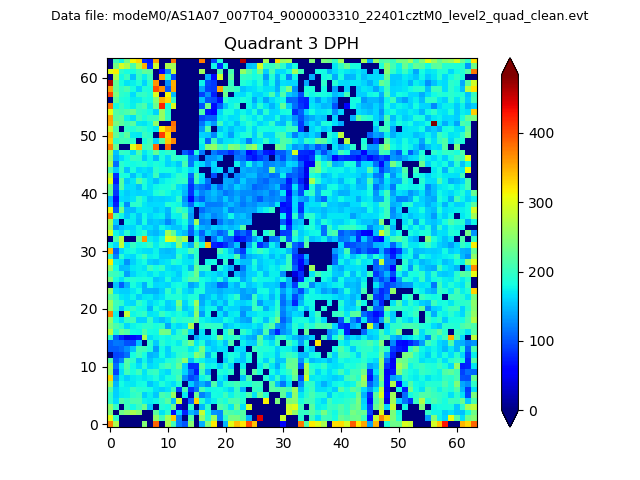 |
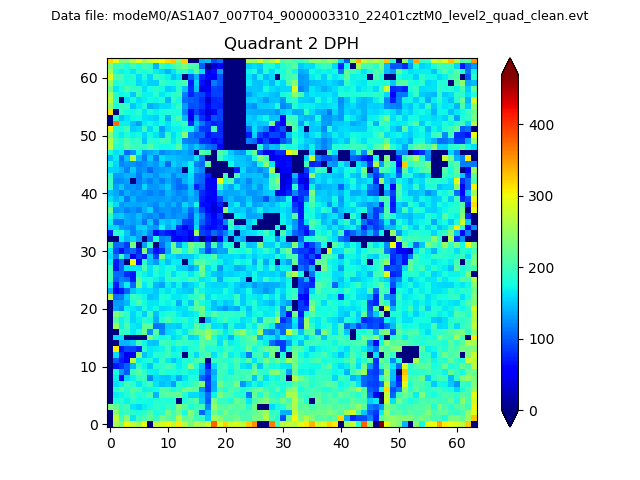 |
Quadrant C |
| Plot type | Count rate plots | Images |
|---|---|---|
| Comparison with Poisson distribution Blue bars denote a histogram of data divided into 1 sec bins. Red curve is a Poisson curve with rate = median count rate of data. |
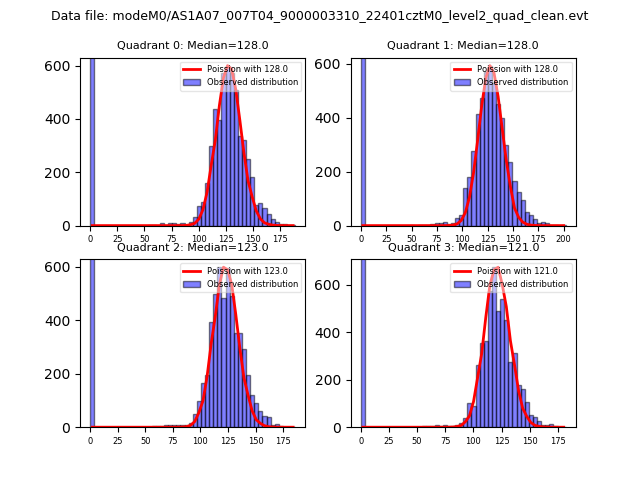 |
 |
| Quadrant-wise count rates Data is divided into 100 sec bins |
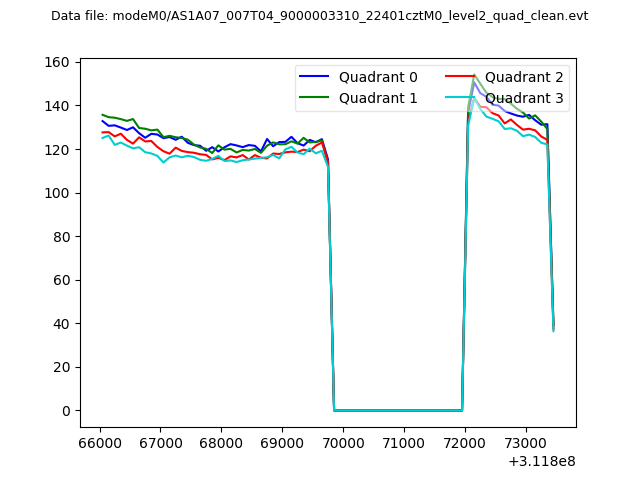 |
|
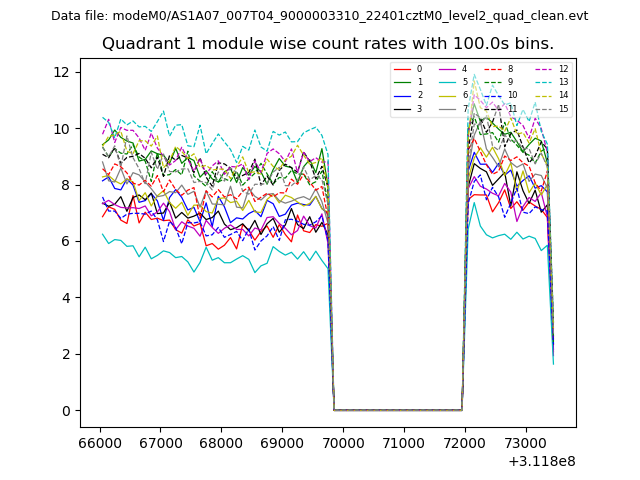
| Module-wise count rates for Quadrant A Data is divided into 100 sec bins |
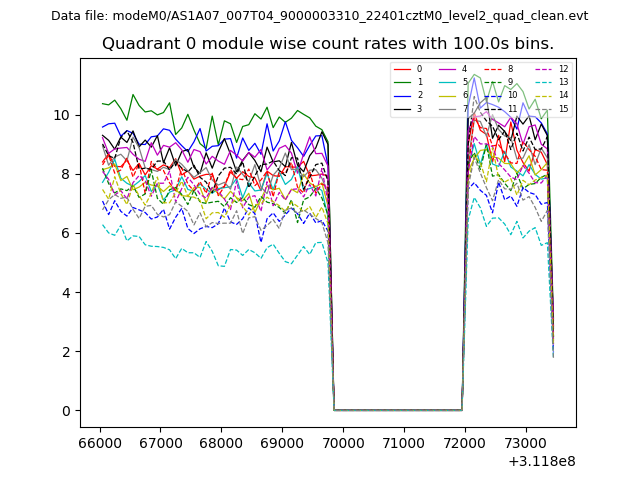 |
 |
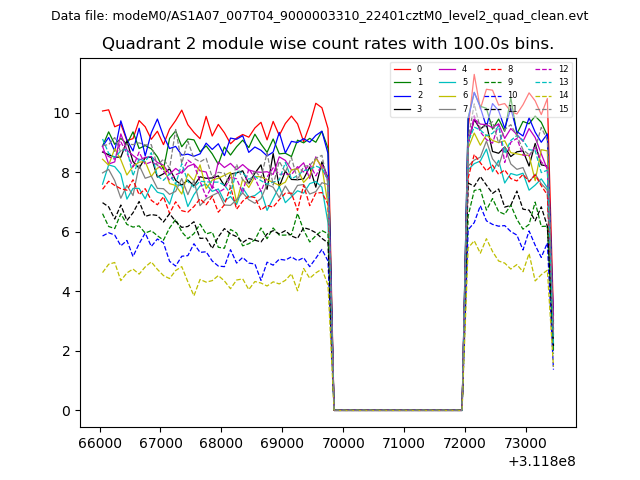
| Module-wise count rates for Quadrant B Data is divided into 100 sec bins |
 |
 |
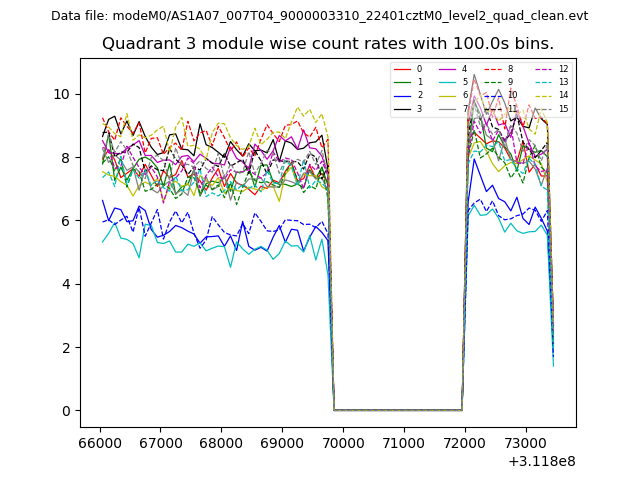
| Module-wise count rates for Quadrant C Data is divided into 100 sec bins |
 |
 |
| Module-wise count rates for Quadrant D Data is divided into 100 sec bins |
 |
 |
| Parameter | Plot |
|---|---|
| CZT HV Monitor | 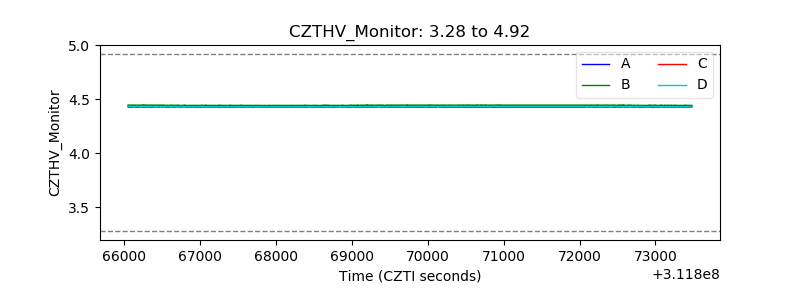 |
| D_VDD | 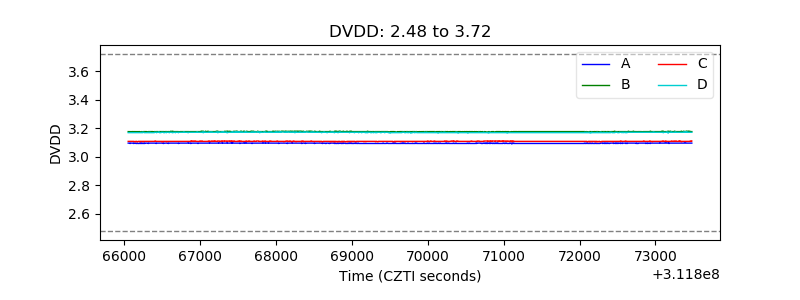 |
| Temperature 1 | 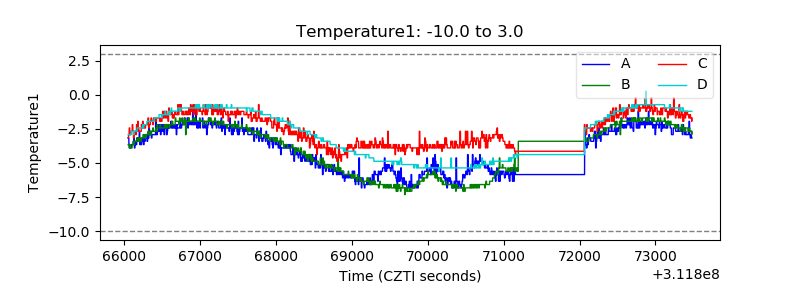 |
| Veto HV Monitor | 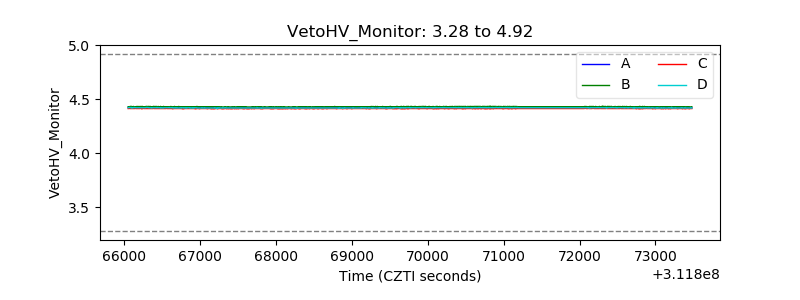 |
| Veto LLD | 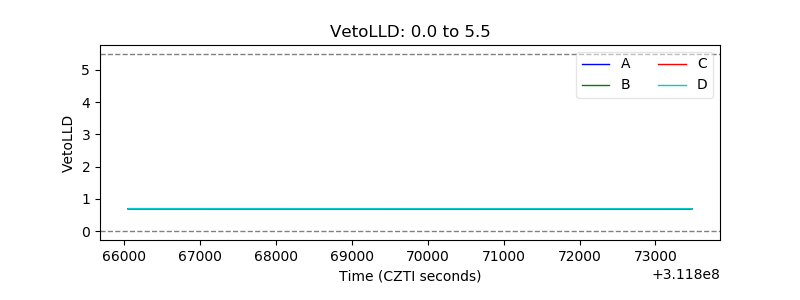 |
| Alpha Counter | 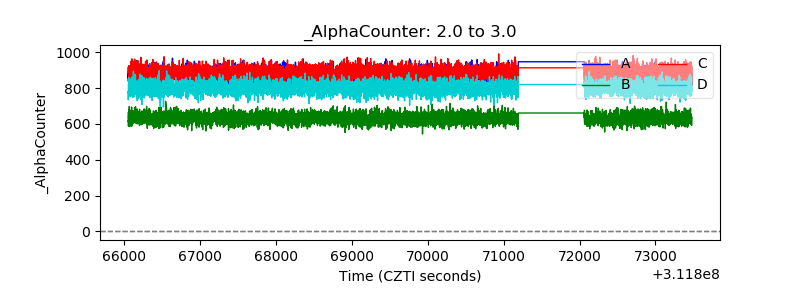 |
| _CPM_Rate | 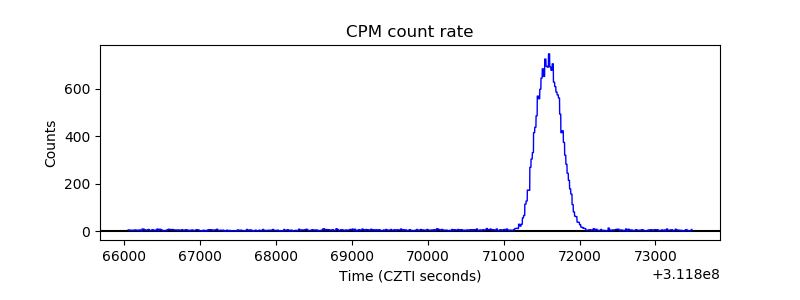 |
| CZT Counter | 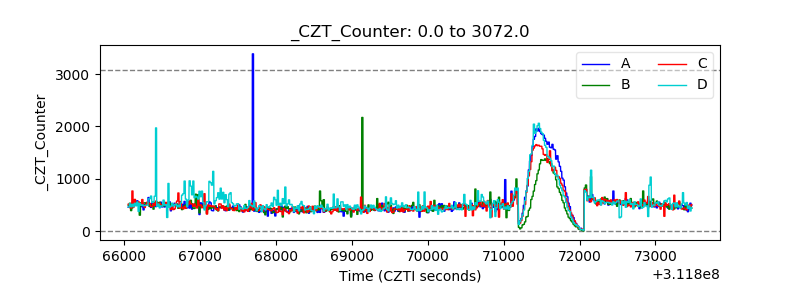 |
| +2.5 Volts monitor | 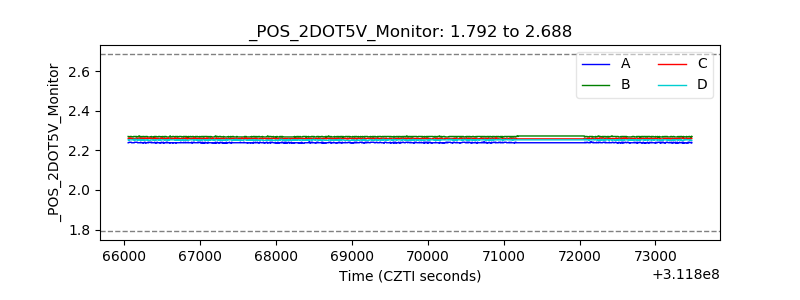 |
| +5 Volts monitor | 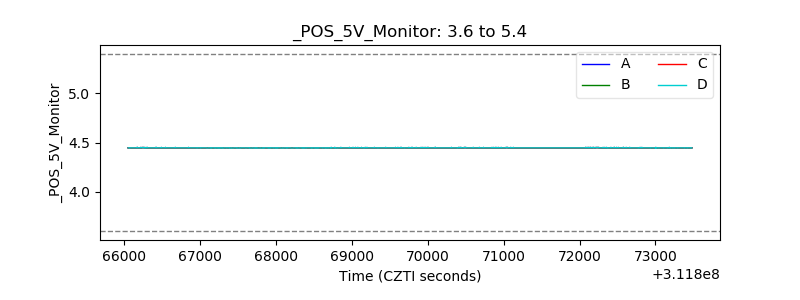 |
| _ROLL_ROT | 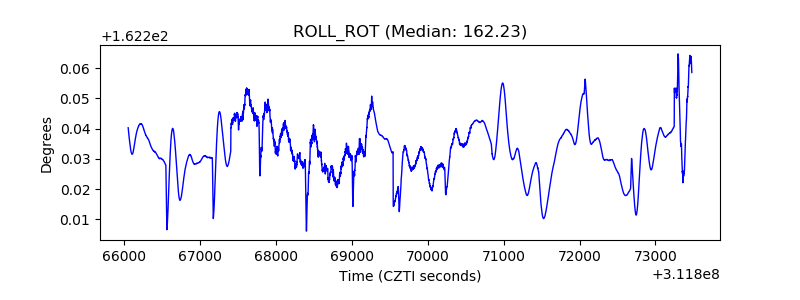 |
| _Roll_DEC | 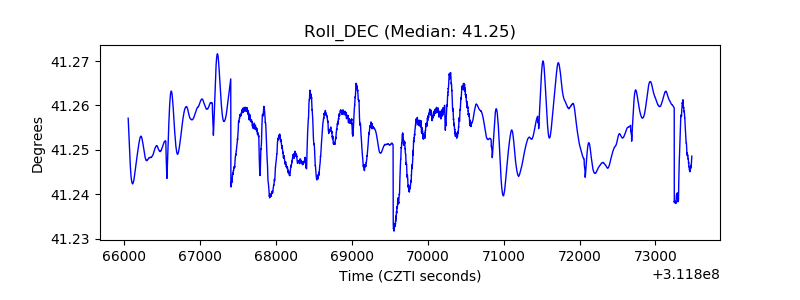 |
| _Roll_RA | 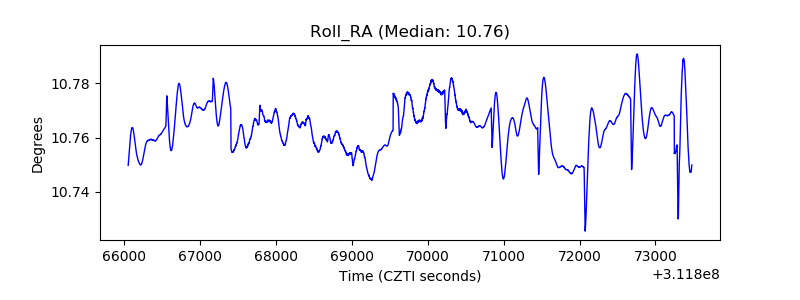 |
| Veto Counter | 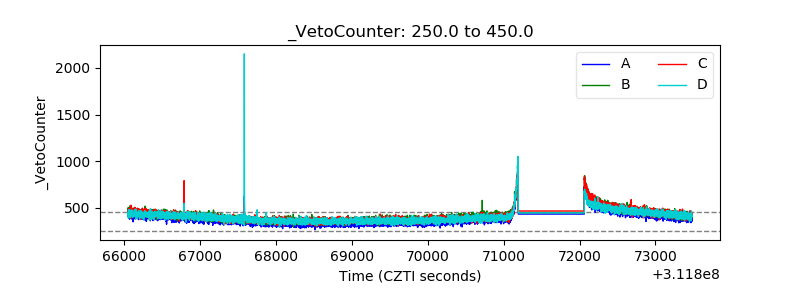 |