| Param | Original file | Final file |
|---|---|---|
| Filename | modeM0/AS1A07_007T04_9000003310_22402cztM0_level2.evt | modeM0/AS1A07_007T04_9000003310_22402cztM0_level2_quad_clean.evt |
| Size (bytes) | 438,088,320 | 102,093,120 |
| Size | 417.8 MB | 97.4 MB |
| Events in quadrant A | 3,133,304 | 672,011 |
| Events in quadrant B | 3,211,344 | 677,087 |
| Events in quadrant C | 3,163,068 | 646,944 |
| Events in quadrant D | 3,312,761 | 637,399 |
| Mode M0 | |||
|---|---|---|---|
| Quadrant | BADHDUFLAG | Total packets | Discarded packets |
| A | 0 | 13695 | 2 |
| B | 0 | 13916 | 2 |
| C | 0 | 13672 | 2 |
| D | 0 | 14225 | 3 |
| Mode SS | |||
|---|---|---|---|
| Quadrant | BADHDUFLAG | Total packets | Discarded packets |
| A | 0 | 136 | 0 |
| B | 0 | 136 | 0 |
| C | 0 | 136 | 0 |
| D | 0 | 136 | 0 |
| Mode M9 | |||
|---|---|---|---|
| Quadrant | BADHDUFLAG | Total packets | Discarded packets |
| A | 0 | 17 | 0 |
| B | 0 | 18 | 0 |
| C | 0 | 18 | 0 |
| D | 0 | 18 | 0 |
| Quadrant | Total seconds | Saturated seconds | Saturation percentage |
|---|---|---|---|
| A | 6574 | 40 | 0.608458% |
| B | 6574 | 48 | 0.730149% |
| C | 6574 | 81 | 1.232127% |
| D | 6573 | 35 | 0.532481% |
Noise dominated data is calculated using 1-second bins in cleaned event files. If a bin has >2000 counts, and if more than 50% of those come from <1% of pixels, then it is considered to be noise-dominated and hence unusable.
| Quadrant | # 1 sec bins | Bins with >0 counts | Bins with >2000 counts | High rate bins dominated by noise | Noise dominated (total time) | Noise dominated (detector-on time) | Marked lightcurve |
|---|---|---|---|---|---|---|---|
| A | 7619 | 6575 | 0 | 0 | 0.00% | 0.00% | 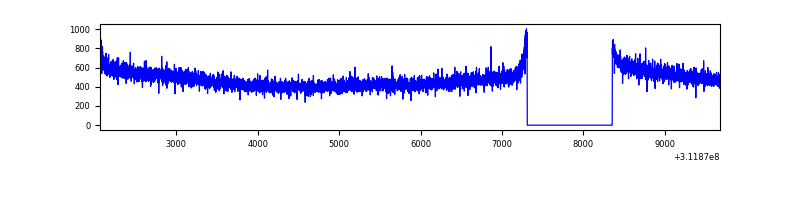 |
| B | 7619 | 6575 | 1 | 1 | 0.01% | 0.02% | 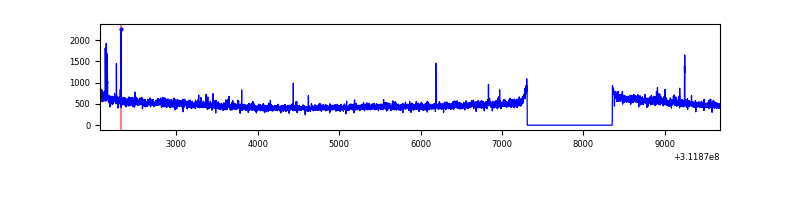 |
| C | 7619 | 6575 | 0 | 0 | 0.00% | 0.00% | 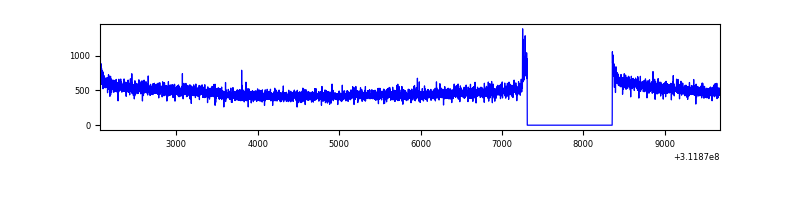 |
| D | 7618 | 6574 | 12 | 12 | 0.16% | 0.18% | 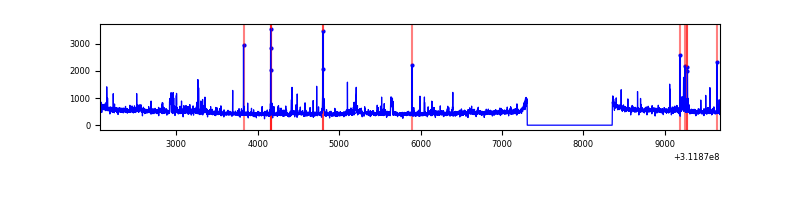 |
Top three noisy pixels from each quadrant. If the there are fewer than three noisy pixels in the level2.evt file, extra rows are filled as -1
| Pixel properties | Quadrant properties | ||||||
|---|---|---|---|---|---|---|---|
| Quadrant | DetID | PixID | Counts | Sigma | Mean | Median | Sigma |
| A | 13 | 254 | 9453 | 53.23 | 813 | 797 | 162.6 |
| A | 0 | 226 | 7096 | 38.73 | 813 | 797 | 162.6 |
| A | 3 | 137 | 6729 | 36.48 | 813 | 797 | 162.6 |
| B | 3 | 64 | 20573 | 130.47 | 802 | 781 | 151.7 |
| B | 0 | 229 | 19525 | 123.56 | 802 | 781 | 151.7 |
| B | 12 | 111 | 18158 | 114.55 | 802 | 781 | 151.7 |
| C | 14 | 238 | 122636 | 672.28 | 778 | 781 | 181.3 |
| C | 13 | 61 | 5389 | 25.42 | 778 | 781 | 181.3 |
| C | 10 | 22 | 5050 | 23.55 | 778 | 781 | 181.3 |
| D | 1 | 52 | 121225 | 623.6 | 792 | 768 | 193.2 |
| D | 7 | 223 | 66236 | 338.93 | 792 | 768 | 193.2 |
| D | 13 | 172 | 62364 | 318.88 | 792 | 768 | 193.2 |
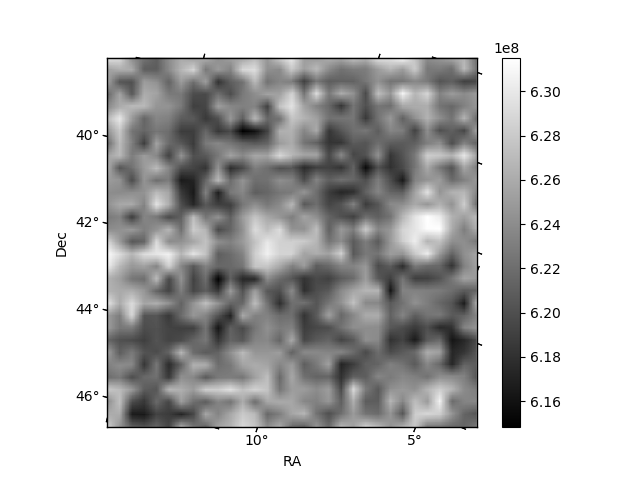
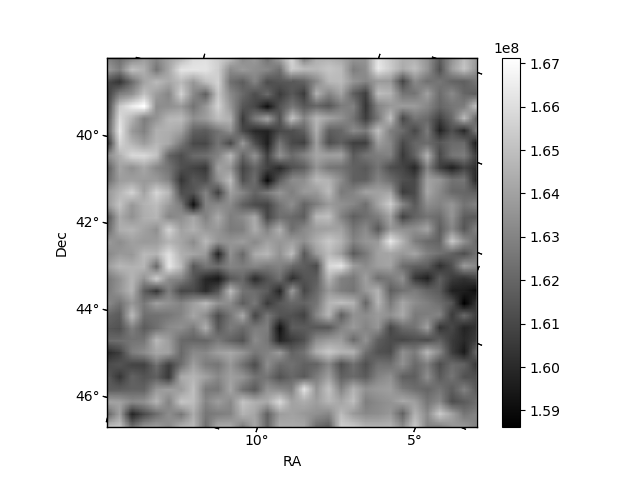
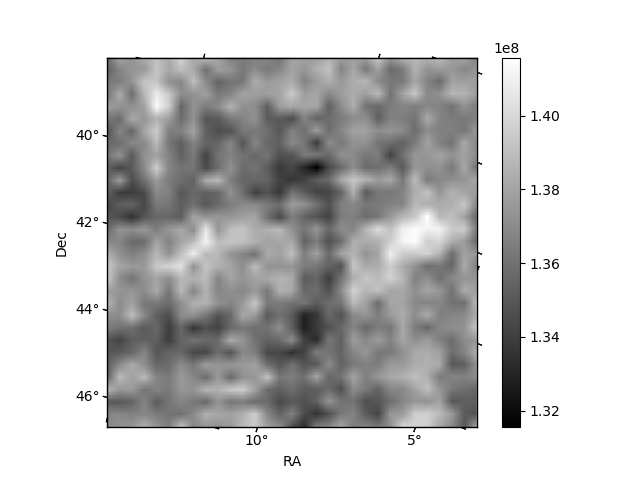
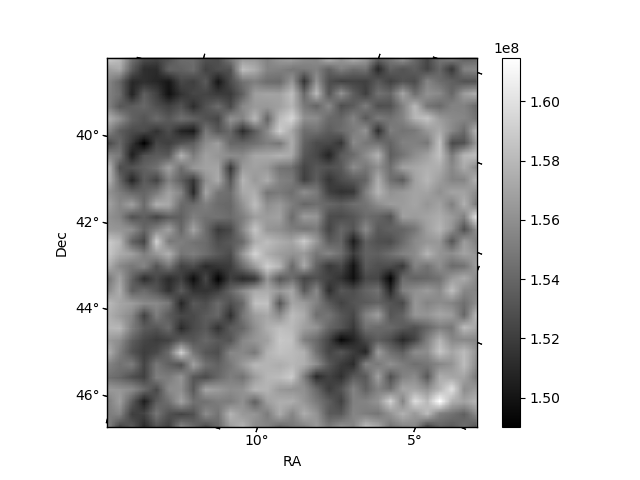
Histogram calculated using DETX and DETY for each event in the final _common_clean file
| Quadrant A | 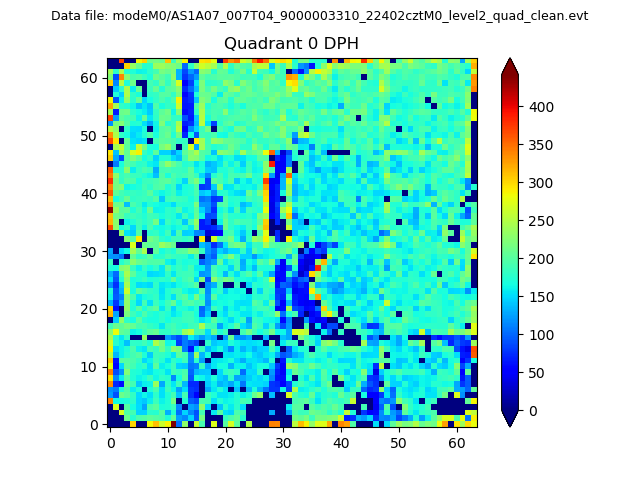 |
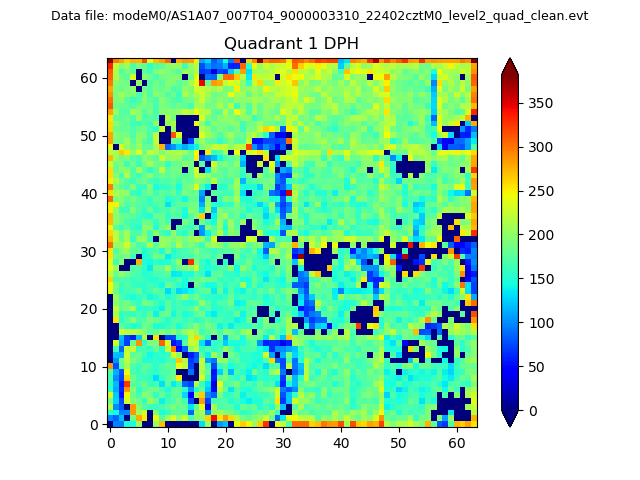 |
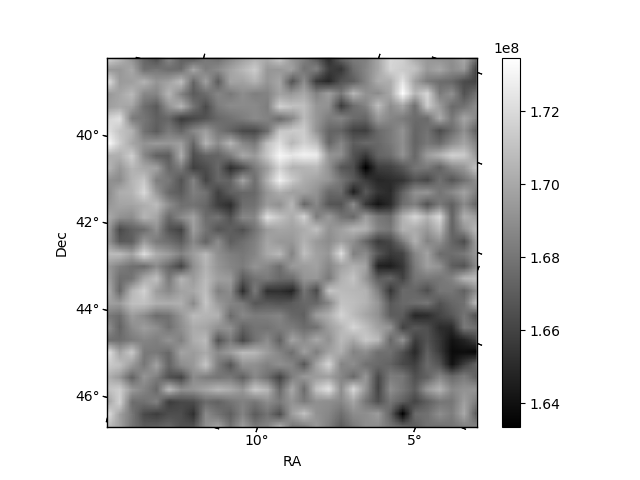
Quadrant B |
|---|---|---|---|
| Quadrant D | 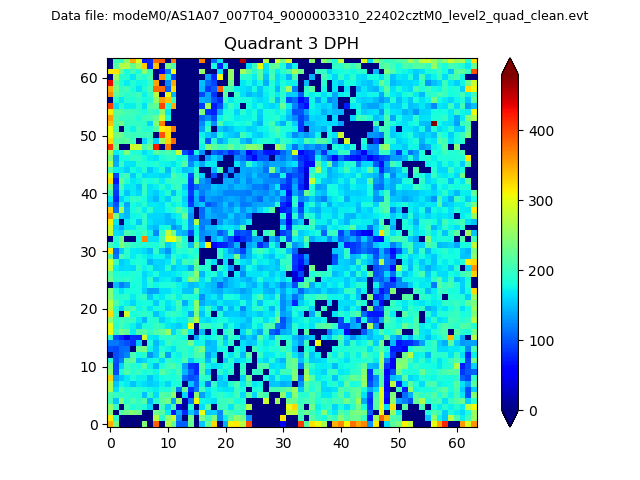 |
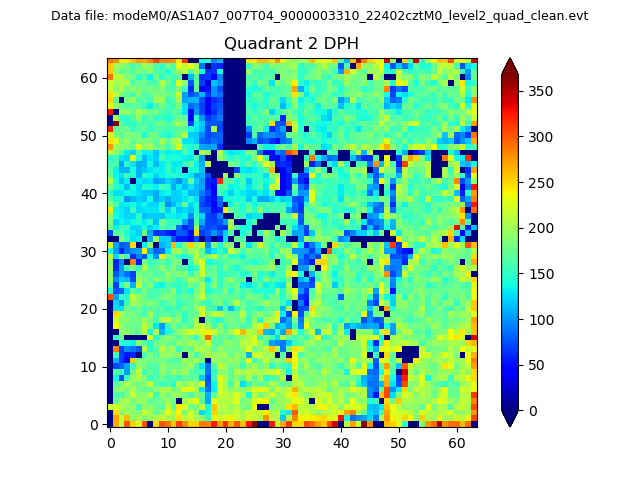 |
Quadrant C |
| Plot type | Count rate plots | Images |
|---|---|---|
| Comparison with Poisson distribution Blue bars denote a histogram of data divided into 1 sec bins. Red curve is a Poisson curve with rate = median count rate of data. |
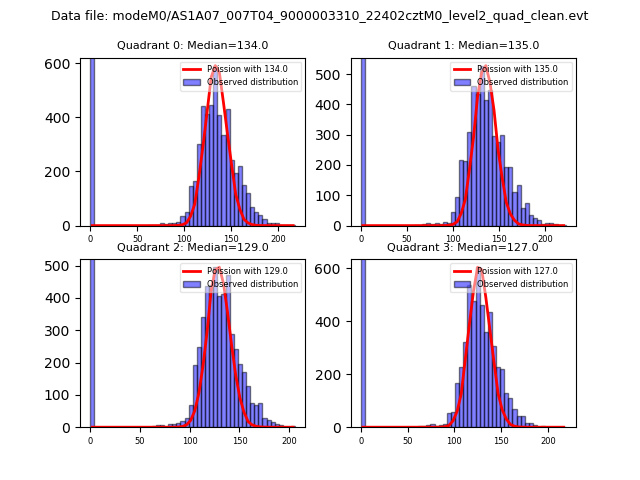 |
 |
| Quadrant-wise count rates Data is divided into 100 sec bins |
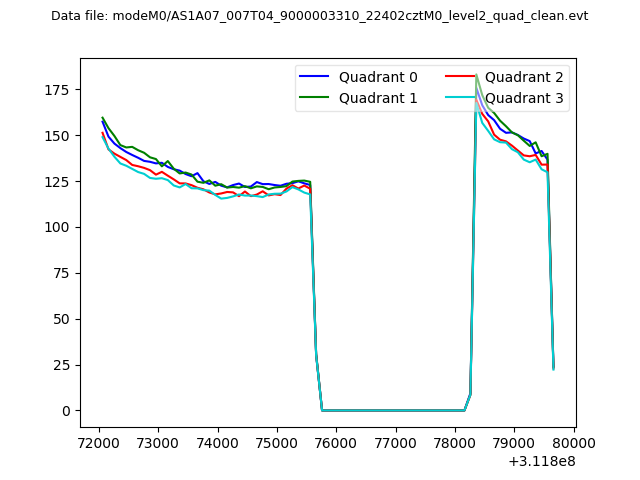 |
|
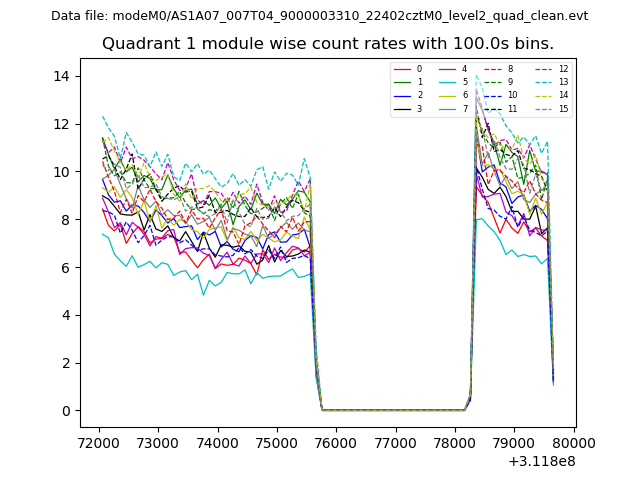
| Module-wise count rates for Quadrant A Data is divided into 100 sec bins |
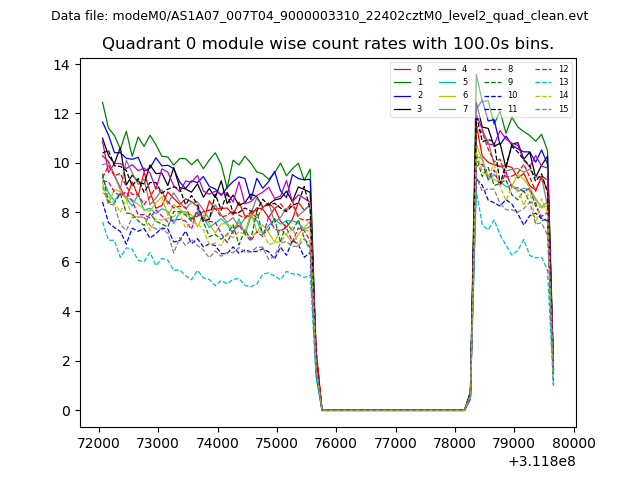 |
 |
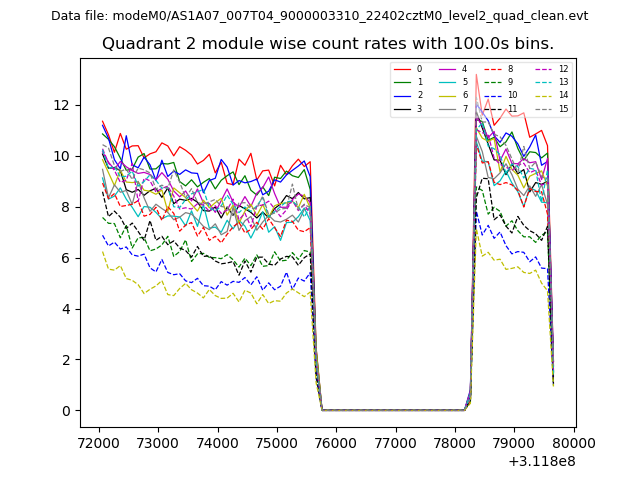
| Module-wise count rates for Quadrant B Data is divided into 100 sec bins |
 |
 |
| Module-wise count rates for Quadrant C Data is divided into 100 sec bins |
 |
 |
| Module-wise count rates for Quadrant D Data is divided into 100 sec bins |
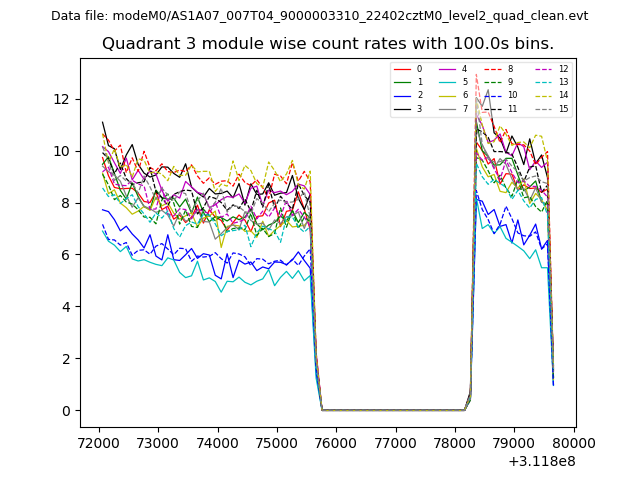 |
 |
| Parameter | Plot |
|---|---|
| CZT HV Monitor | 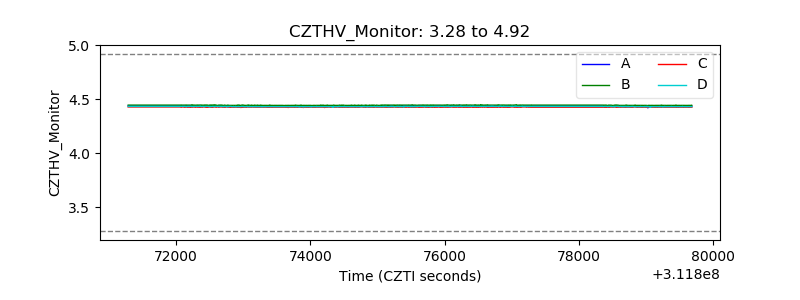 |
| D_VDD | 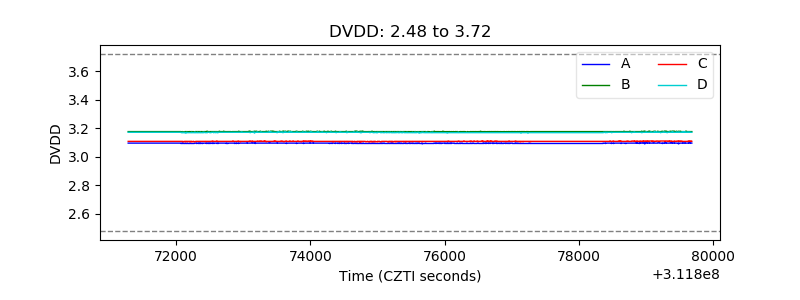 |
| Temperature 1 | 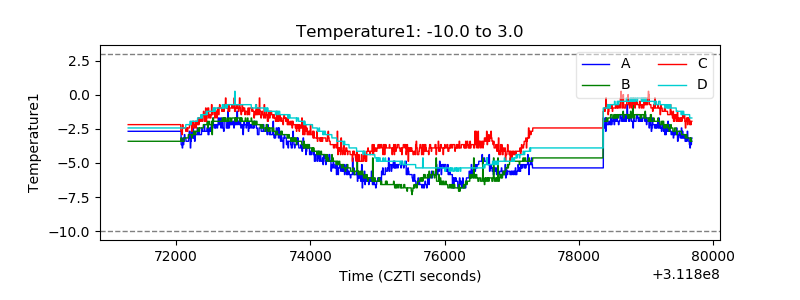 |
| Veto HV Monitor | 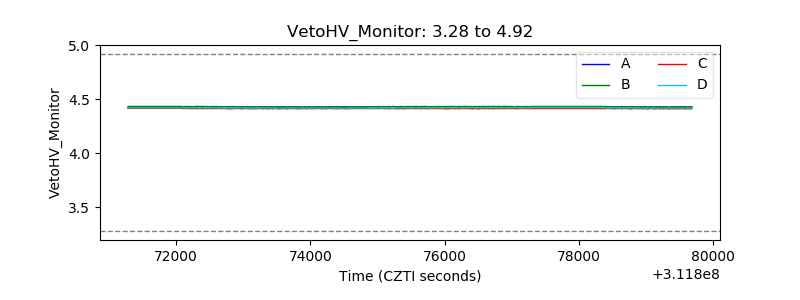 |
| Veto LLD | 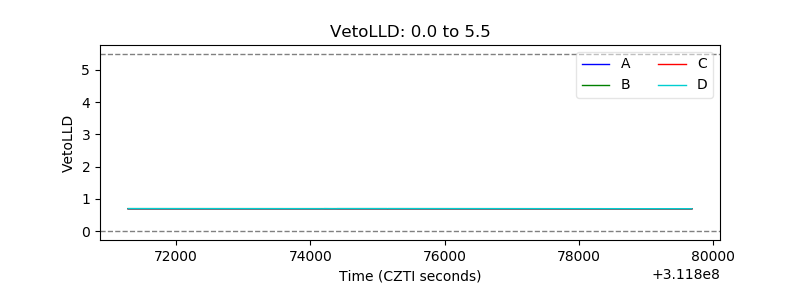 |
| Alpha Counter | 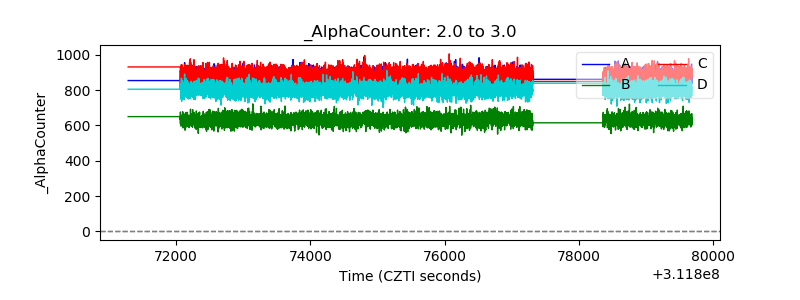 |
| _CPM_Rate | 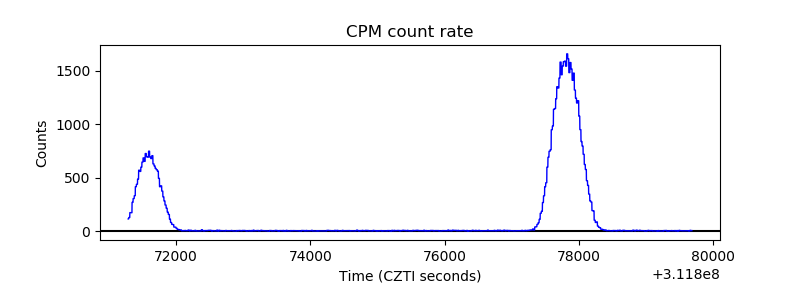 |
| CZT Counter | 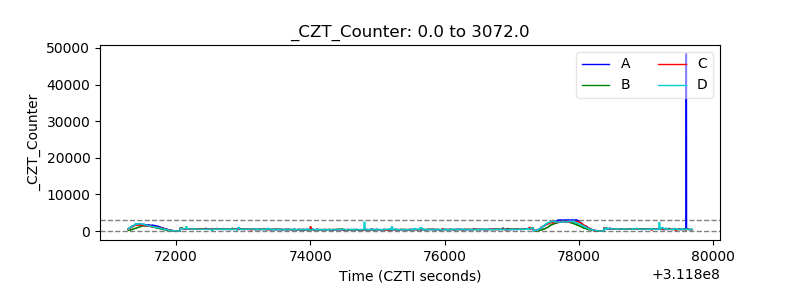 |
| +2.5 Volts monitor |  |
| +5 Volts monitor | 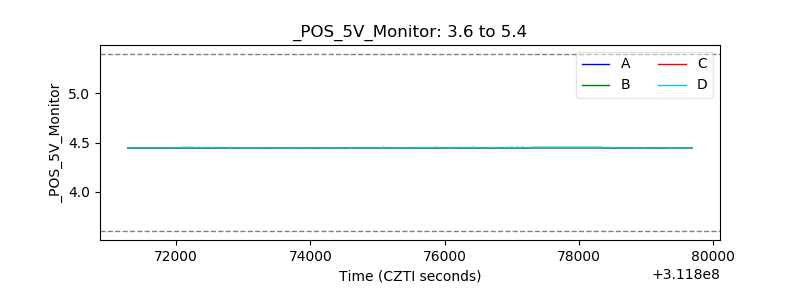 |
| _ROLL_ROT | 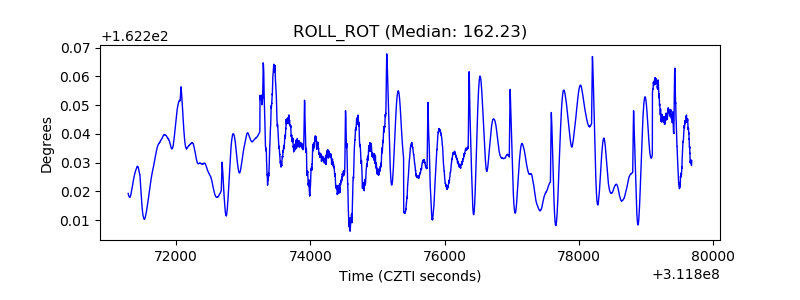 |
| _Roll_DEC | 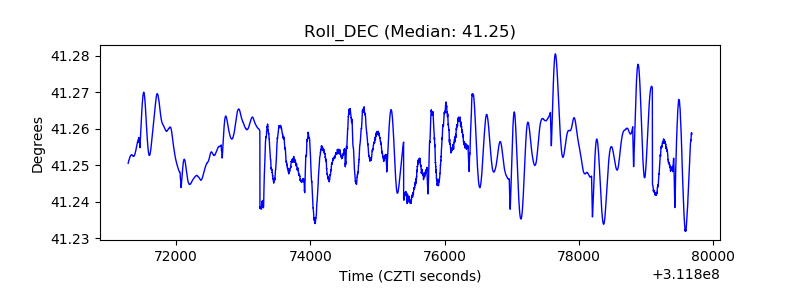 |
| _Roll_RA | 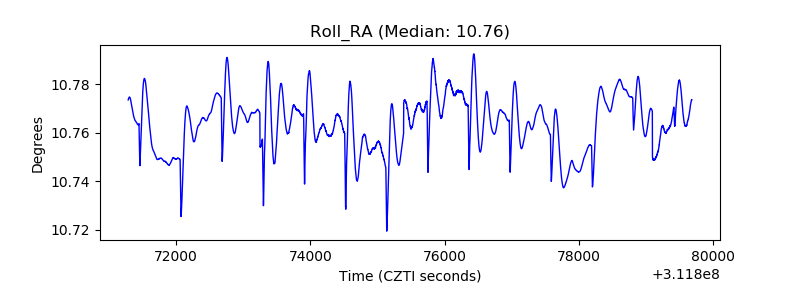 |
| Veto Counter | 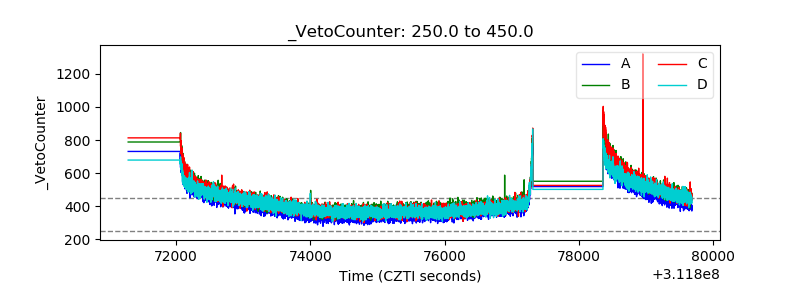 |