| Param | Original file | Final file |
|---|---|---|
| Filename | modeM0/AS1C05_004T01_9000003308cztM0_level2.fits | modeM0/AS1C05_004T01_9000003308cztM0_level2_quad_clean.evt |
| Size (bytes) | 485,573,760 | 557,300,160 |
| Size | 463.1 MB | 531.5 MB |
| Events in quadrant A | 2,983,742 | 3,519,269 |
| Events in quadrant B | 2,867,098 | 3,534,198 |
| Events in quadrant C | 2,914,742 | 3,356,397 |
| Events in quadrant D | 2,527,842 | 3,057,232 |
| Mode M0 | |||
|---|---|---|---|
| Quadrant | BADHDUFLAG | Total packets | Discarded packets |
| A | 0 | 104768 | 0 |
| B | 0 | 107600 | 0 |
| C | 0 | 104010 | 0 |
| D | 0 | 119836 | 0 |
| Mode SS | |||
|---|---|---|---|
| Quadrant | BADHDUFLAG | Total packets | Discarded packets |
| A | 0 | 716 | 0 |
| B | 0 | 716 | 0 |
| C | 0 | 716 | 0 |
| D | 0 | 716 | 0 |
| Mode M9 | |||
|---|---|---|---|
| Quadrant | BADHDUFLAG | Total packets | Discarded packets |
| A | 0 | 46 | 0 |
| B | 0 | 47 | 0 |
| C | 0 | 47 | 0 |
| D | 0 | 47 | 0 |
| Quadrant | Total seconds | Saturated seconds | Saturation percentage |
|---|---|---|---|
| A | 50733 | 668 | 1.316697% |
| B | 50733 | 865 | 1.705005% |
| C | 50733 | 864 | 1.703034% |
| D | 50733 | 981 | 1.933653% |
Noise dominated data is calculated using 1-second bins in cleaned event files. If a bin has >2000 counts, and if more than 50% of those come from <1% of pixels, then it is considered to be noise-dominated and hence unusable.
| Quadrant | # 1 sec bins | Bins with >0 counts | Bins with >2000 counts | High rate bins dominated by noise | Noise dominated (total time) | Noise dominated (detector-on time) | Marked lightcurve |
|---|---|---|---|---|---|---|---|
| A | 57028 | 50729 | 0 | 0 | 0.00% | 0.00% |  |
| B | 57028 | 50728 | 0 | 0 | 0.00% | 0.00% | 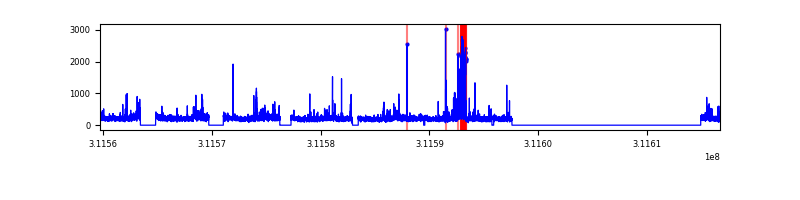 |
| C | 57028 | 50728 | 0 | 0 | 0.00% | 0.00% |  |
| D | 57028 | 50727 | 0 | 0 | 0.00% | 0.00% |  |
Top three noisy pixels from each quadrant. If the there are fewer than three noisy pixels in the level2.evt file, extra rows are filled as -1
| Pixel properties | Quadrant properties | ||||||
|---|---|---|---|---|---|---|---|
| Quadrant | DetID | PixID | Counts | Sigma | Mean | Median | Sigma |
| A | 0 | 29 | 2967 | 11.7 | 775 | 731 | 191.1 |
| A | 7 | 110 | 2379 | 8.62 | 775 | 731 | 191.1 |
| A | 0 | 30 | 2240 | 7.9 | 775 | 731 | 191.1 |
| B | 2 | 9 | 2317 | 10.59 | 759 | 725 | 150.4 |
| B | 2 | 8 | 1912 | 7.89 | 759 | 725 | 150.4 |
| B | 14 | 254 | 1867 | 7.6 | 759 | 725 | 150.4 |
| C | 12 | 241 | 2103 | 7.05 | 769 | 720 | 196.3 |
| C | 3 | 234 | 2029 | 6.67 | 769 | 720 | 196.3 |
| C | 12 | 250 | 1961 | 6.32 | 769 | 720 | 196.3 |
| D | 3 | 14 | 1913 | 6.57 | 719 | 654 | 191.7 |
| D | 15 | 46 | 1893 | 6.46 | 719 | 654 | 191.7 |
| D | 6 | 231 | 1774 | 5.84 | 719 | 654 | 191.7 |
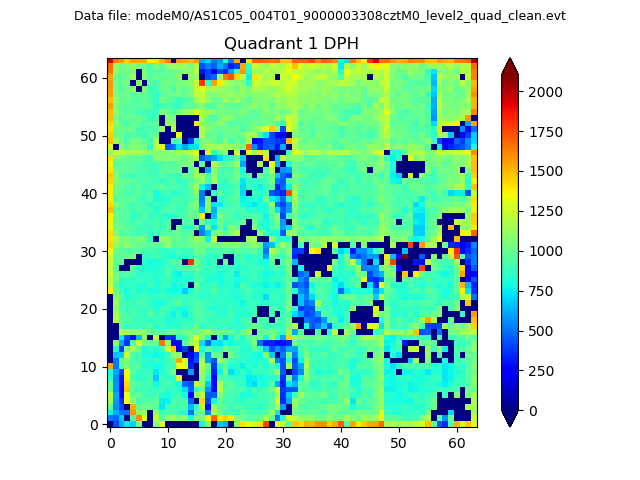
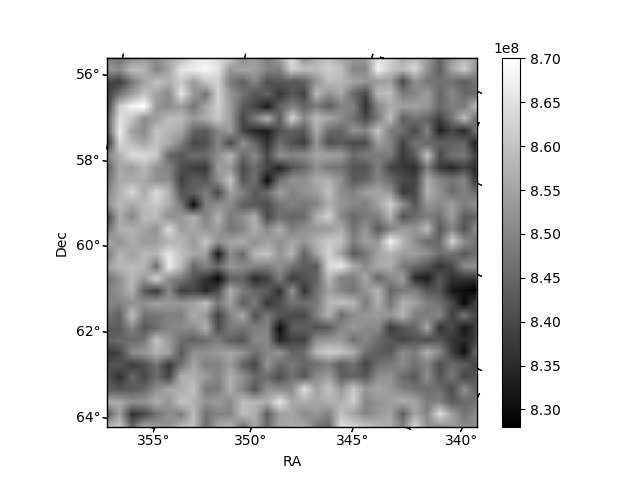
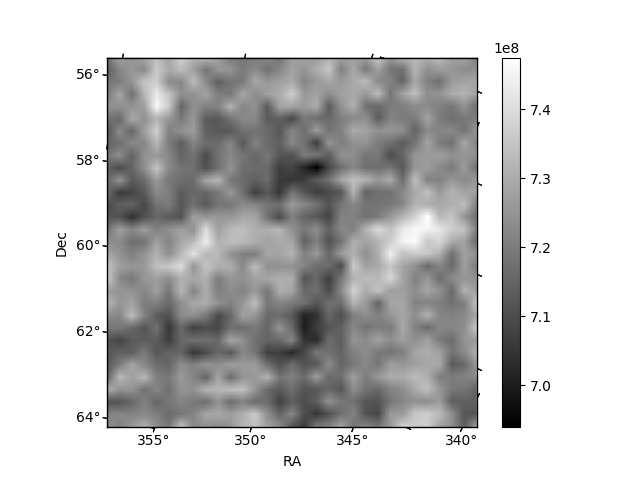
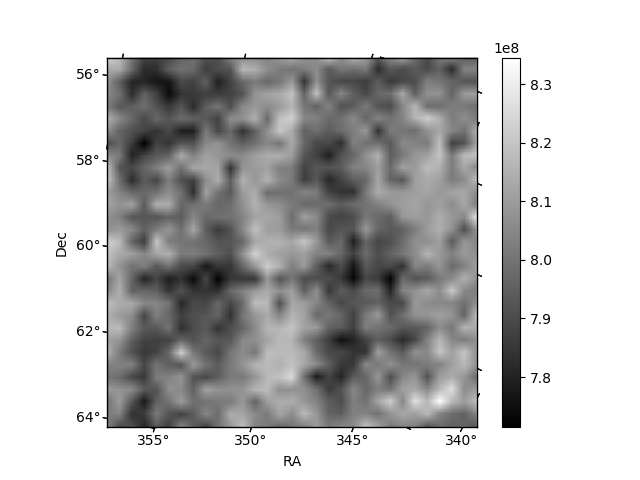
Histogram calculated using DETX and DETY for each event in the final _common_clean file
| Quadrant A |  |
 |
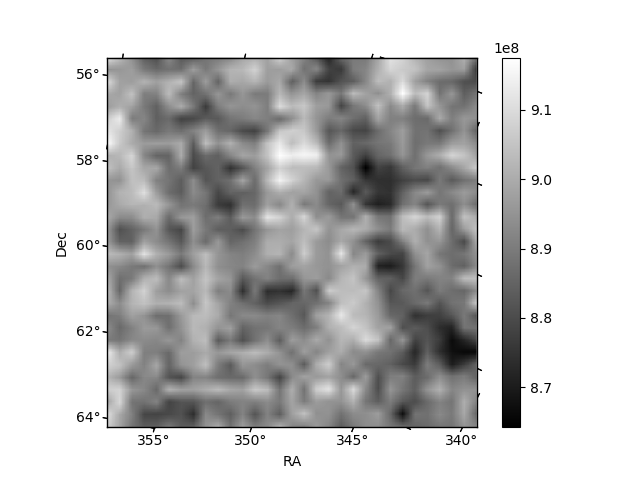
Quadrant B |
|---|---|---|---|
| Quadrant D | 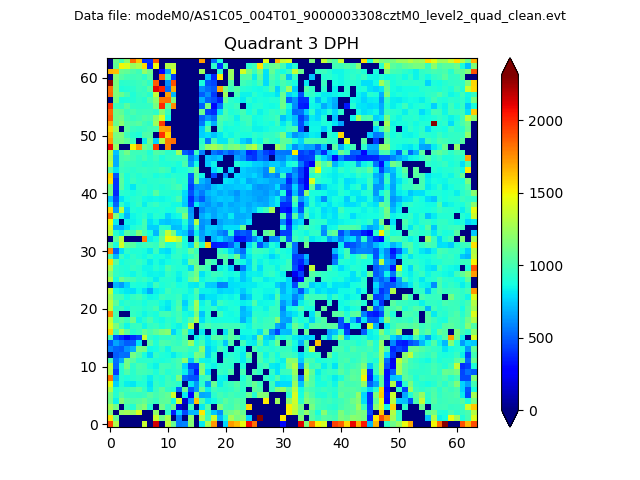 |
 |
Quadrant C |
| Plot type | Count rate plots | Images |
|---|---|---|
| Comparison with Poisson distribution Blue bars denote a histogram of data divided into 1 sec bins. Red curve is a Poisson curve with rate = median count rate of data. |
 |
 |
| Quadrant-wise count rates Data is divided into 100 sec bins |
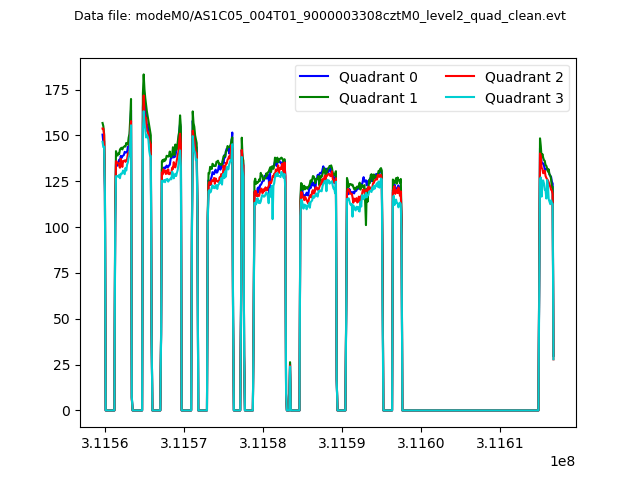 |
|
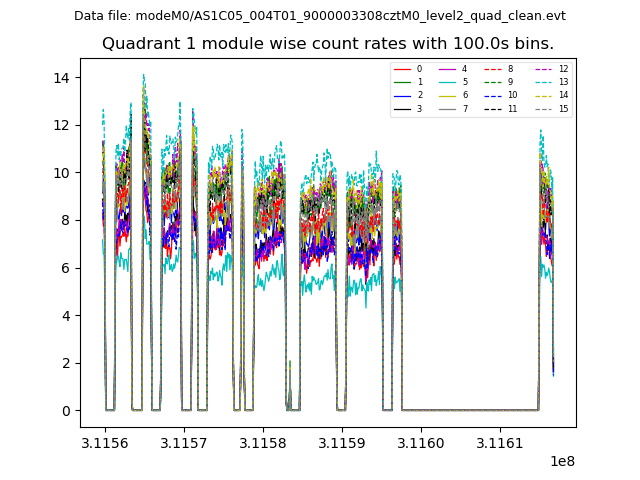
| Module-wise count rates for Quadrant A Data is divided into 100 sec bins |
 |
 |
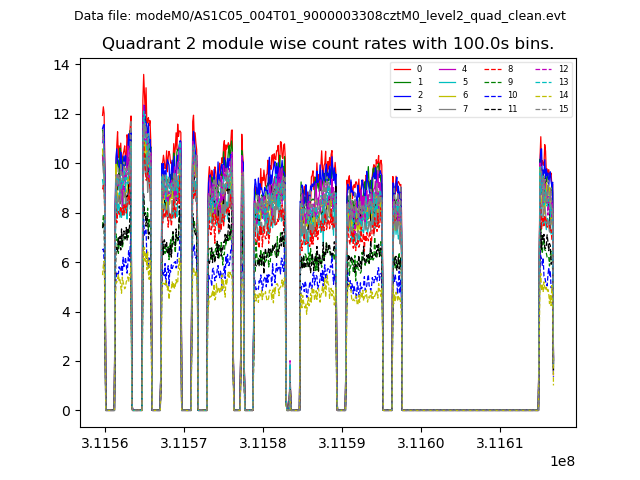
| Module-wise count rates for Quadrant B Data is divided into 100 sec bins |
 |
 |
| Module-wise count rates for Quadrant C Data is divided into 100 sec bins |
 |
 |
| Module-wise count rates for Quadrant D Data is divided into 100 sec bins |
 |
 |
| Parameter | Plot |
|---|---|
| CZT HV Monitor |  |
| D_VDD |  |
| Temperature 1 |  |
| Veto HV Monitor |  |
| Veto LLD |  |
| Alpha Counter | 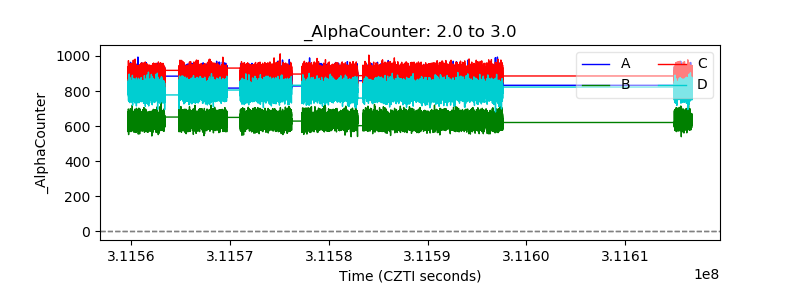 |
| _CPM_Rate |  |
| CZT Counter | 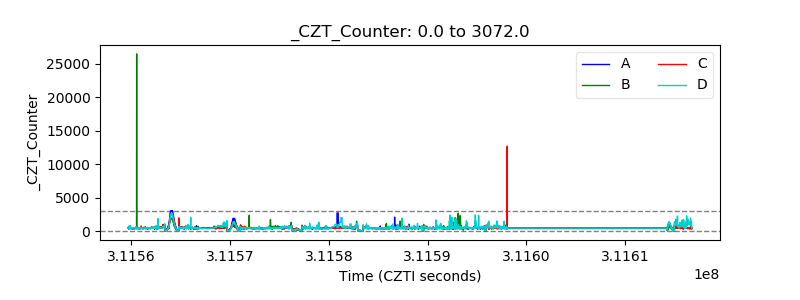 |
| +2.5 Volts monitor |  |
| +5 Volts monitor |  |
| _ROLL_ROT |  |
| _Roll_DEC |  |
| _Roll_RA | 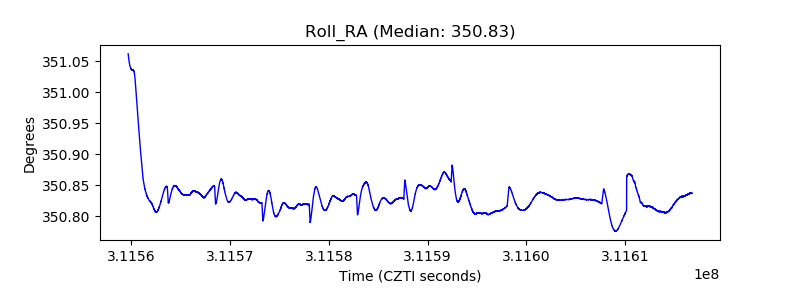 |
| Veto Counter | 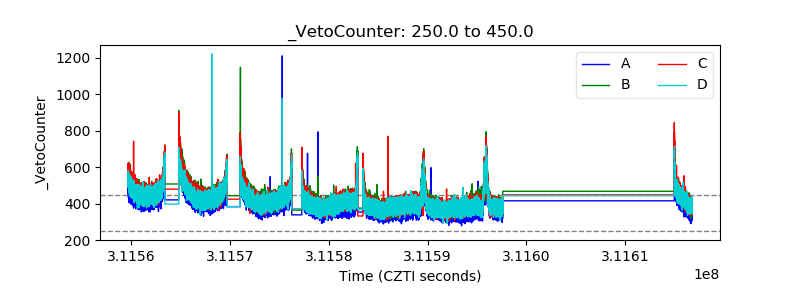 |