| Param | Original file | Final file |
|---|---|---|
| Filename | modeM0/AS1C05_004T01_9000003308_22348cztM0_level2.evt | modeM0/AS1C05_004T01_9000003308_22348cztM0_level2_quad_clean.evt |
| Size (bytes) | 8,383,680 | 2,952,000 |
| Size | 8.0 MB | 2.8 MB |
| Events in quadrant A | 56,705 | 17,638 |
| Events in quadrant B | 61,083 | 18,650 |
| Events in quadrant C | 61,850 | 18,090 |
| Events in quadrant D | 62,383 | 17,490 |
| Mode M0 | |||
|---|---|---|---|
| Quadrant | BADHDUFLAG | Total packets | Discarded packets |
| A | 0 | 242 | 0 |
| B | 0 | 244 | 0 |
| C | 0 | 245 | 0 |
| D | 0 | 248 | 0 |
| Mode SS | |||
|---|---|---|---|
| Quadrant | BADHDUFLAG | Total packets | Discarded packets |
| A | 0 | 2 | 0 |
| B | 0 | 2 | 0 |
| C | 0 | 2 | 0 |
| D | 0 | 2 | 0 |
| Quadrant | Total seconds | Saturated seconds | Saturation percentage |
|---|---|---|---|
| A | 121 | 0 | 0.000000% |
| B | 121 | 2 | 1.652893% |
| C | 121 | 0 | 0.000000% |
| D | 121 | 0 | 0.000000% |
Noise dominated data is calculated using 1-second bins in cleaned event files. If a bin has >2000 counts, and if more than 50% of those come from <1% of pixels, then it is considered to be noise-dominated and hence unusable.
| Quadrant | # 1 sec bins | Bins with >0 counts | Bins with >2000 counts | High rate bins dominated by noise | Noise dominated (total time) | Noise dominated (detector-on time) | Marked lightcurve |
|---|---|---|---|---|---|---|---|
| A | 121 | 121 | 0 | 0 | 0.00% | 0.00% | 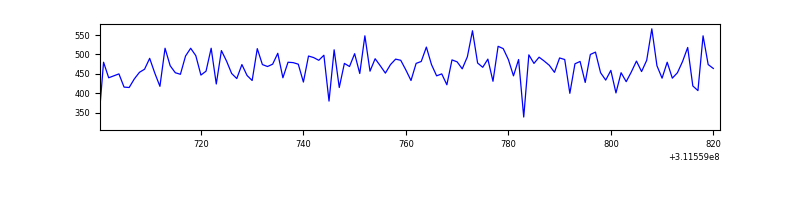 |
| B | 121 | 121 | 0 | 0 | 0.00% | 0.00% | 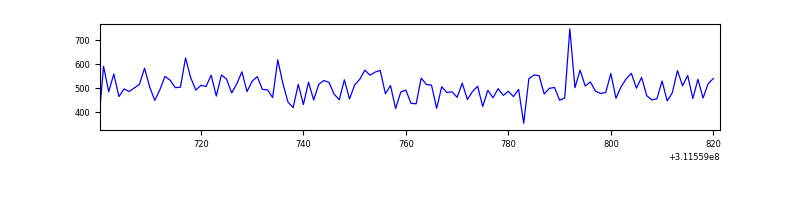 |
| C | 121 | 121 | 0 | 0 | 0.00% | 0.00% | 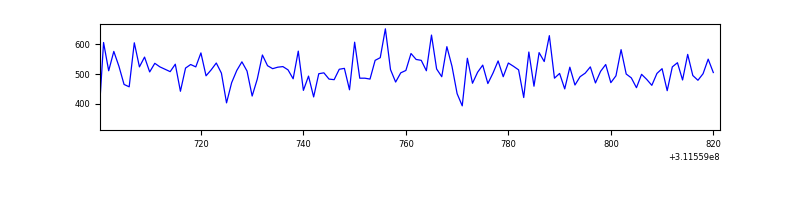 |
| D | 121 | 121 | 0 | 0 | 0.00% | 0.00% | 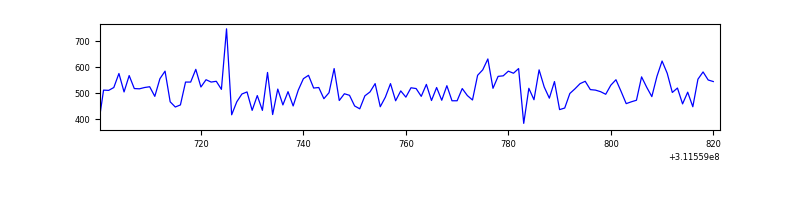 |
Top three noisy pixels from each quadrant. If the there are fewer than three noisy pixels in the level2.evt file, extra rows are filled as -1
| Pixel properties | Quadrant properties | ||||||
|---|---|---|---|---|---|---|---|
| Quadrant | DetID | PixID | Counts | Sigma | Mean | Median | Sigma |
| A | 13 | 254 | 156 | 29.49 | 14 | 14 | 4.8 |
| A | 0 | 226 | 140 | 26.17 | 14 | 14 | 4.8 |
| A | 3 | 137 | 116 | 21.18 | 14 | 14 | 4.8 |
| B | 0 | 229 | 652 | 133.24 | 15 | 15 | 4.8 |
| B | 12 | 111 | 314 | 62.54 | 15 | 15 | 4.8 |
| B | 14 | 111 | 256 | 50.41 | 15 | 15 | 4.8 |
| C | 14 | 238 | 2244 | 422.54 | 15 | 15 | 5.3 |
| C | 13 | 61 | 103 | 16.68 | 15 | 15 | 5.3 |
| C | 3 | 9 | 80 | 12.32 | 15 | 15 | 5.3 |
| D | 12 | 227 | 6848 | 1301.12 | 14 | 14 | 5.3 |
| D | 2 | 234 | 417 | 76.73 | 14 | 14 | 5.3 |
| D | 13 | 243 | 147 | 25.32 | 14 | 14 | 5.3 |
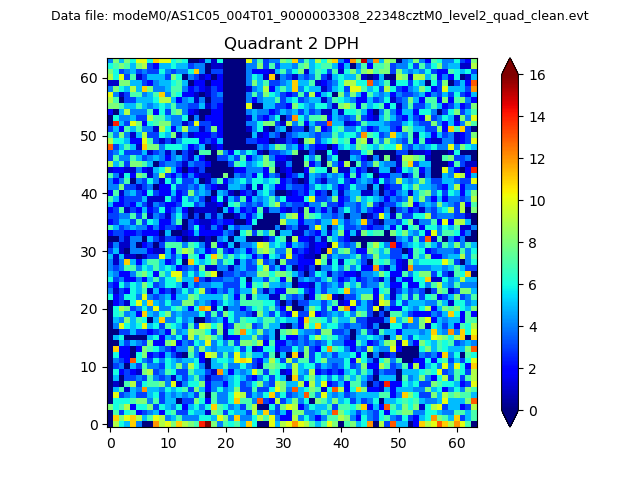
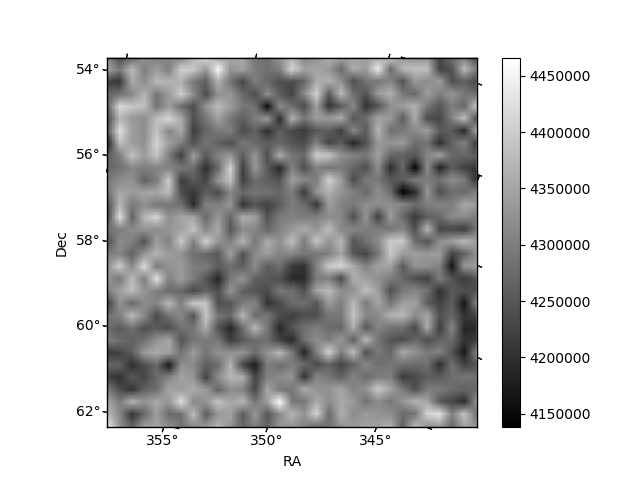
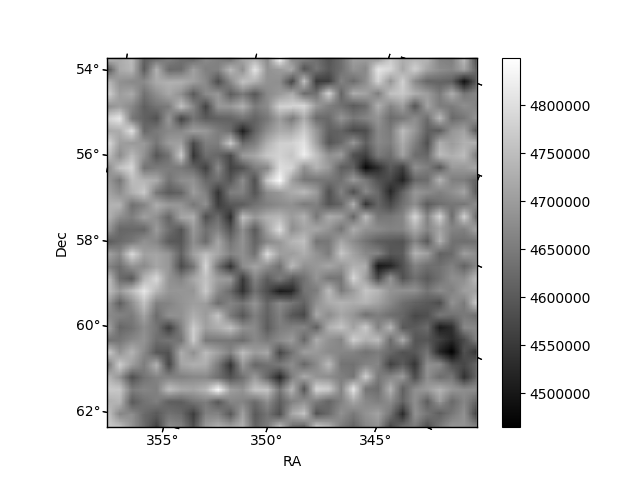
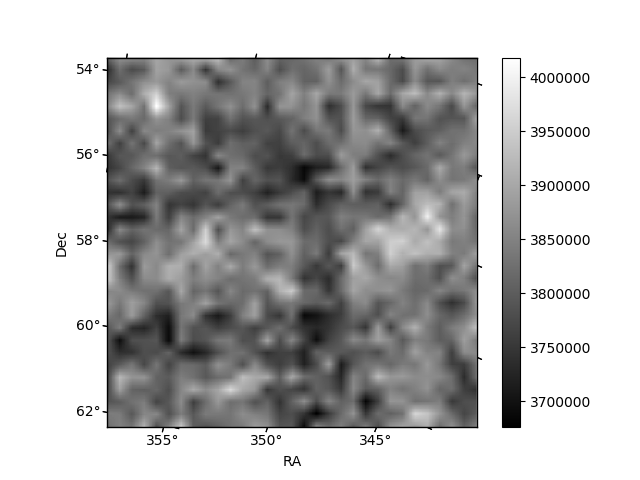
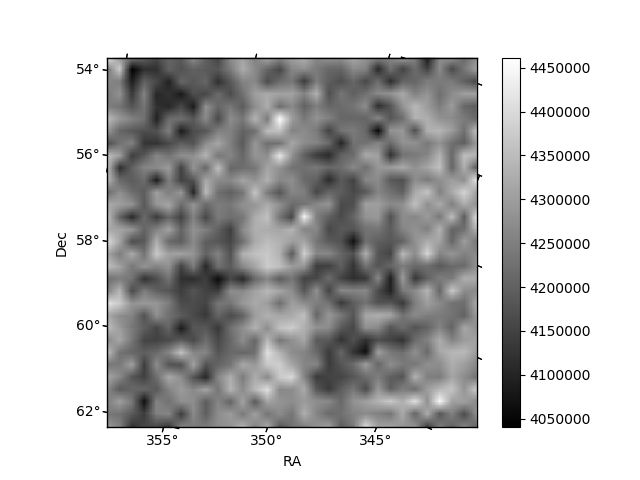
Histogram calculated using DETX and DETY for each event in the final _common_clean file
| Quadrant A | 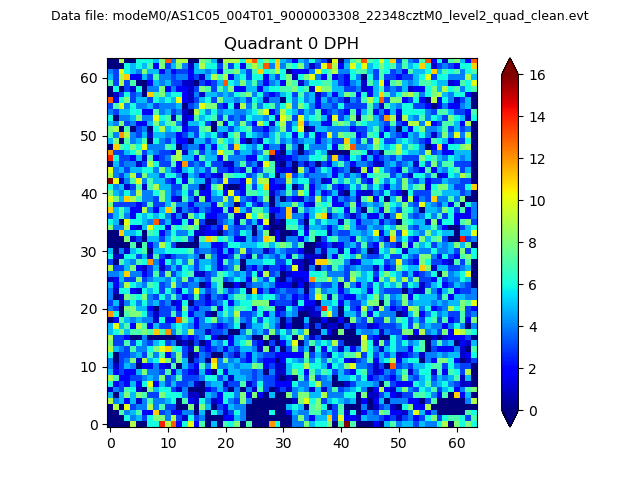 |
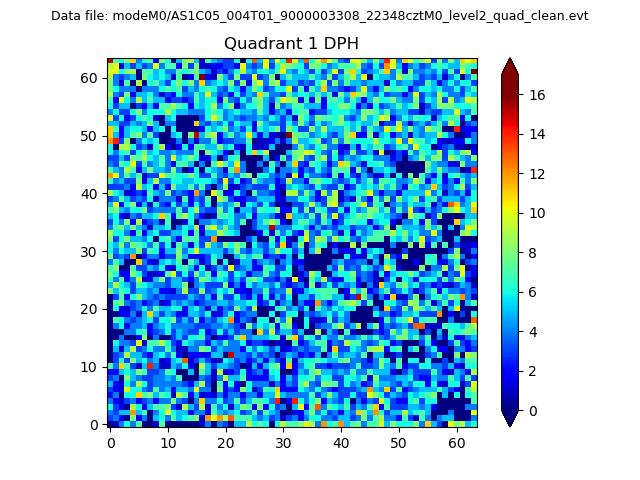 |
Quadrant B |
|---|---|---|---|
| Quadrant D | 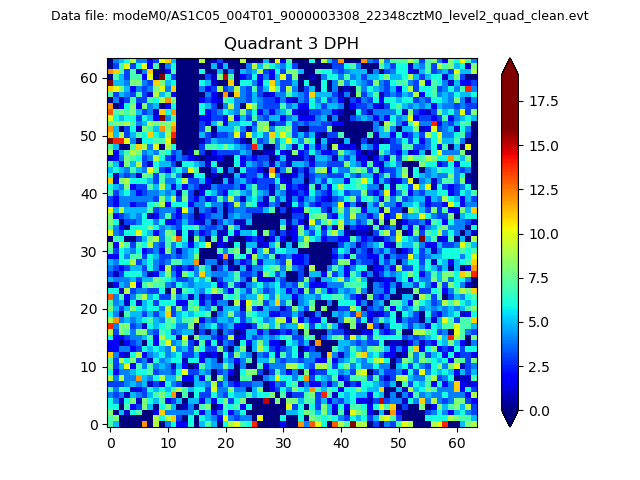 |
 |
Quadrant C |
| Plot type | Count rate plots | Images |
|---|---|---|
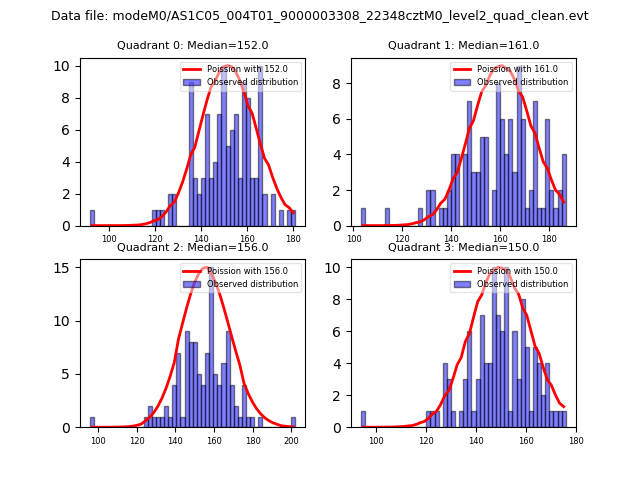
| Comparison with Poisson distribution Blue bars denote a histogram of data divided into 1 sec bins. Red curve is a Poisson curve with rate = median count rate of data. |
 |
 |
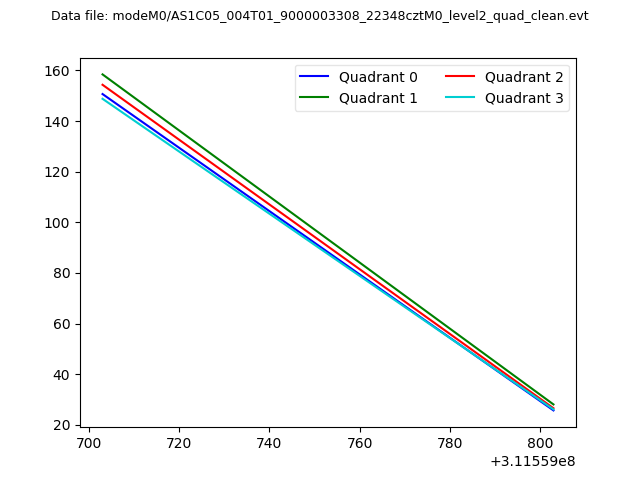
| Quadrant-wise count rates Data is divided into 100 sec bins |
 |
|
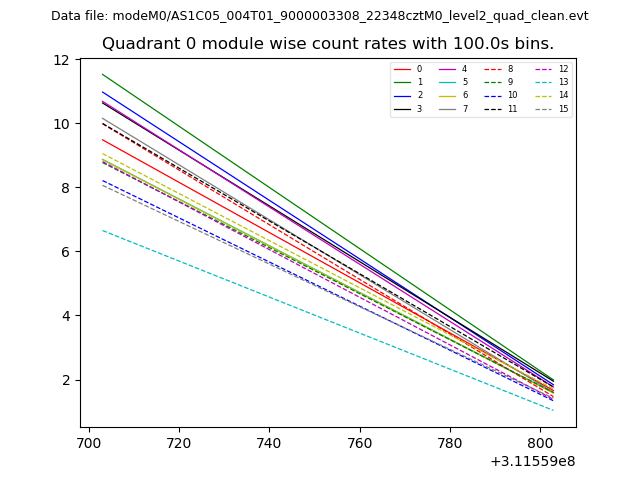
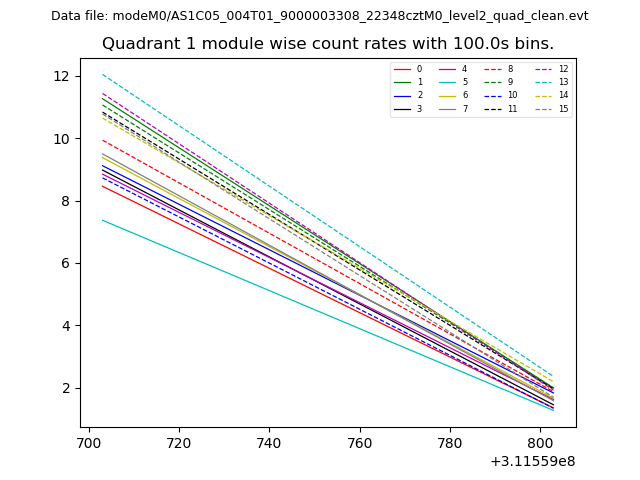
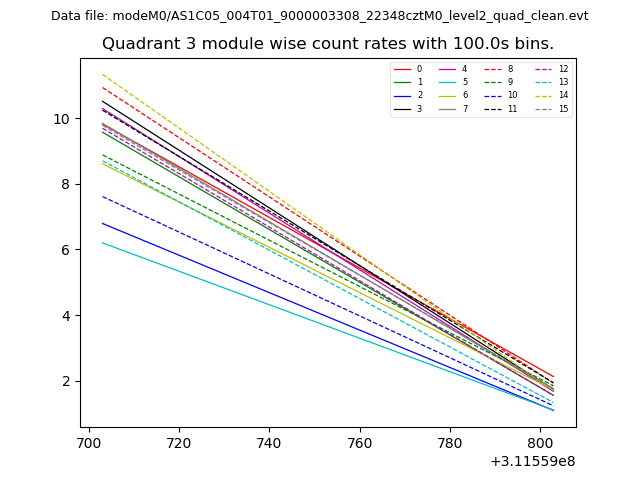
| Module-wise count rates for Quadrant A Data is divided into 100 sec bins |
 |
 |
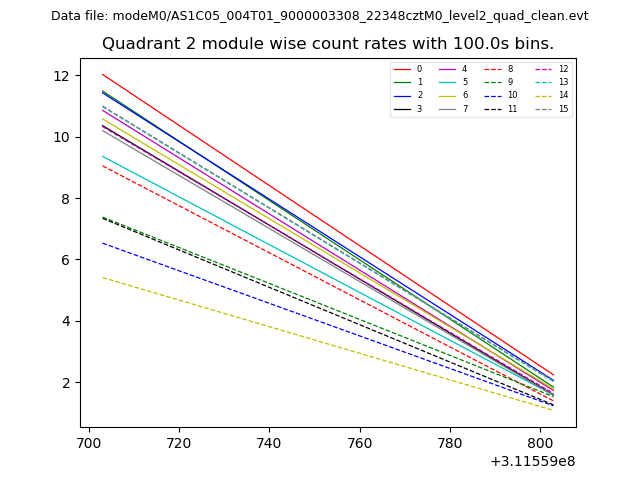
| Module-wise count rates for Quadrant B Data is divided into 100 sec bins |
 |
 |
| Module-wise count rates for Quadrant C Data is divided into 100 sec bins |
 |
 |
| Module-wise count rates for Quadrant D Data is divided into 100 sec bins |
 |
 |
| Parameter | Plot |
|---|---|
| CZT HV Monitor | 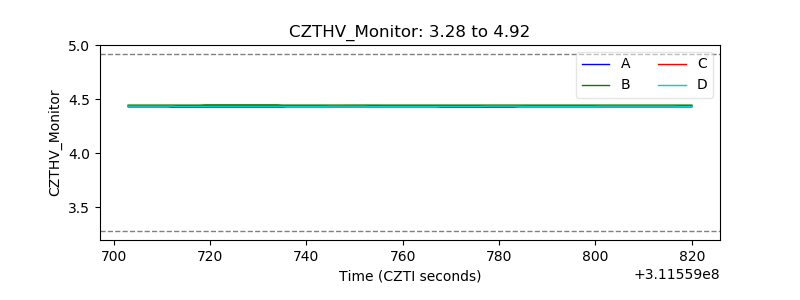 |
| D_VDD |  |
| Temperature 1 |  |
| Veto HV Monitor | 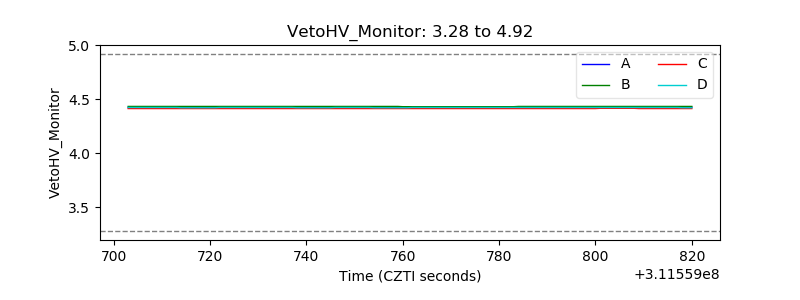 |
| Veto LLD | 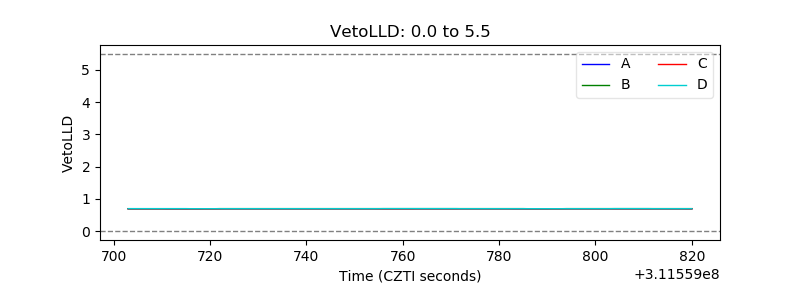 |
| Alpha Counter | 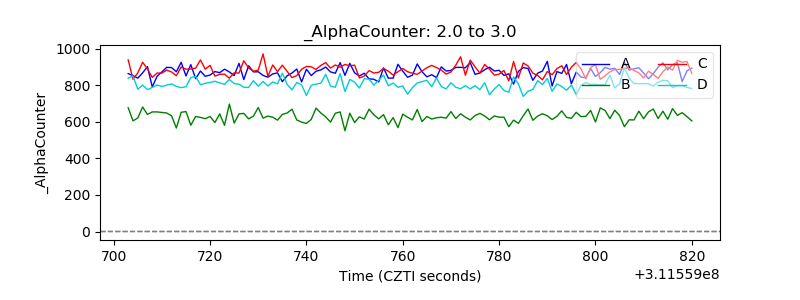 |
| _CPM_Rate | 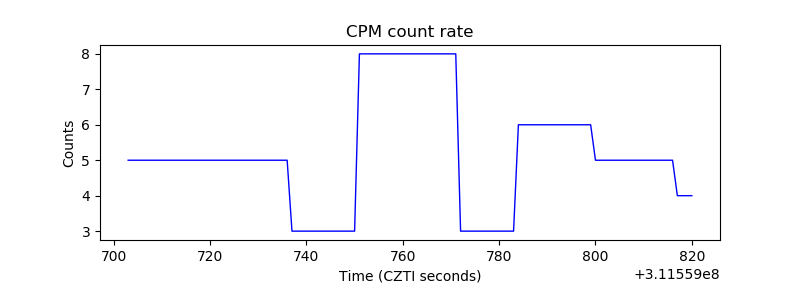 |
| CZT Counter | 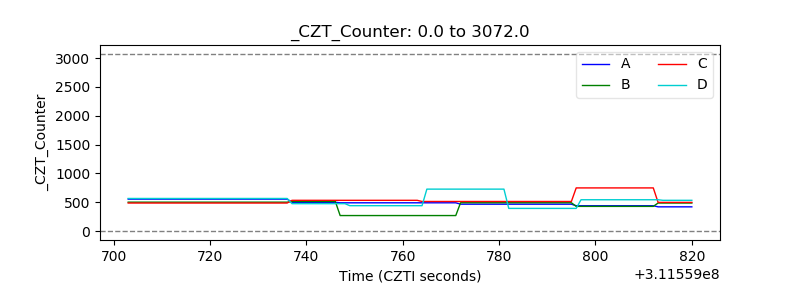 |
| +2.5 Volts monitor | 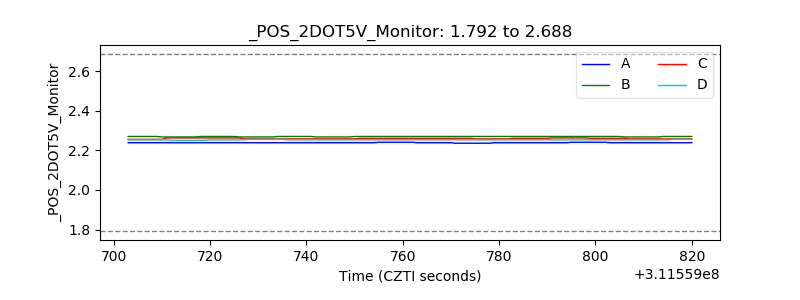 |
| +5 Volts monitor |  |
| _ROLL_ROT | 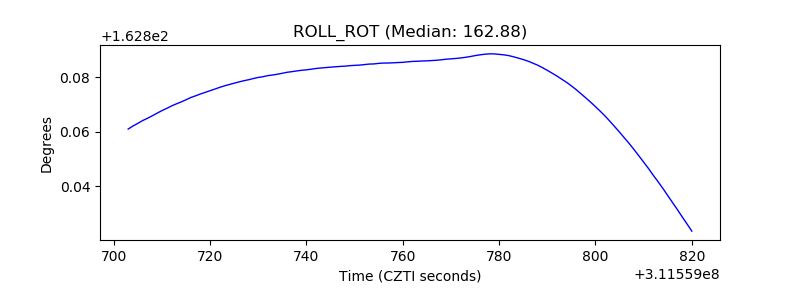 |
| _Roll_DEC | 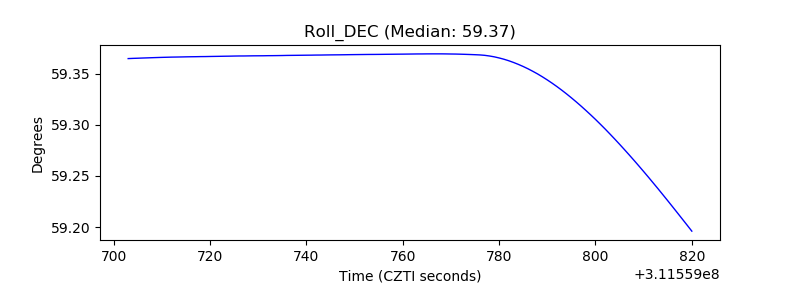 |
| _Roll_RA | 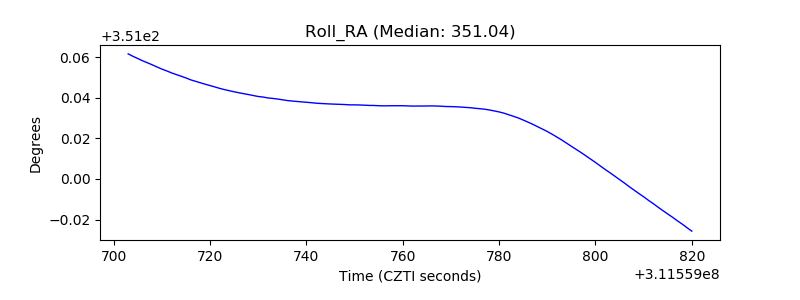 |
| Veto Counter | 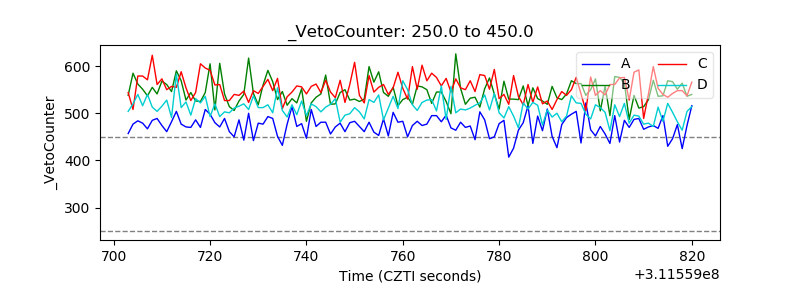 |