| Param | Original file | Final file |
|---|---|---|
| Filename | modeM0/AS1C05_004T01_9000003308_22349cztM0_level2.evt | modeM0/AS1C05_004T01_9000003308_22349cztM0_level2_quad_clean.evt |
| Size (bytes) | 355,046,400 | 81,420,480 |
| Size | 338.6 MB | 77.6 MB |
| Events in quadrant A | 2,519,314 | 528,441 |
| Events in quadrant B | 2,642,860 | 547,611 |
| Events in quadrant C | 2,612,334 | 520,553 |
| Events in quadrant D | 2,621,437 | 502,214 |
| Mode M0 | |||
|---|---|---|---|
| Quadrant | BADHDUFLAG | Total packets | Discarded packets |
| A | 0 | 10785 | 1 |
| B | 0 | 11020 | 1 |
| C | 0 | 10933 | 1 |
| D | 0 | 11266 | 1 |
| Mode SS | |||
|---|---|---|---|
| Quadrant | BADHDUFLAG | Total packets | Discarded packets |
| A | 0 | 106 | 0 |
| B | 0 | 106 | 0 |
| C | 0 | 106 | 0 |
| D | 0 | 106 | 0 |
| Mode M9 | |||
|---|---|---|---|
| Quadrant | BADHDUFLAG | Total packets | Discarded packets |
| A | 0 | 14 | 0 |
| B | 0 | 14 | 0 |
| C | 0 | 14 | 0 |
| D | 0 | 14 | 0 |
| Quadrant | Total seconds | Saturated seconds | Saturation percentage |
|---|---|---|---|
| A | 5240 | 29 | 0.553435% |
| B | 5240 | 36 | 0.687023% |
| C | 5240 | 68 | 1.297710% |
| D | 5240 | 29 | 0.553435% |
Noise dominated data is calculated using 1-second bins in cleaned event files. If a bin has >2000 counts, and if more than 50% of those come from <1% of pixels, then it is considered to be noise-dominated and hence unusable.
| Quadrant | # 1 sec bins | Bins with >0 counts | Bins with >2000 counts | High rate bins dominated by noise | Noise dominated (total time) | Noise dominated (detector-on time) | Marked lightcurve |
|---|---|---|---|---|---|---|---|
| A | 6645 | 5241 | 0 | 0 | 0.00% | 0.00% | 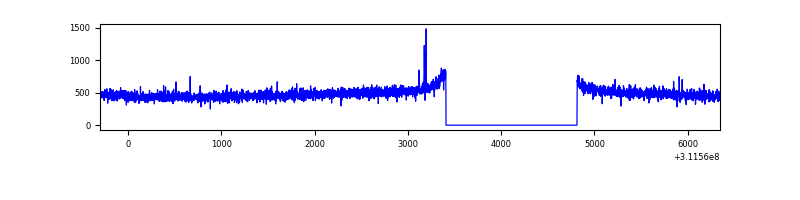 |
| B | 6645 | 5241 | 0 | 0 | 0.00% | 0.00% | 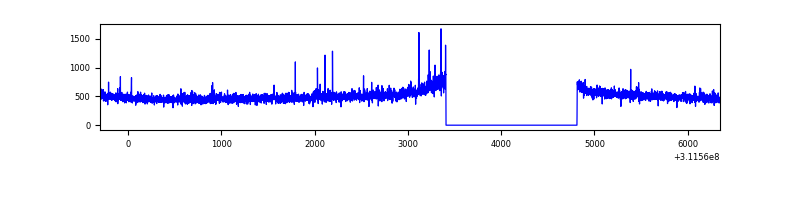 |
| C | 6645 | 5240 | 0 | 0 | 0.00% | 0.00% | 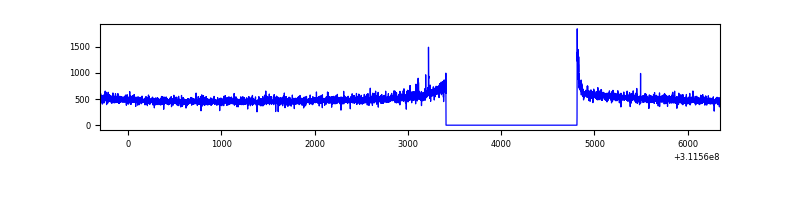 |
| D | 6645 | 5241 | 14 | 14 | 0.21% | 0.27% | 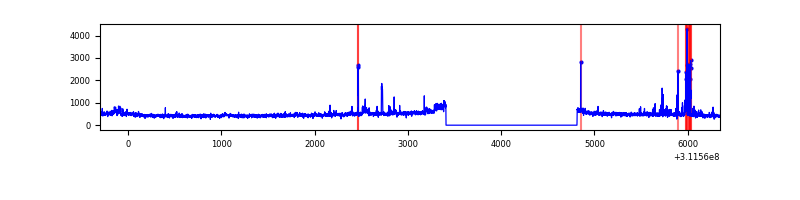 |
Top three noisy pixels from each quadrant. If the there are fewer than three noisy pixels in the level2.evt file, extra rows are filled as -1
| Pixel properties | Quadrant properties | ||||||
|---|---|---|---|---|---|---|---|
| Quadrant | DetID | PixID | Counts | Sigma | Mean | Median | Sigma |
| A | 13 | 254 | 7099 | 49.72 | 652 | 641 | 129.9 |
| A | 0 | 226 | 5723 | 39.13 | 652 | 641 | 129.9 |
| A | 3 | 137 | 5257 | 35.54 | 652 | 641 | 129.9 |
| B | 0 | 229 | 21847 | 175.84 | 659 | 644 | 120.6 |
| B | 12 | 111 | 14529 | 115.15 | 659 | 644 | 120.6 |
| B | 11 | 111 | 12445 | 97.87 | 659 | 644 | 120.6 |
| C | 14 | 238 | 102394 | 689.41 | 637 | 643 | 147.6 |
| C | 0 | 10 | 15299 | 99.3 | 637 | 643 | 147.6 |
| C | 0 | 207 | 8303 | 51.9 | 637 | 643 | 147.6 |
| D | 12 | 227 | 98120 | 636.64 | 633 | 615 | 153.2 |
| D | 7 | 223 | 80523 | 521.74 | 633 | 615 | 153.2 |
| D | 1 | 52 | 42031 | 270.42 | 633 | 615 | 153.2 |
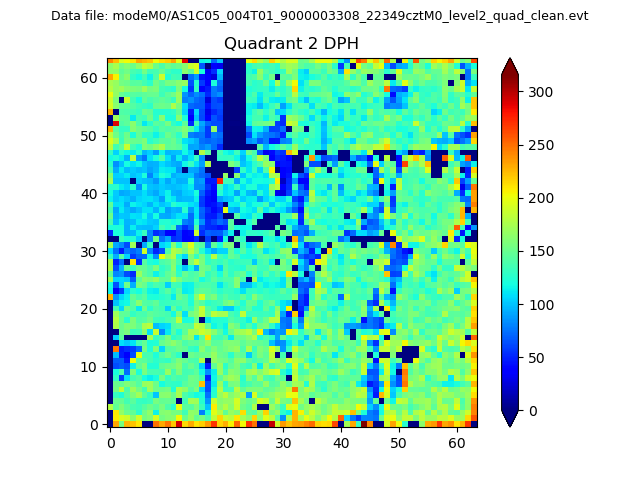
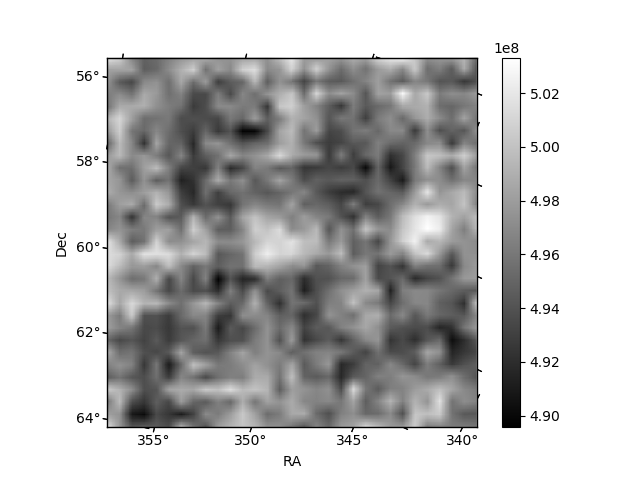
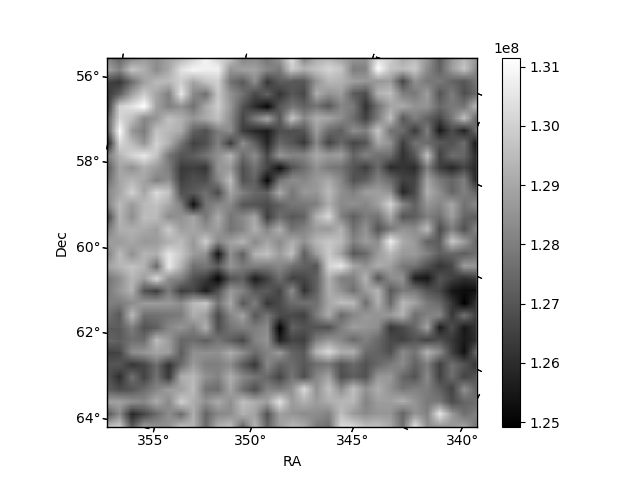
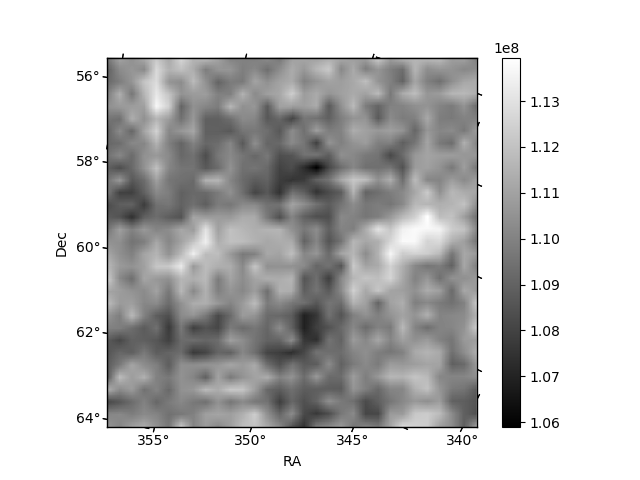
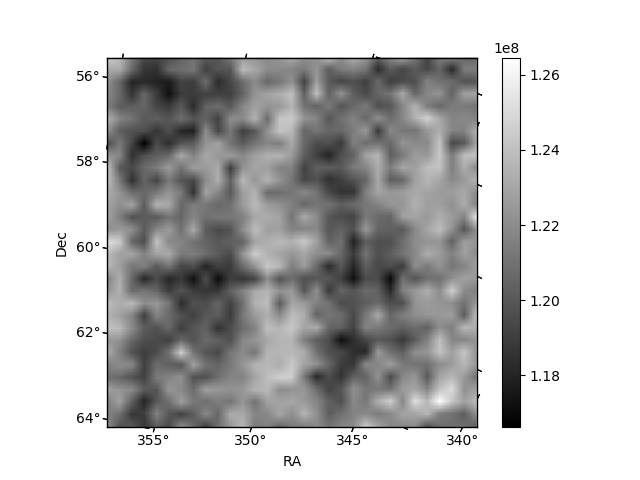
Histogram calculated using DETX and DETY for each event in the final _common_clean file
| Quadrant A | 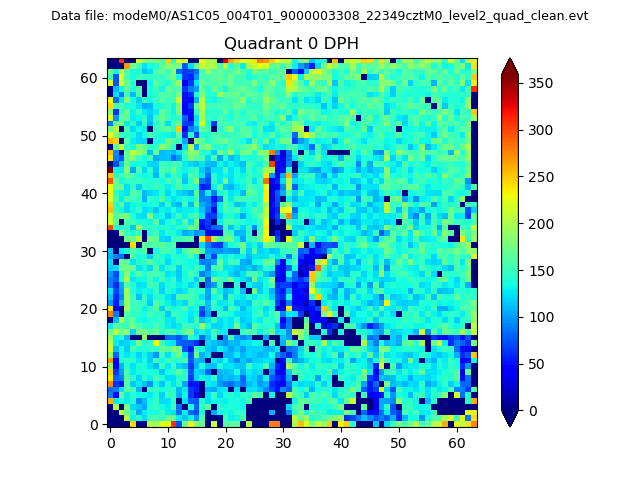 |
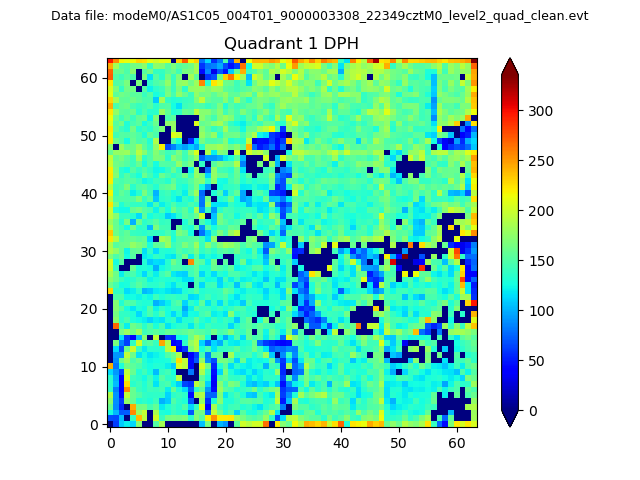 |
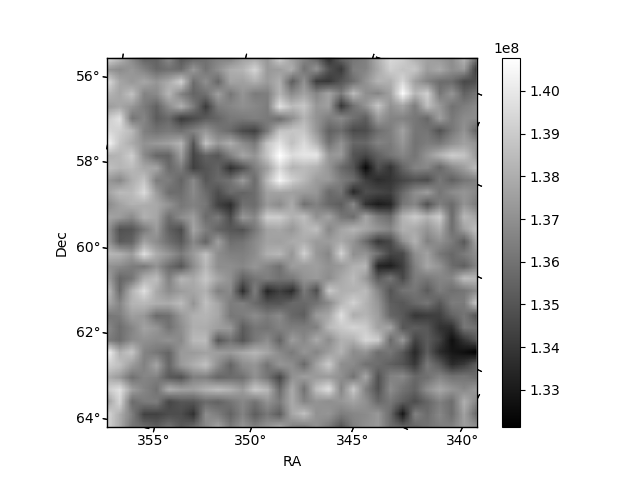
Quadrant B |
|---|---|---|---|
| Quadrant D | 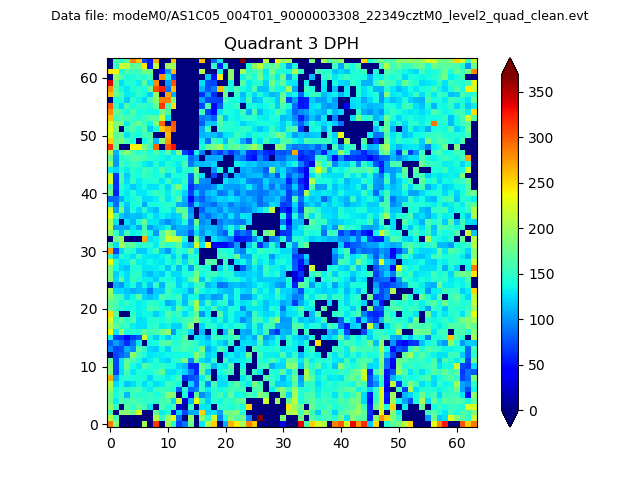 |
 |
Quadrant C |
| Plot type | Count rate plots | Images |
|---|---|---|
| Comparison with Poisson distribution Blue bars denote a histogram of data divided into 1 sec bins. Red curve is a Poisson curve with rate = median count rate of data. |
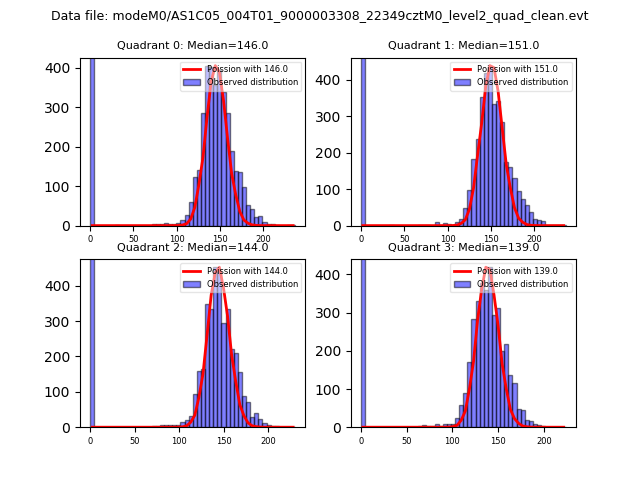 |
 |
| Quadrant-wise count rates Data is divided into 100 sec bins |
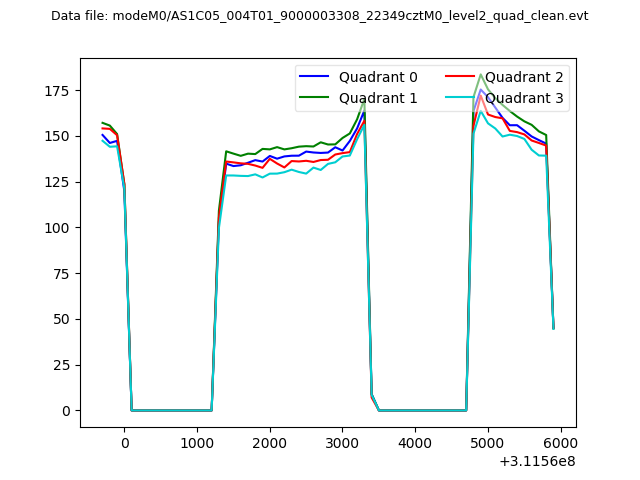 |
|
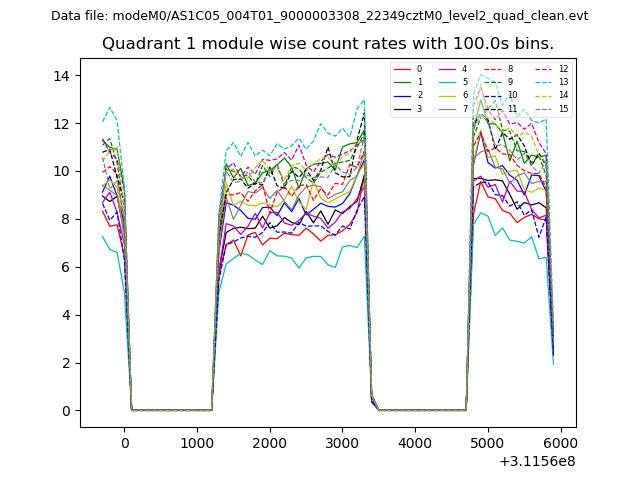
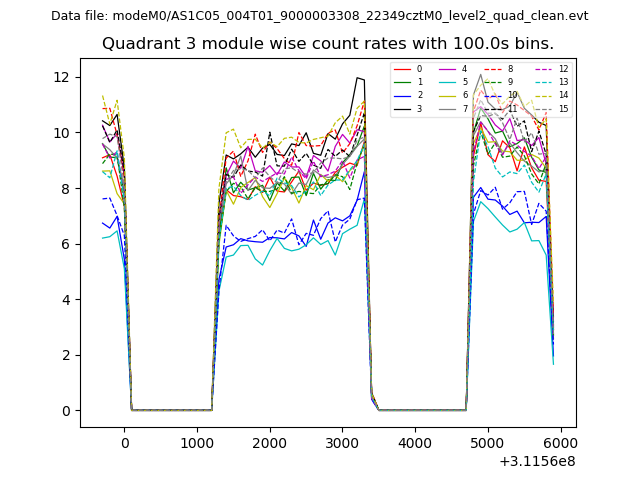
| Module-wise count rates for Quadrant A Data is divided into 100 sec bins |
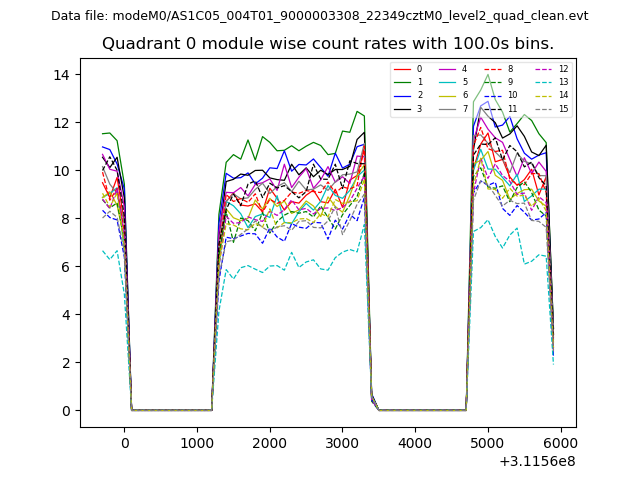 |
 |
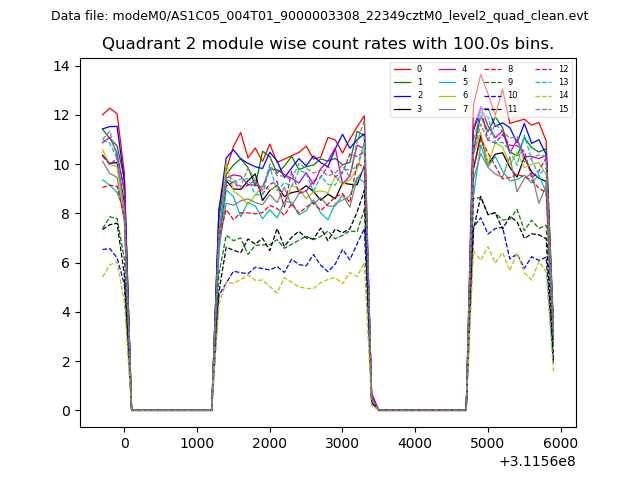
| Module-wise count rates for Quadrant B Data is divided into 100 sec bins |
 |
 |
| Module-wise count rates for Quadrant C Data is divided into 100 sec bins |
 |
 |
| Module-wise count rates for Quadrant D Data is divided into 100 sec bins |
 |
 |
| Parameter | Plot |
|---|---|
| CZT HV Monitor | 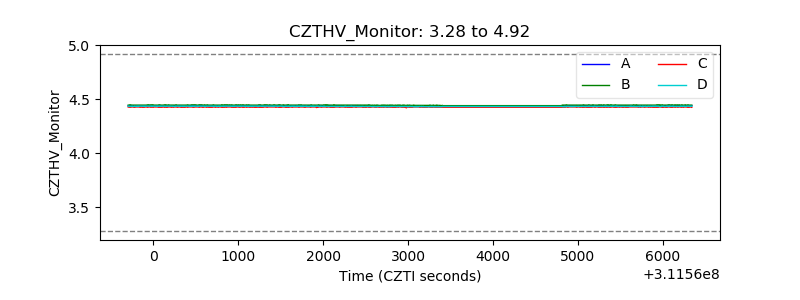 |
| D_VDD | 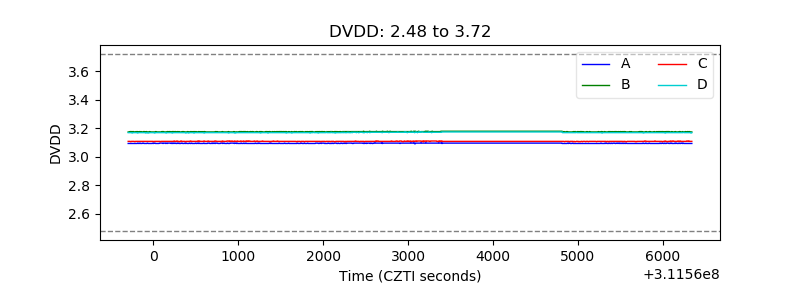 |
| Temperature 1 |  |
| Veto HV Monitor | 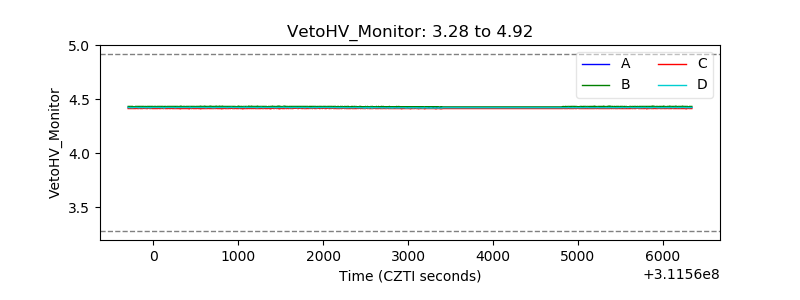 |
| Veto LLD | 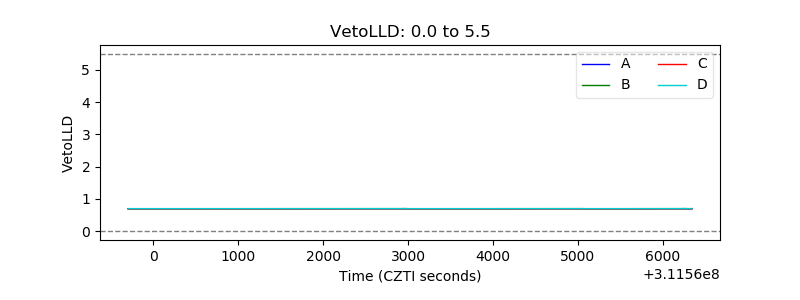 |
| Alpha Counter | 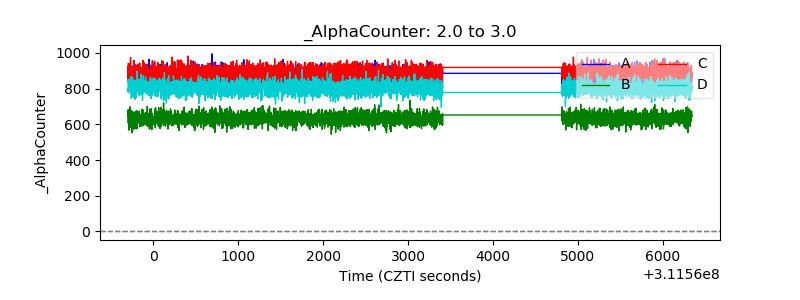 |
| _CPM_Rate | 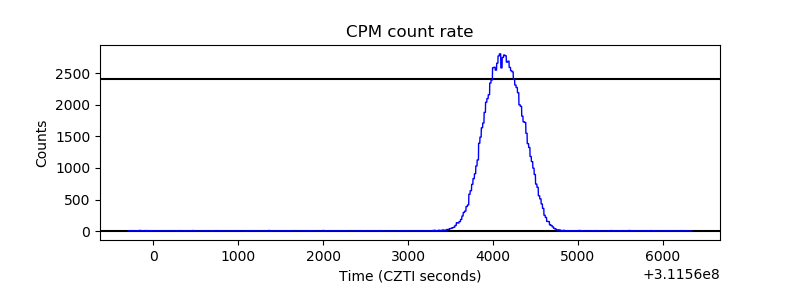 |
| CZT Counter | 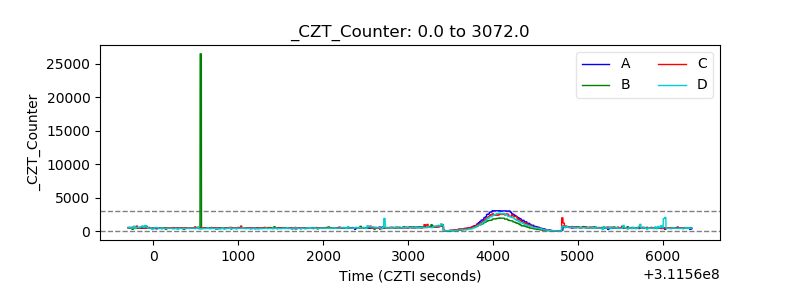 |
| +2.5 Volts monitor | 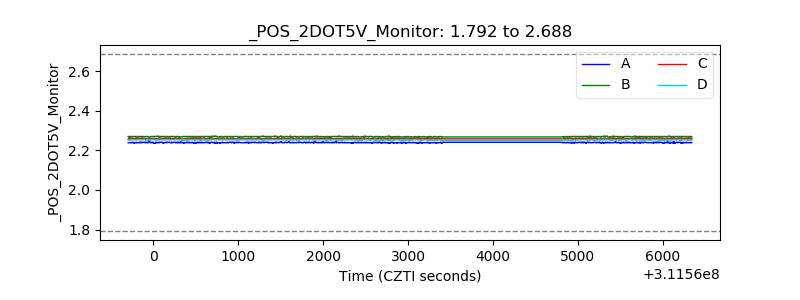 |
| +5 Volts monitor |  |
| _ROLL_ROT |  |
| _Roll_DEC | 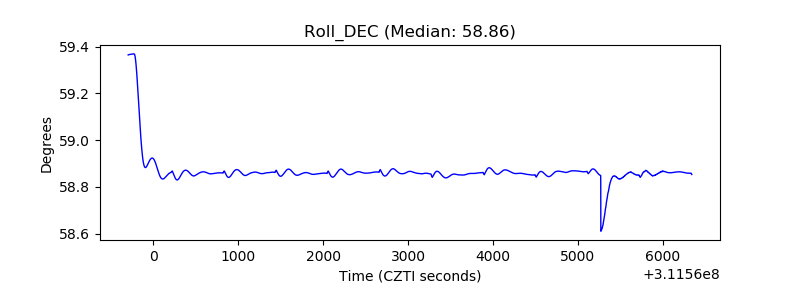 |
| _Roll_RA | 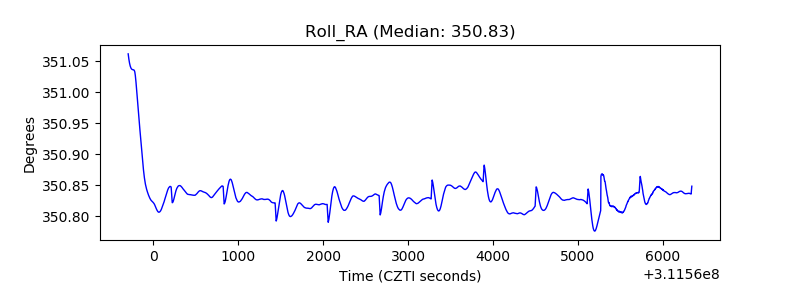 |
| Veto Counter | 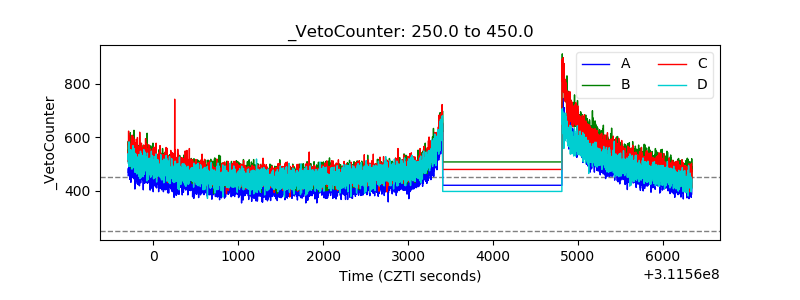 |