| Param | Original file | Final file |
|---|---|---|
| Filename | modeM0/AS1C05_004T01_9000003308_22350cztM0_level2.evt | modeM0/AS1C05_004T01_9000003308_22350cztM0_level2_quad_clean.evt |
| Size (bytes) | 447,295,680 | 98,179,200 |
| Size | 426.6 MB | 93.6 MB |
| Events in quadrant A | 3,133,129 | 639,796 |
| Events in quadrant B | 3,262,926 | 659,120 |
| Events in quadrant C | 3,185,611 | 621,980 |
| Events in quadrant D | 3,524,518 | 600,728 |
| Mode M0 | |||
|---|---|---|---|
| Quadrant | BADHDUFLAG | Total packets | Discarded packets |
| A | 0 | 13389 | 2 |
| B | 0 | 13656 | 2 |
| C | 0 | 13462 | 2 |
| D | 0 | 14973 | 2 |
| Mode SS | |||
|---|---|---|---|
| Quadrant | BADHDUFLAG | Total packets | Discarded packets |
| A | 0 | 132 | 0 |
| B | 0 | 132 | 0 |
| C | 0 | 132 | 0 |
| D | 0 | 132 | 0 |
| Mode M9 | |||
|---|---|---|---|
| Quadrant | BADHDUFLAG | Total packets | Discarded packets |
| A | 0 | 17 | 0 |
| B | 0 | 18 | 0 |
| C | 0 | 18 | 0 |
| D | 0 | 18 | 0 |
| Quadrant | Total seconds | Saturated seconds | Saturation percentage |
|---|---|---|---|
| A | 6475 | 14 | 0.216216% |
| B | 6475 | 30 | 0.463320% |
| C | 6475 | 66 | 1.019305% |
| D | 6475 | 75 | 1.158301% |
Noise dominated data is calculated using 1-second bins in cleaned event files. If a bin has >2000 counts, and if more than 50% of those come from <1% of pixels, then it is considered to be noise-dominated and hence unusable.
| Quadrant | # 1 sec bins | Bins with >0 counts | Bins with >2000 counts | High rate bins dominated by noise | Noise dominated (total time) | Noise dominated (detector-on time) | Marked lightcurve |
|---|---|---|---|---|---|---|---|
| A | 7820 | 6476 | 0 | 0 | 0.00% | 0.00% | 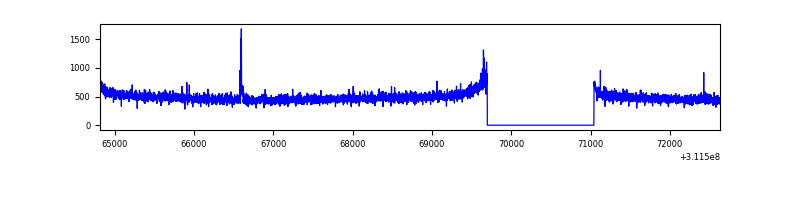 |
| B | 7820 | 6476 | 1 | 1 | 0.01% | 0.02% | 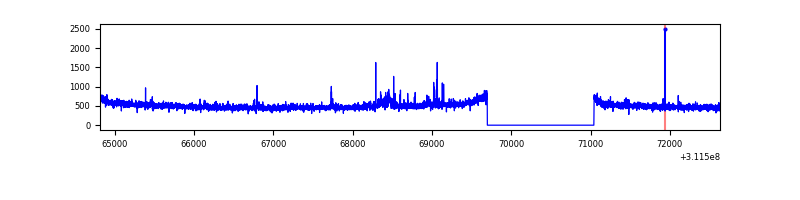 |
| C | 7820 | 6476 | 0 | 0 | 0.00% | 0.00% | 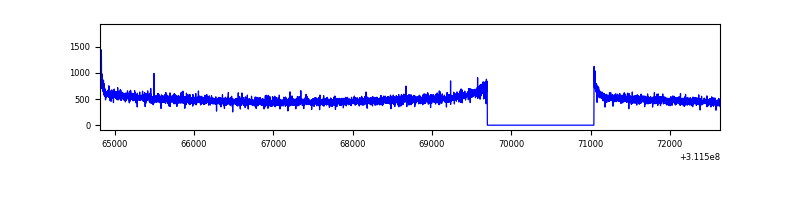 |
| D | 7820 | 6476 | 21 | 21 | 0.27% | 0.32% | 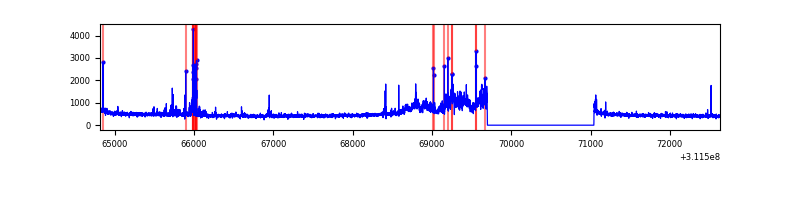 |
Top three noisy pixels from each quadrant. If the there are fewer than three noisy pixels in the level2.evt file, extra rows are filled as -1
| Pixel properties | Quadrant properties | ||||||
|---|---|---|---|---|---|---|---|
| Quadrant | DetID | PixID | Counts | Sigma | Mean | Median | Sigma |
| A | 3 | 1 | 28786 | 174.87 | 805 | 790 | 160.1 |
| A | 13 | 254 | 9203 | 52.55 | 805 | 790 | 160.1 |
| A | 0 | 226 | 7089 | 39.35 | 805 | 790 | 160.1 |
| B | 0 | 197 | 28389 | 184.09 | 812 | 793 | 149.9 |
| B | 0 | 229 | 20904 | 134.16 | 812 | 793 | 149.9 |
| B | 12 | 111 | 17635 | 112.35 | 812 | 793 | 149.9 |
| C | 14 | 238 | 126029 | 689.71 | 778 | 783 | 181.6 |
| C | 0 | 10 | 20826 | 110.37 | 778 | 783 | 181.6 |
| C | 3 | 9 | 6513 | 31.55 | 778 | 783 | 181.6 |
| D | 12 | 227 | 435137 | 2318.68 | 776 | 753 | 187.3 |
| D | 7 | 223 | 82837 | 438.15 | 776 | 753 | 187.3 |
| D | 1 | 52 | 36811 | 192.47 | 776 | 753 | 187.3 |
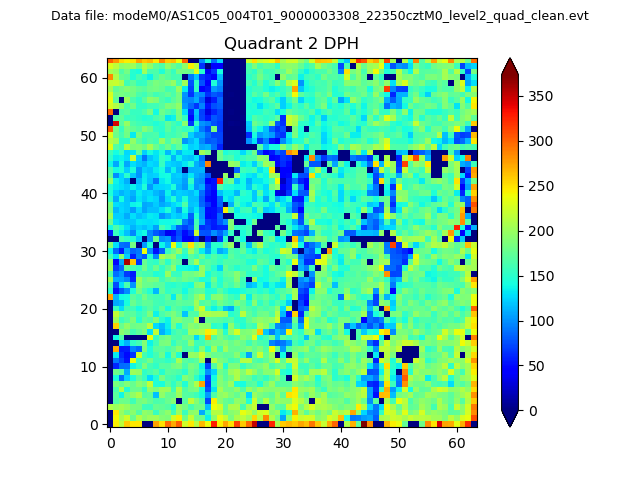
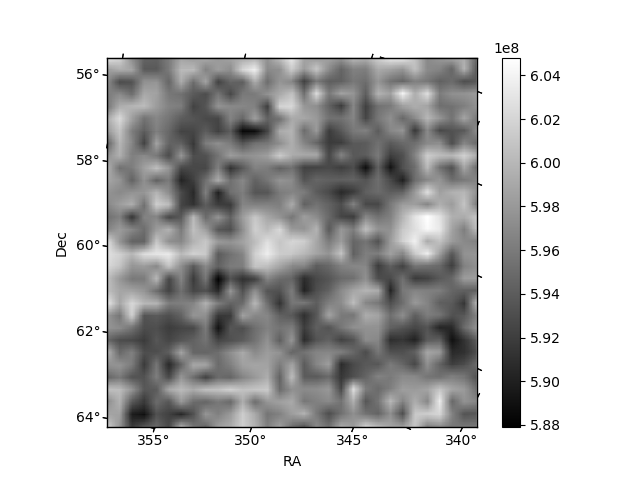
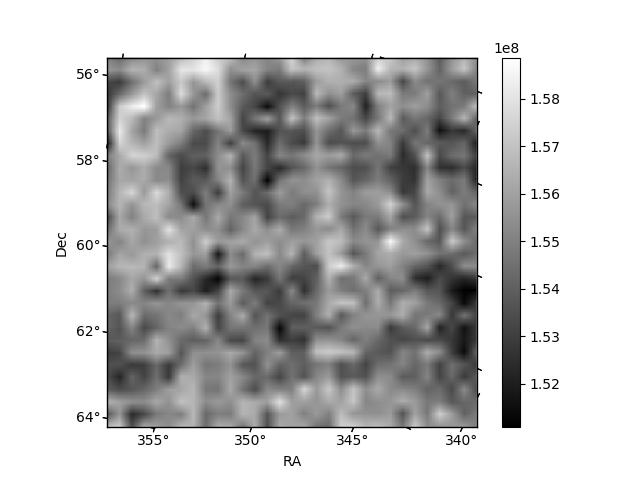
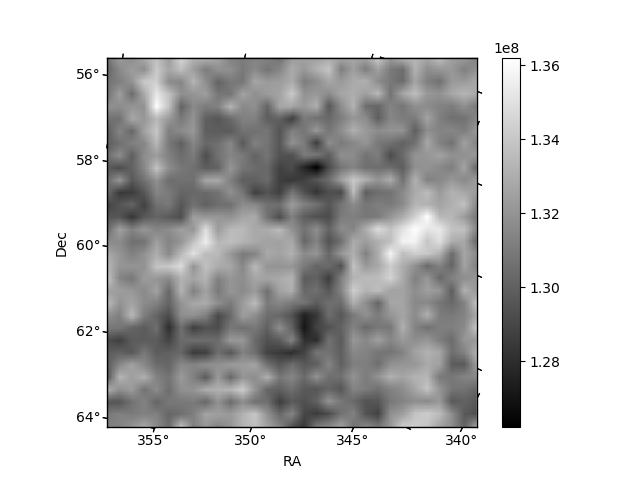
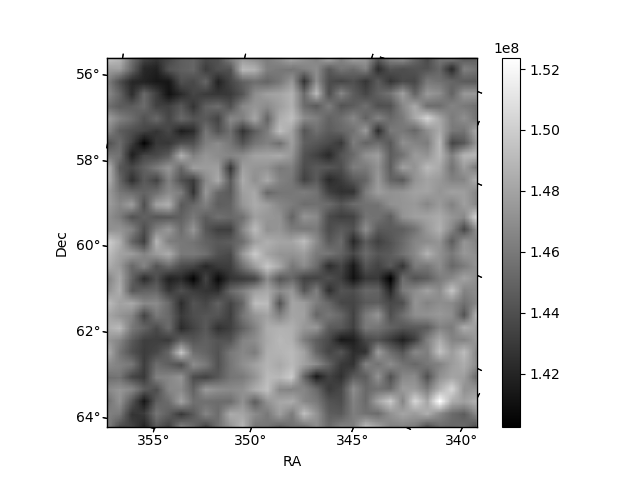
Histogram calculated using DETX and DETY for each event in the final _common_clean file
| Quadrant A | 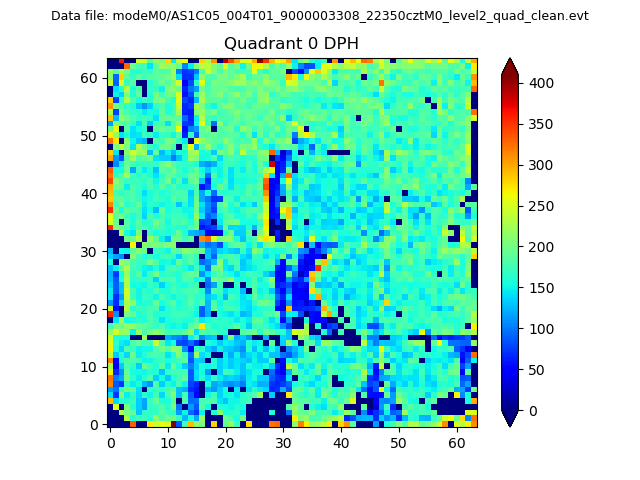 |
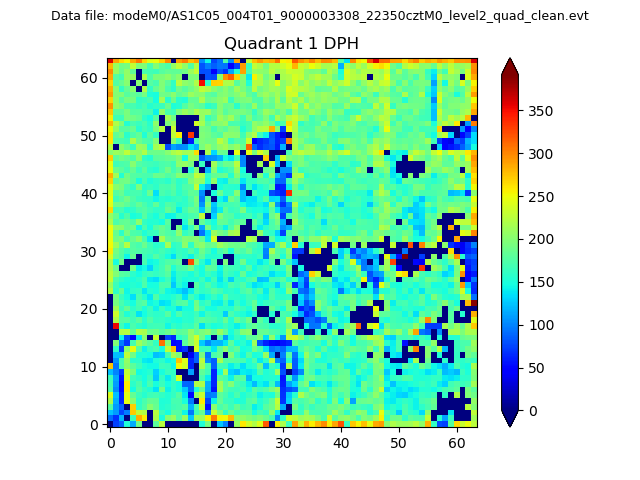 |
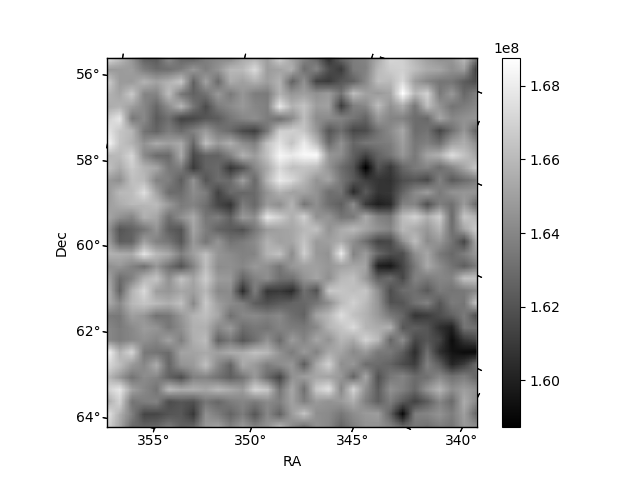
Quadrant B |
|---|---|---|---|
| Quadrant D | 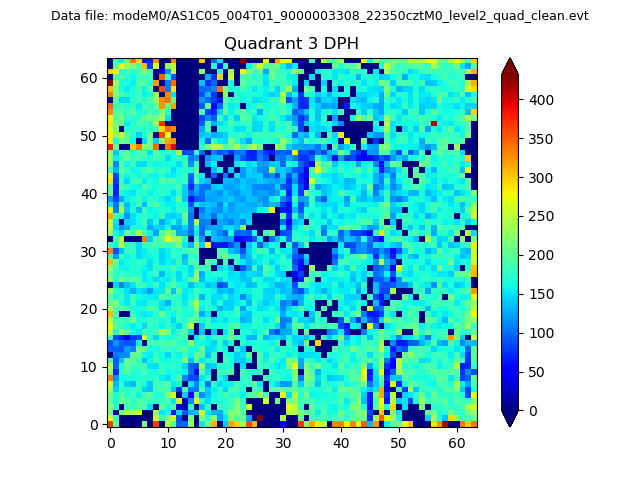 |
 |
Quadrant C |
| Plot type | Count rate plots | Images |
|---|---|---|
| Comparison with Poisson distribution Blue bars denote a histogram of data divided into 1 sec bins. Red curve is a Poisson curve with rate = median count rate of data. |
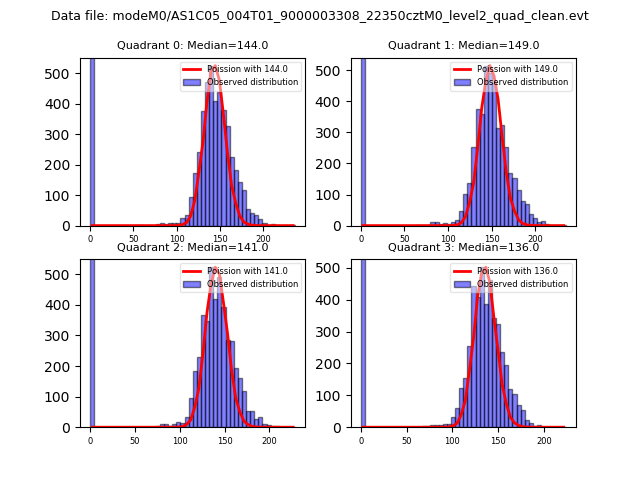 |
 |
| Quadrant-wise count rates Data is divided into 100 sec bins |
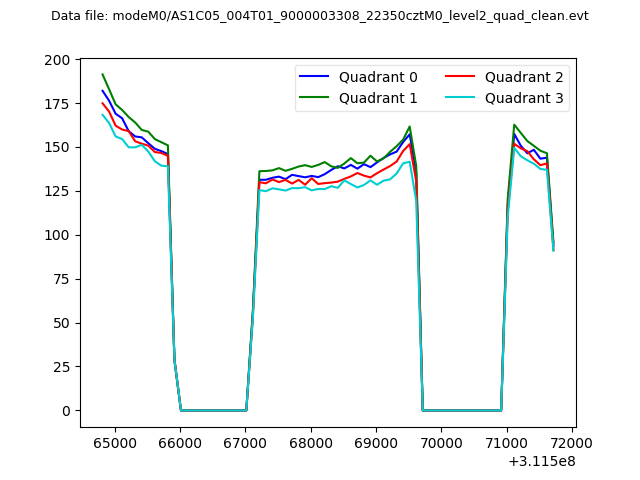 |
|
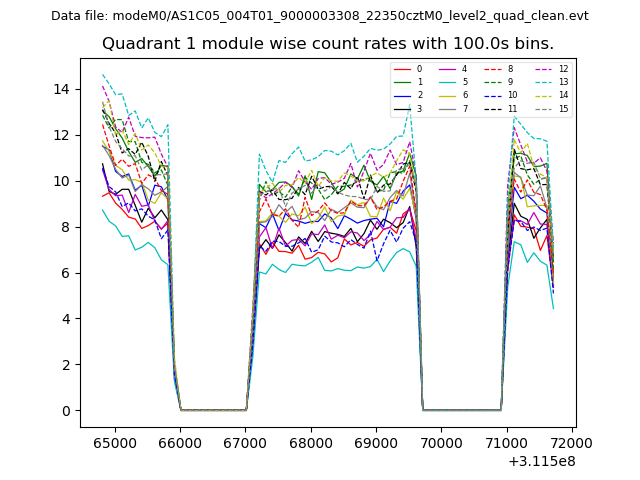
| Module-wise count rates for Quadrant A Data is divided into 100 sec bins |
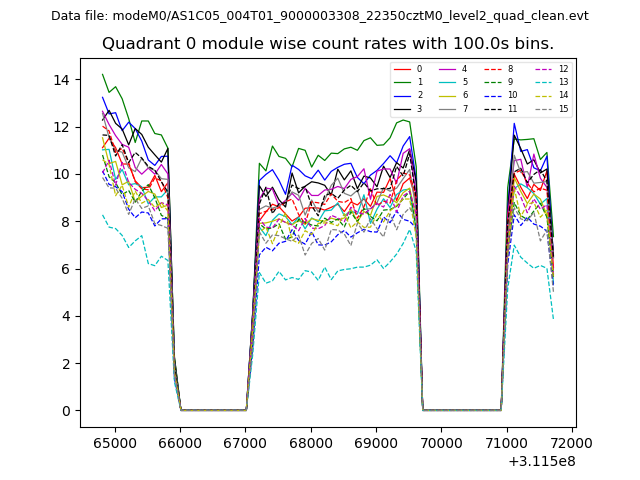 |
 |
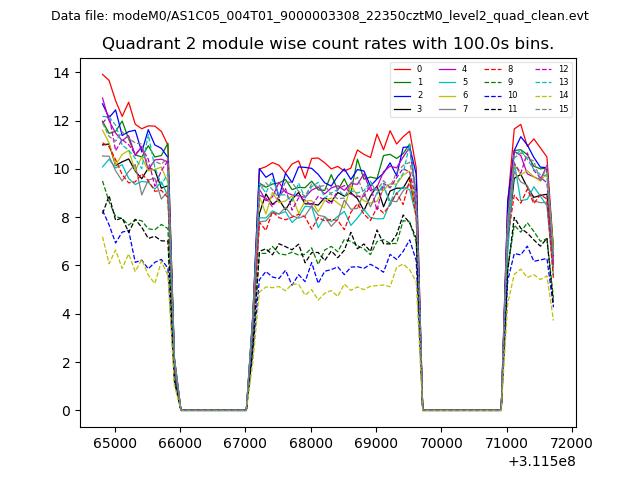
| Module-wise count rates for Quadrant B Data is divided into 100 sec bins |
 |
 |
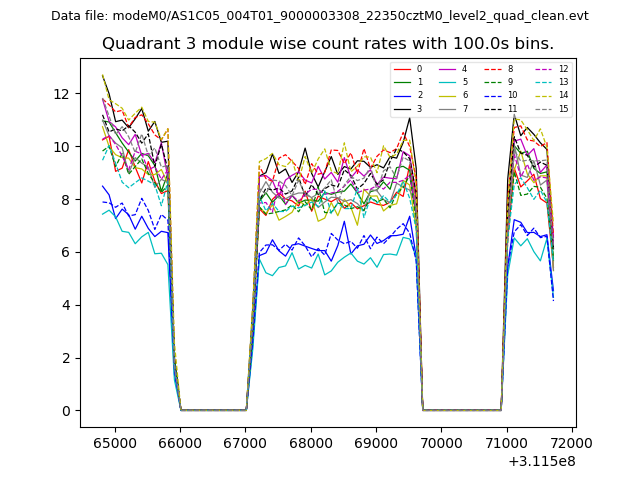
| Module-wise count rates for Quadrant C Data is divided into 100 sec bins |
 |
 |
| Module-wise count rates for Quadrant D Data is divided into 100 sec bins |
 |
 |
| Parameter | Plot |
|---|---|
| CZT HV Monitor | 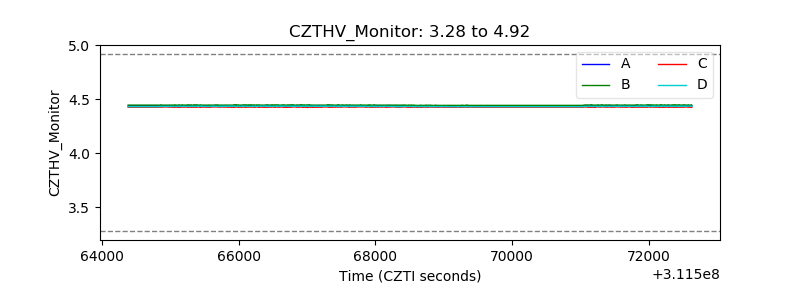 |
| D_VDD | 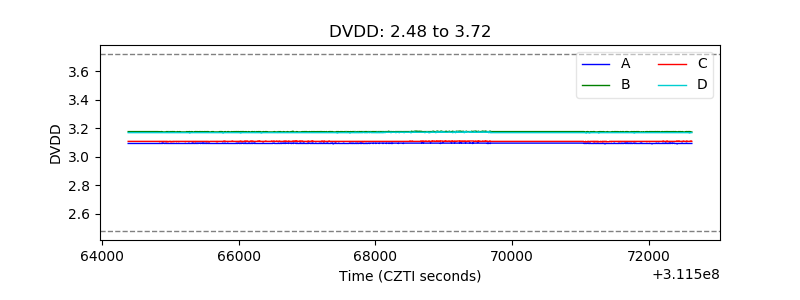 |
| Temperature 1 | 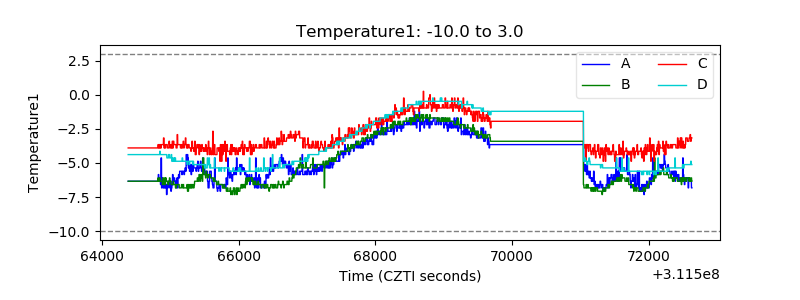 |
| Veto HV Monitor | 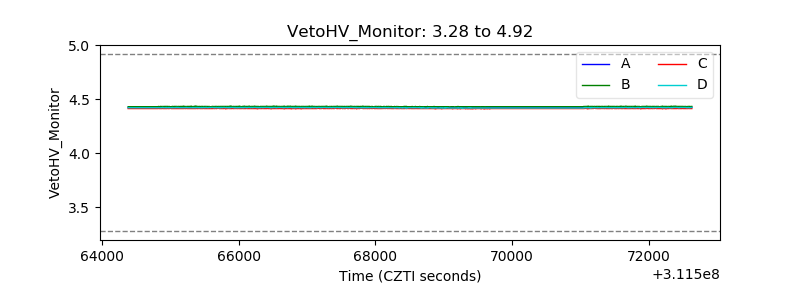 |
| Veto LLD | 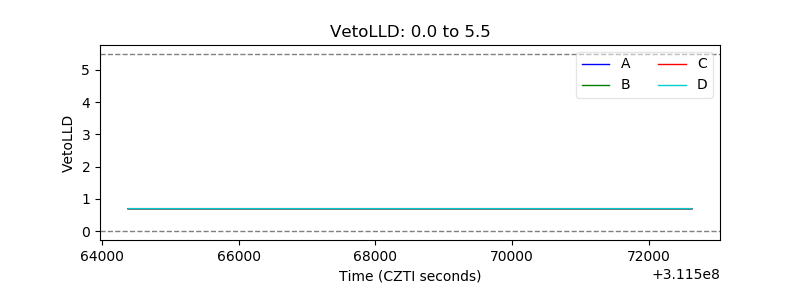 |
| Alpha Counter | 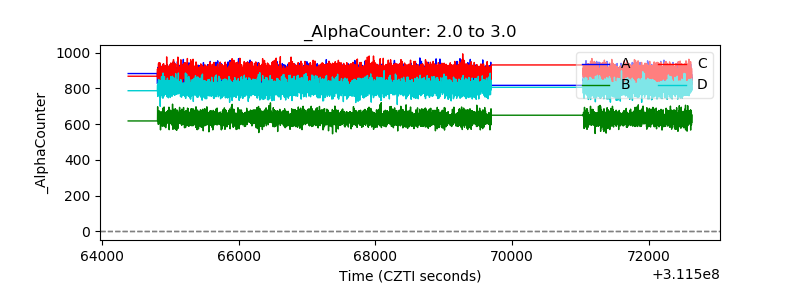 |
| _CPM_Rate | 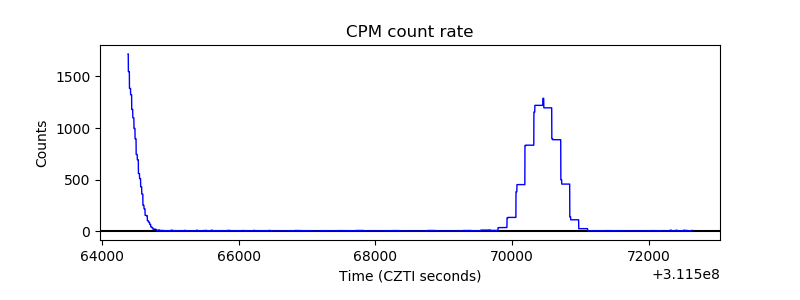 |
| CZT Counter | 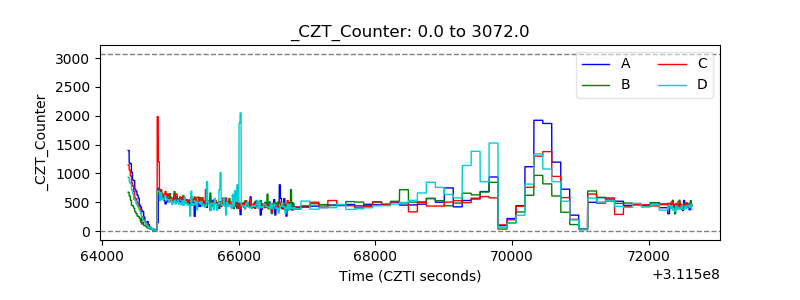 |
| +2.5 Volts monitor | 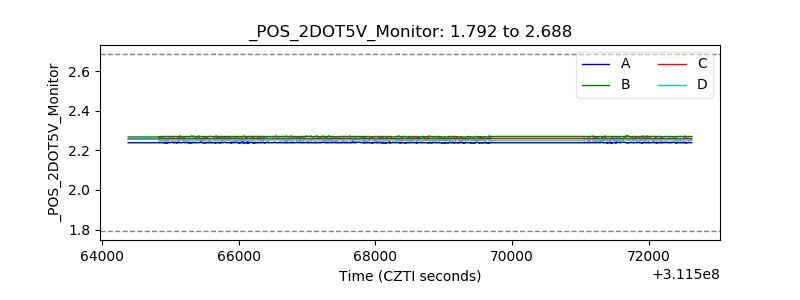 |
| +5 Volts monitor | 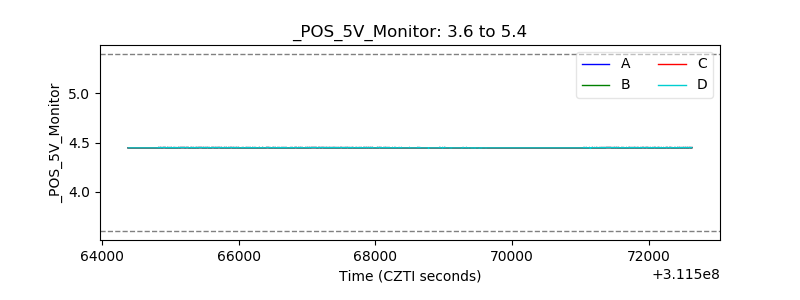 |
| _ROLL_ROT | 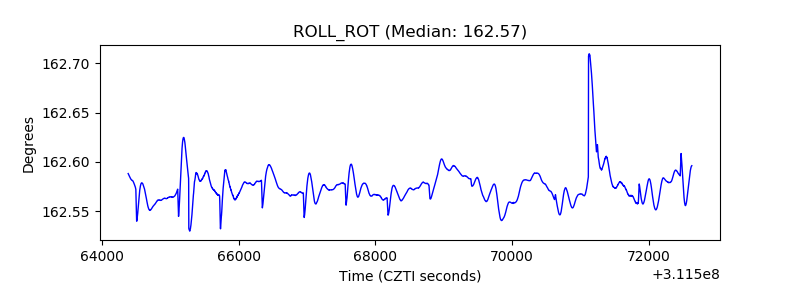 |
| _Roll_DEC | 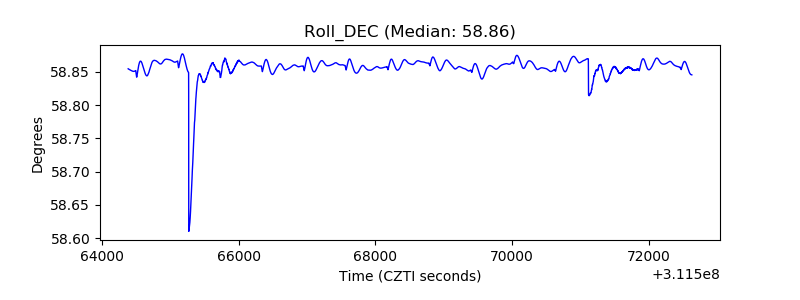 |
| _Roll_RA | 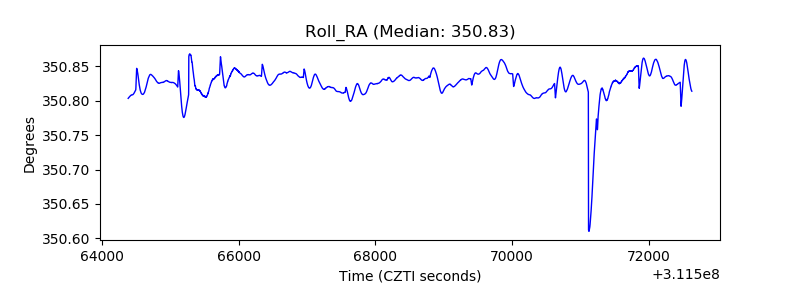 |
| Veto Counter | 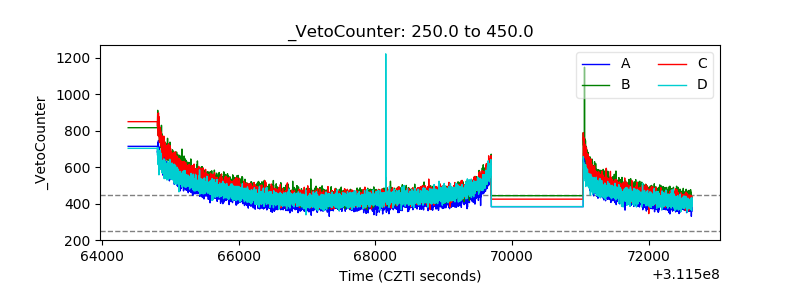 |